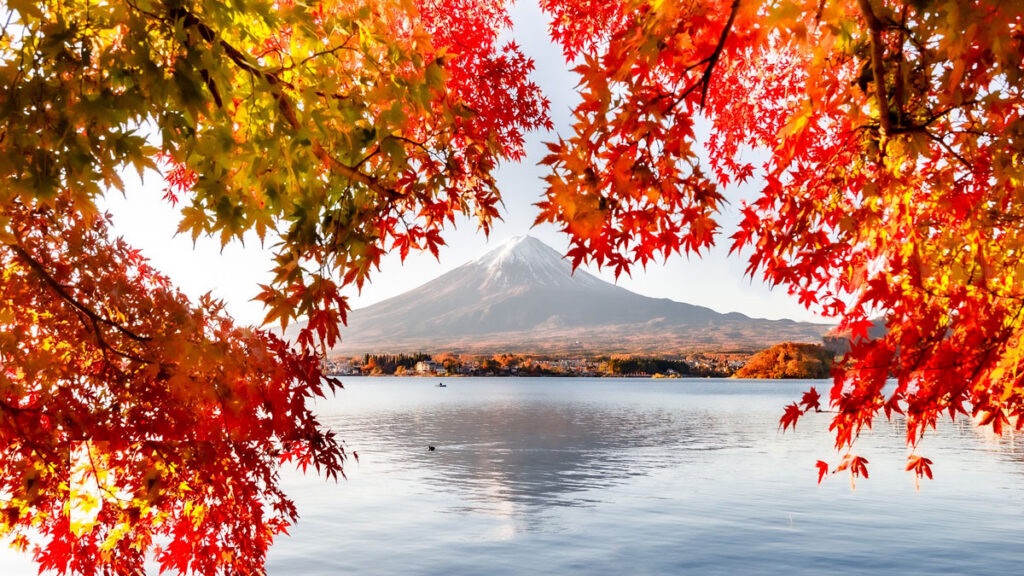
Magma on the move can cause the ground around a volcano to heave in measurable ways. But surface deformation doesn’t always point to an impending eruption—new results show that the terrain around a volcano can also shift during episodes of heavy rainfall. Researchers studying Japan’s Mount Fuji spotted instances of centimeter-level ground deformation tied to intense precipitation. Fortunately, such events can be readily differentiated from deformation caused by magmatic activity, the team repor
Magma on the move can cause the ground around a volcano to heave in measurable ways. But surface deformation doesn’t always point to an impending eruption—new results show that the terrain around a volcano can also shift during episodes of heavy rainfall. Researchers studying Japan’s Mount Fuji spotted instances of centimeter-level ground deformation tied to intense precipitation. Fortunately, such events can be readily differentiated from deformation caused by magmatic activity, the team reported in Geology.
Keeping an Eye on Volcanoes
Volcanoes around the world, from Kīlauea in the United States to Calbuco in Chile, are outfitted with arrays of sensors. Mount Fuji is no exception—the region around the edifice is equipped with dozens of instruments to detect ground movement, infrasound, and other signs of potential volcanic unrest. All that monitoring is warranted: Shin-Fuji (“Younger Fuji”)—the youngest of Mount Fuji’s three overlapping volcanoes—is currently active.
Shuo Zheng, a hydrological geodesist at Hong Kong Polytechnic University in China, and his colleagues recently mined some of those Mount Fuji data. The team focused on Global Navigation Satellite System (GNSS) observations—otherwise known as GPS data—collected daily from 2017 to 2023.
Rain and Rise
Zheng and his collaborators found several instances in which the two GNSS stations located within 10 kilometers of the summit of Mount Fuji recorded clear signs of uplift. Those signals, reflecting changes of roughly 1–2 centimeters, far exceeded the sensors’ millimeter-level precision. And when the team correlated the timing of that uplift with rain gauge records, they found that the ground often tended to rise almost immediately during periods of heavy precipitation (defined as several tens of millimeters of rain falling per day).
“They can store and transmit groundwater, acting like aquifers.”
There’s likely a physical link behind that correlation, the researchers surmised. The explanation involves the so-called clinkers that cap each of Mount Fuji’s subterranean layers of lava. Clinkers are layers of small rocks that form when the surface of a lava flow rapidly cools, and these structures persist in the shallow subsurface of Mount Fuji. “They can store and transmit groundwater, acting like aquifers,” Zheng said.
Clinkers, or layers of small rocks that form from cooling lava, can store and transmit water. They may be responsible for the way Mount Fuji’s surface uplifts in response to heavy rainfall. Credit: U.S. Geological Survey
When water fills up the pore space within a clinker, there’s no place for the overlying ground to go but up. It therefore makes sense that GNSS stations located atop old lava layers would exhibit uplift in response to intense rainfall, the team concluded.
When Zheng and his collaborators analyzed data from the nine GNSS stations located between 25 and 40 kilometers from the summit, however, they found that the ground actually tended to subside during periods of heavy precipitation. “There are two different responses,” said Kosuke Heki, a geophysicist and geodesist at Hokkaido University in Japan and a member of the research team. That subsidence is a known effect, and it’s been observed in a variety of locales. The subsidence doesn’t dominate closer to the summit of Mount Fuji because of the presence of the clinker layers there, the team reasoned.
Long-Lasting Magma
“Uplift by rain easily terminates when it stops raining.”
The uplift that the team recorded close to the summit of Mount Fuji tended to last just a day or two; it disappeared when the rainfall ceased. That timing is key for differentiating precipitation-induced uplift from magma-induced uplift. “Uplift by rain easily terminates when it stops raining,” said Heki. “But magma has a much longer timescale. It continues for weeks or months.”
That difference is critical, said Luca Caricchi, a volcanologist at the Université de Genève who was not involved in the research. There’s long been the mindset that ground deformation means that an eruption is imminent, but these new findings show that a heaving volcano doesn’t always mean that magma is on the move, said Caricchi. If the deformation is short-lived, the explanation might just be precipitation, he said. “You don’t need to worry.”
Zheng and his colleagues have looked for a similar effect for other volcanoes in Japan. They didn’t find any conclusive trends when they analyzed a chain of island volcanoes south of Tokyo, however. Perhaps that’s because the clinker layers beneath those edifices are so close to the sea that water efficiently drains out of them, the team hypothesized.
When it comes to thriving at high elevation, diminutive plants are always a safe bet. And low-lying vegetation is in fact colonizing higher and higher reaches as the climate changes, new results reveal. Researchers analyzed more than 2 decades’ worth of satellite data and showed that the vegetation line in the Himalayas is moving upward, in some cases by up to several meters per year. These changes have implications for the hydrology of the region and therefore for water resources for the popul
When it comes to thriving at high elevation, diminutive plants are always a safe bet. And low-lying vegetation is in fact colonizing higher and higher reaches as the climate changes, new results reveal. Researchers analyzed more than 2 decades’ worth of satellite data and showed that the vegetation line in the Himalayas is moving upward, in some cases by up to several meters per year. These changes have implications for the hydrology of the region and therefore for water resources for the population centers located downstream, the team reported last month in Ecography.
Mountains and People
“If you’re going to understand climate change across the Himalayas, you can’t just look at one location.”
The Himalayas, with their massive stores of frozen water, are part of a region known as the planet’s “Third Pole.” Nearly a billion people rely on water sourced from this area, but the Himalayas aren’t immune to climate change—shifts in temperature and precipitation patterns are causing glaciers to melt and permafrost to thaw, among other effects. “The Himalayan mountains are experiencing a lot of ecosystem changes,” said Ruolin Leng, an Earth scientist who led this new research while at the University of Exeter in the United Kingdom. She currently works at H2Tab, a wellness company.
And while the macroscopic effects of climate change in mountainous regions—the melting of the aforementioned glaciers, for example—have been readily studied, shifts in vegetation are often overlooked, said Leng. That’s a problem because plant cover affects everything from soil moisture levels to water runoff to the albedo of the planet’s surface, all of which have consequences for how water moves through the larger system, she said. “It’s a very important factor in the hydrological system.”
Leng and her colleagues focused on six sites, each roughly 40,000 square kilometers in size, in Bhutan, Nepal, and politically disputed areas farther west. Altogether the locales spanned roughly 15° in longitude (about the width of a U.S. time zone). The choice to analyze several locations along an east-west gradient was deliberate, said Stephan Harrison, a climate scientist also at the University of Exeter and a member of the research team. “The western Himalayas are very different from the eastern Himalayas in terms of climate. If you’re going to understand climate change across the Himalayas, you can’t just look at one location.”
Spotting Vegetation from Space
For each of those sites, the researchers mined satellite observations collected from 1999 to 2022 by the NASA/U.S. Geological Survey Landsat program. The researchers focused on visible and near-infrared observations to calculate a metric known as the normalized difference vegetation index (NDVI). Vegetation tends to reflect relatively little visible light while reflecting much more near-infrared light, and that fact can be exploited to infer the presence of vegetation in remote sensing data, said Karen Anderson, a remote sensing scientist at the Environment and Sustainability Institute at the University of Exeter and a member of the research team.
After masking out pixels too obscured by clouds or snow to correctly analyze, Leng and her colleagues calculated the NDVI for each 30- × 30-meter Landsat pixel within their study regions. The team retained pixels with NDVI levels above a minimum threshold and used those data, combined with topography information, to estimate the maximum elevation that was reliably vegetated each year. All six sites exhibited upward trends in the elevations of their vegetation lines over time, the researchers found. A site in central Nepal straddling the country’s northern border recorded the largest changes: From 1999 to 2022, the elevation of its vegetation line rose from roughly 5,520 meters to 5,670 meters, an increase of just under 7 meters per year on average. The five remaining sites all recorded annual upward shifts ranging from about 1 to 6 meters per year on average.
“Broadly speaking, plants are moving up mountains,” said Anderson. But different regions are responding differently, she added. (And while similar results have been previously noted in the Himalayas, not all plant life everywhere is moving up—recent research has shown that some tree lines are in fact moving downslope.)
A Climatic Culprit?
“People neglect the little plants.”
To investigate the potential drivers behind these changes, the team studied correlations with three climatic parameters: temperature, total precipitation, and snow depth. These data came from the European Centre for Medium-Range Weather Forecasts reanalysis dataset, which has a spatial resolution of roughly 30 kilometers.
Leng and her collaborators found that their site with the fastest-changing vegetation line also recorded the most rapid increase in snow depth over time. These two changes might therefore be linked, but more work is needed, Anderson admitted. “We haven’t addressed the causal link here. We’ve simply looked for patterns.”
There’s also a significant mismatch in the spatial resolution of the team’s meteorological data and their Landsat data, said Trevor Keenan, an ecosystem scientist at the University of California, Berkeley not involved in the research. Such a discrepancy can be particularly problematic in complex landscapes like mountain ranges because the coarse meteorological data might not be capturing the true microclimates that are bound to persist in such places, he said. “With heterogenous terrain and large elevational gradients, you really need that microclimate information.”
Sagarmatha National Park in Nepal, home to Mount Everest, is also host to rhododendron forests like this one. Credit: Peter Prokosch, CC BY-NC-SA 2.0
Anderson knows the geographical complexity of the Himalayas firsthand—in 2017 and 2022, she and other scientists conducted fieldwork in Nepal that informed this research. Those trips were a special opportunity to see plants like dwarf rhododendron thriving in tough conditions, she said. And it was a good lesson in appreciating some of the most diminutive members of the plant kingdom, Anderson added. “People neglect the little plants.”
Scientists agree that to have a chance of keeping the world’s warming below the Paris Agreement limit of 1.5°C (2.7°F), humanity needs most oil, gas, and coal to remain in the ground. This “unburnable” or “unextractable” carbon would not contribute to global carbon emissions.
But where, exactly, should we prioritize shutting down or banning fossil fuel activities? A new study published in PLoS One provides an answer for the Arctic with an atlas showing where oil and gas activities overlap wi
Scientists agree that to have a chance of keeping the world’s warming below the Paris Agreement limit of 1.5°C (2.7°F), humanity needs most oil, gas, and coal to remain in the ground. This “unburnable” or “unextractable” carbon would not contribute to global carbon emissions.
But where, exactly, should we prioritize shutting down or banning fossil fuel activities? A new study published in PLoS One provides an answer for the Arctic with an atlas showing where oil and gas activities overlap with vulnerable ecosystems, important wildlife species, and Indigenous land.
“We’re investigating the idea of unburnable carbon with a geographical perspective,” said Daniele Codato, a geographer at the Università de Padova in Italy and lead author of the new study. “We focus on where to keep oil and gas underground.”
The atlas is meant to help decisionmakers prioritize areas where it is essential to avoid opening new frontiers or where current oil and gas extraction should be halted because of social, cultural, ecological, or climate justice criteria, he said.
Overlaps, Mapped
Codato and a team of researchers created their Arctic atlas with dozens of public datasets from five Arctic polities known to have oil and gas activities (Alaska (United States), Canada, Greenland (Denmark), Norway, and Russia). Though various geographic definitions of the Arctic exist, the team chose a boundary used to evaluate wildlife and conservation by the Conservation of Arctic Flora and Fauna (the biodiversity working group of the Arctic Council, an intergovernmental organization focused on Arctic governance) to include the largest possible portion of vulnerable ecosystems.
The resulting maps revealed more than 512,000 square kilometers—an area about the size of Spain—of Arctic territory with existing or planned fossil fuel activities, including leases, areas under bid, exploration licenses, and infrastructure. Within those areas, the researchers counted 44,539 active wells and nearly 40,000 kilometers (about 25,000 miles) of pipelines.
Oil and gas wells in the Arctic are highly concentrated in northwestern Canada, northern Alaska, and northern Russia. The CAFF boundary identifies the Arctic region as defined by the Conservation of Arctic Flora and Fauna (the biodiversity working group of the Arctic Council). Click image for larger version. Credit: Codato et al., 2026, https://doi.org/10.1371/journal.pone.0345775
Next, the researchers determined how oil and gas activities overlapped with protected areas defined by the International Union for Conservation of Nature and conservation priority areas defined by three other nongovernmental organizations. Fossil fuel activities threaten wildlife by altering habitats, disrupting migratory routes, and releasing pollutants.
Of the area containing oil and gas activities, more than 7% overlapped with ecologically protected areas, and more than 13% overlapped with the ranges of all of the three key Arctic species considered in the study: polar bears, yellow-billed loons, and caribou. The highest concentrations of oil and gas activities were in the Yamal Peninsula of Russia, northwestern Canada, and the North Slope of Alaska, all home to fragile ecosystems.
Seven percent of Arctic fossil fuel extraction areas mapped by the research team overlapped with ecologically protected areas. In some cases, such as in the Yamal`skij Nature Reserve in Russia (top right), protected area borders have been cut or delimited to avoid overlapping with protected area boundaries, possibly indicating that protected areas have been downsized or redesigned to accommodate fossil fuel infrastructure. ANWR = Arctic National Wildlife Refuge. Click image for larger version. Credit: Codato et al., 2026, https://doi.org/10.1371/journal.pone.0345775
Mapping revealed that 87.21% of leases in Alaska and more than 13% of total Arctic concessions for fossil fuel activities overlapped with the ranges of all three of the key Arctic species considered in the study (polar bears (Ursus maritimus), caribou (Rangifer tarandus), and yellow-billed loons (Gavia adamsii)). Click image for larger version. Credit: Codato et al., 2026, https://doi.org/10.1371/journal.pone.0345775
The researchers also discovered that 73% of land with oil and gas activities overlapped with Indigenous Peoples’ lands, defined in the study as lands where Indigenous communities maintain significant influence over land management. Fossil fuel activities can threaten Indigenous communities’ health and ways of life, though the authors note that overlaps between Indigenous Peoples’ lands and fossil fuel activities do not necessarily indicate an opposition between the two.
Oil and gas concessions cover more than 4% of Indigenous Peoples’ lands (IPLs) in the Arctic. Click image for larger version. Credit: Codato et al., 2026, https://doi.org/10.1371/journal.pone.0345775
“It’s a really interesting idea to create an atlas of unburnable carbon and try to make visible where tensions might occur between Indigenous land, ecosystems, [and fossil fuel activities],” said Mariel Kieval, a researcher at the Arctic Institute, a nonprofit research organization. The overlaps noted in the atlas are an “initial indicator” providing opportunities for further research that zooms in on specific areas, she said.
Kieval also said the atlas could be helpful for local communities trying to identify where extraction activities are occurring nearby.
Policy Paradigm
The atlas’s effort to express the urgency of action to the public and policymakers is useful, said Paul Ekins, an economist at University College London who was part of the team that coined the term “unburnable carbon.” “Any way in which atlases or discussions or slogans can up the political ante so that politicians become braver in seeking to address this issue is to be welcomed.”
In particular, Codato hopes the atlas will fuel a “paradigm shift” in global policy that would ultimately ban the proliferation of fossil fuel activities in the Arctic.
The need for an intergovernmental ban on fossil fuel activities is evidenced by the Arctic National Wildlife Refuge in Alaska, Codato said: The refuge received temporary protections against drilling under the Biden administration, but the Trump administration plans to open the refuge for oil and gas leases this summer. “We need something stronger” to avoid such administration-by-administration changes in Arctic protections, he said.
“If we don’t start to ban fossil fuels in the Arctic now, it could become another sacrifice zone.”
Such a paradigm shift will be more important than ever as warming in the Arctic provides new access to resources and opportunities for trade that may accelerate ecological and cultural disruptions. “If we don’t start to ban fossil fuels in the Arctic now, it could become another sacrifice zone,” like some parts of the Amazon rainforest, Codato said.
Policy actions have fallen far behind the science, Ekins said. “There should have been an agreement not to exploit fossil fuels in the Arctic well before the ice had melted to a sufficient extent to make that a practical possibility.”
In 2023, the research team published a similar atlas identifying unburnable carbon in the Ecuadorian Amazon and plans to continue to expand their atlas to include the rest of the world. The team is currently working on projects that cover Brazil, Italy, Nigeria, and the United Kingdom.
Citation: van Deelen, G. (2026), This Arctic atlas shows where oil and gas activities overlap with wildlife and Indigenous communities, Eos, 107, https://doi.org/10.1029/2026EO260139. Published on 7 May 2026.
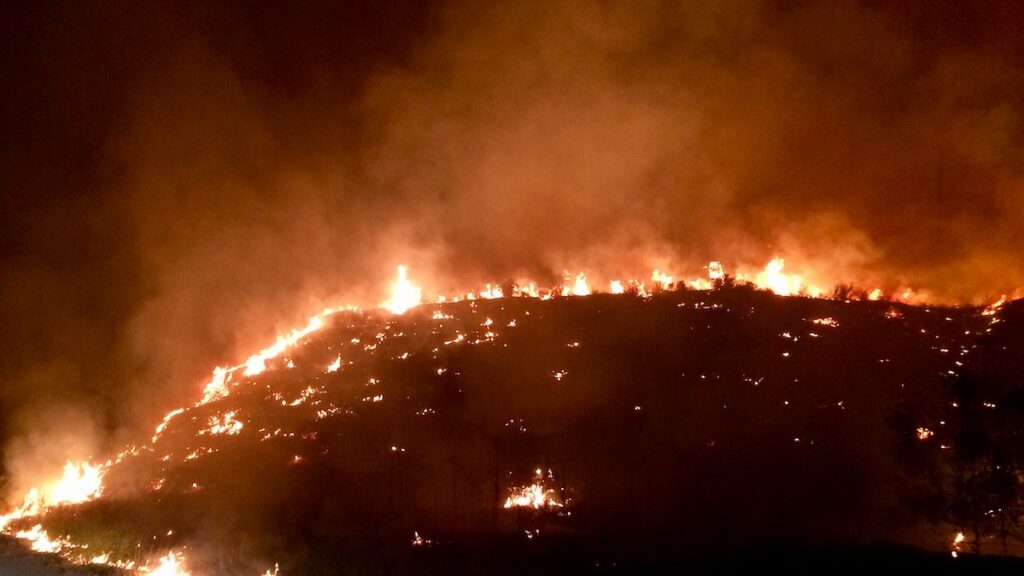
California is no stranger to the hot, dry summer weather that makes wildfires more likely. But wildfire season in the state is now stretching into the heart of winter, when it has historically been protected by cool, wet weather. In January 2025, Southern California experienced some of the deadliest and costliest wildfires in the state’s history.
Now, a new study published in Nature Communications shows that the climatic changes that increase the risk of these winter wildfires could be drive
California is no stranger to the hot, dry summer weather that makes wildfires more likely. But wildfire season in the state is now stretching into the heart of winter, when it has historically been protected by cool, wet weather. In January 2025, Southern California experienced some of the deadliest and costliest wildfires in the state’s history.
Now, a new study published in Nature Communications shows that the climatic changes that increase the risk of these winter wildfires could be driven by low autumn snow levels thousands of miles away, in western Eurasia. The authors said that tracking snowfall in Eurasia could help forecast winters in California that will have higher chances of wildfires.
The researchers were motivated by the catastrophic 2025 wildfires to search for climate drivers of winter wildfire conditions in California. First, they looked for correlations between winter wildfires and ocean temperatures, especially La Niña events that are associated with drier-than-average conditions in California. They also examined variability in sea ice, which can affect global weather patterns. But they saw only weak connections.
Compared to oceans and sea ice, the influence of snow cover on global weather patterns is less studied, said Shineng Hu, a climate scientist at Duke University and lead author of the paper. But another climate researcher in Hu’s lab, Shizuo Liu (first author of the study), had previously studied the connection between snow cover and weather patterns and suggested the team look for connections between snow and fires. That’s when they found significant correlations between the winter wildfires in California and low snow cover in western Eurasia.
“When I saw the result, I was suspicious,” Hu said, “because we all know that correlation doesn’t mean causality.” But they ran hundreds of climate model simulations reducing snow cover in Eurasia and saw an increased probability of winter fires in California. “At that point, we were pretty much convinced that there could be something interesting happening over there,” Hu said.
Propagating Pressure
“I’m glad to see this group saying snow can do something similar to what ocean temperature anomalies can do.”
The scientists determined that this intercontinental link starts because the land absorbs more energy when snow cover is low, disturbing the atmosphere above it. This disturbance, like a stone thrown into water, generates large waves of air called Rossby waves that travel eastward along the jet stream across the Pacific Ocean. The Rossby waves drive the formation of a high-pressure zone that creates the hot, dry, windy conditions conducive to wildfires.
“I’m glad to see this group saying snow can do something similar to what ocean temperature anomalies can do,” said Judah Cohen, a climatologist at the Massachusetts Institute of Technology who was not involved in the study but has also studied the links between snow in North America and Eurasia. “I’ve been surprised by how important this mechanism is for U.S. weather in the winter and how little there is about it in the literature.”
“This is just one missing gap that people didn’t even realize. We want to add that to the table.”
But Cohen suggested the study tells only part of the story. In North America, dry winters in the west are paired with wet, cold winters in the east. The same is true in Eurasia, and according to Cohen’s past research, when snow levels are low in western Eurasia but high in eastern Eurasia, a temperature and pressure gradient is created across the continent. The energy released as the atmosphere works to equalize that pressure drives the Rossby waves. Cohen said the disparity between snow levels in eastern and western Eurasia would likely strengthen the Rossby waves and then the warming in California. “If all of Eurasia [had] below normal [snow levels], I don’t think you could easily excite this wave energy that propagates across the hemisphere.” He also stressed that Rossby waves don’t just travel eastward. They also travel upward into the stratosphere, where they bounce back down over North America and intensify the high pressure over the western United States.
Both Cohen and the study authors insisted that many other factors influence whether wildfires ignite in winter. “This is just one missing gap that people didn’t even realize. We want to add that to the table,” said Hu. But monitoring snow levels in Eurasia could offer signs of bad wildfire winters to come. The January 2025 Southern California fires were preceded by low snow levels in November and December in Eurasia, Hu said. “So there’s a 1‑month lag, which gives us some hope that we can use that for prediction.”
Citation: Chapman, A. (2026), Low snow in Eurasia linked to wildfires in California, Eos, 107, https://doi.org/10.1029/2026EO260138. Published on 13 May 2026.
Editors’ Highlights are summaries of recent papers by AGU’s journal editors.
Source: AGU Advances
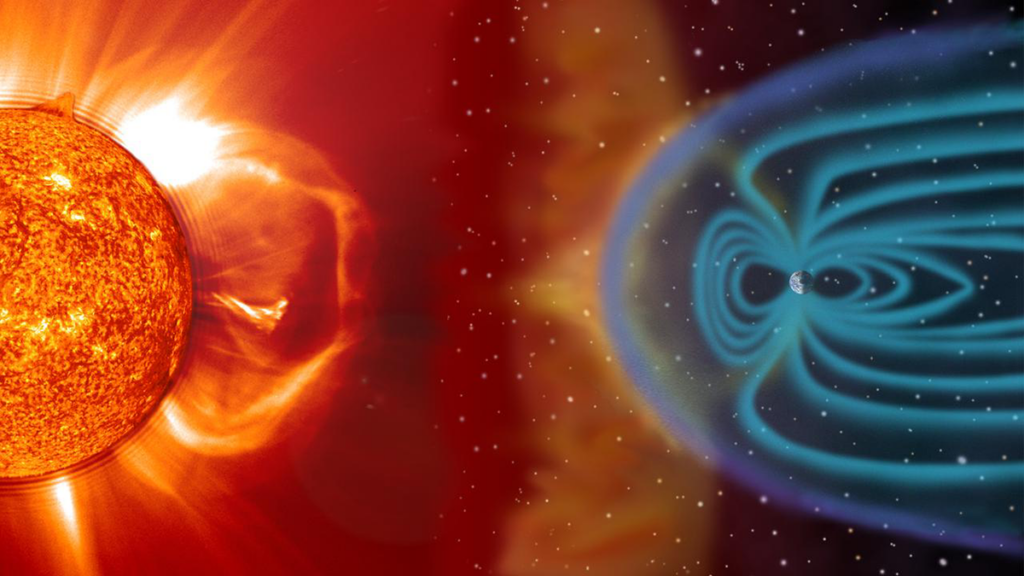
Solar eruptions can trigger geomagnetic storms that disrupt satellites, GPS, and power grids, affecting daily activities and technology. Therefore, it is extremely important to understand these storms in order to mitigate their impact. Previous studies mainly focused on interplanetary conditions.
Ghag et al. [2026] investigate the interaction between solar ultraviolet light (EUV) during st
Solar eruptions can trigger geomagnetic storms that disrupt satellites, GPS, and power grids, affecting daily activities and technology. Therefore, it is extremely important to understand these storms in order to mitigate their impact. Previous studies mainly focused on interplanetary conditions.
Ghag et al. [2026] investigate the interaction between solar ultraviolet light (EUV) during storms and the Earth magnetic field, taking into account its misalignment and offset with respect to the Earth’s rotational axis, which depend on time. Such misalignment and offset induce variations in EUV exposure in turn influencing the ionosphere and its interaction with the magnetosphere.
The study applies the Multiscale Atmosphere-Geospace Environment (MAGE), a physics based fully coupled whole geospace model. The causal relationship between storm timing and storm effect is explored revealing insights on our capability to predict storm impact based on the time dependent Earth system state.
The rotation of the magnetic pole around the rotational pole in the NH and SH. The location of the rotational pole is denoted in blue and the magnetic pole in red. Credit: Ghag et al. [2026], Figure 6c
Citation: Ghag, K., Lotko, W., Pham, K., Lin, D., Merkin, V., Raghav, A., & Wiltberger, M. (2026). Universal time influence on stormtime magnetosphere ionosphere coupling. AGU Advances, 7, e2025AV002071. https://doi.org/10.1029/2025AV002071
Editors’ Highlights are summaries of recent papers by AGU’s journal editors.
Source: Journal of Geophysical Research: Earth Surface
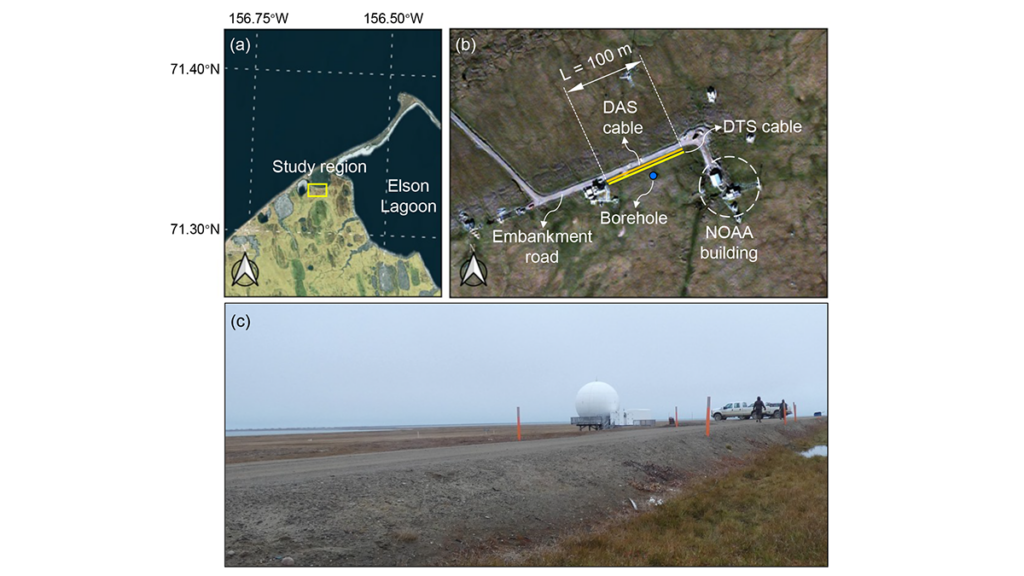
Permafrost beneath Arctic roads is warming and becoming less stable, creating growing risks for northern infrastructure. Yet predicting how frozen ground will evolve remains difficult because subsurface conditions vary sharply over short distances, observations are sparse, and conventional process-based models are not easy to update as new field data arrive.
Source: Journal of Geophysical Research: Earth Surface
Permafrost beneath Arctic roads is warming and becoming less stable, creating growing risks for northern infrastructure. Yet predicting how frozen ground will evolve remains difficult because subsurface conditions vary sharply over short distances, observations are sparse, and conventional process-based models are not easy to update as new field data arrive. In a new study, Gou et al. [2026] address that challenge at an embankment road in Utqiaġvik, Alaska, using fiber-optic temperature measurements collected along a 100-meter transect to track how shallow ground conditions change through time. Rather than treating monitoring and modeling as separate tasks, the authors link them in a framework designed to evolve with the physical system itself.
What stands out here is not simply the use of machine learning, but the way the authors build a physics-informed digital twin for permafrost under infrastructure. Their framework embeds a neural network within a heat-transfer solver, so the governing physics remain central while the model can still update uncertain soil properties as new observations arrive. This study moves beyond black-box prediction toward an interpretable, updateable system that can reconstruct subsurface temperature fields, infer thermodynamic properties such as unfrozen water content and thermal conductivity, and then test those inferences against independent DAS data, borehole temperatures, and laboratory measurements. This makes the work more than a site-specific modeling exercise; it offers a credible pathway toward near-real-time permafrost forecasting and infrastructure monitoring in a rapidly warming Arctic.
Framework of the proposed digital twin model. The neural network (NN) takes soil temperature at each lateral position as input and outputs six unknown parameters that vary laterally with distance. These parameters are embedded in the heat‐transfer equation through constitutive relationships, and the resulting system is solved using a finite difference method (FDM). The difference between predicted and observed temperatures is computed and defined as “loss,” and the loss gradients are backpropagated to update the NN parameters. Credit: Gou et al. [2026], Figure 2
Citation: Gou, L., Xiao, M., Zhu, T., Martin, E. R., Wang, Z., Rocha dos Santos, G., et al. (2026). Physics-informed digital twin for predicting permafrost thermodynamic characteristics under an embankment road in Utqiaġvik, Alaska. Journal of Geophysical Research: Earth Surface, 131, e2025JF008787. https://doi.org/10.1029/2025JF008787
In April 2026 I recorded 36 fatal landslides causing 90 fatalities, the lowest monthly total for 2026 to date.
This is my regular update for the number of fatal global landslides, focusing on March 2026. As usual, this data has been collected in line with the methodology described in Froude and Petley (2018) and in Petley (2012). References are listed below – please cite these articles if you use this analysis. Data presented in these updates should be treated as being provisional at thi
In April 2026 I recorded 36 fatal landslides causing 90 fatalities, the lowest monthly total for 2026 to date.
This is my regular update for the number of fatal global landslides, focusing on March 2026. As usual, this data has been collected in line with the methodology described in Froude and Petley (2018) and in Petley (2012). References are listed below – please cite these articles if you use this analysis. Data presented in these updates should be treated as being provisional at this stage as I will reanalyse them prior to formal publication, and other events will emerge.
The headline figures are as follows:
March 2026: 36 fatal landslides causing 90 fatalities;
This is an interesting result, unusually showing that fatal landslides in April were substantially lower than for any of the preceding months in 2026. This is the updated annual chart by month:-
The number of global fatal landslides in 2026 by month to the end of April.
Loyal readers will know that I like to present the running total using pentads (five day blocks). This is the cumulative total pentad graph to the end of Pentad 24 (which captures all of the events to the end of April):-
The cumulative total number of global fatal landslides in 2026 by pentad to the end of April.
Thus, whilst April 2026 was unexceptional compared with the previous months of this year, the number of fatal landslides was still above the long term mean. Overall, 2026 continues to run extremely hot, exceeding even the record-breaking year of 2024.
We now start to enter the crucial period of much higher global fatal landslide occurrence. Whilst in the long term dataset this acceleration typically occurs in June (or even July), in recent years it has happened in May, as the 2024 line shows. I will watch with great interest to see what happens this month.
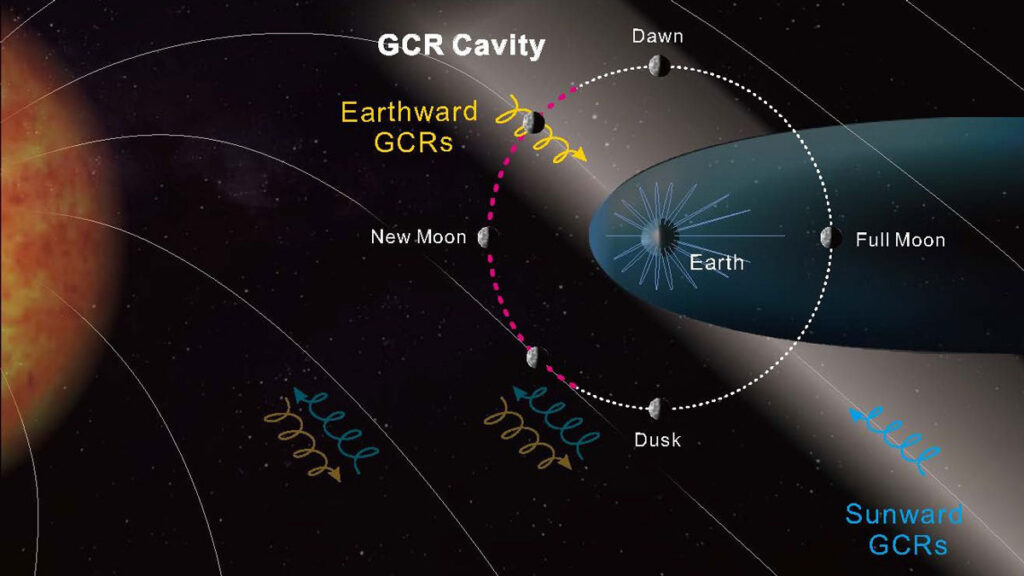
The solar system is bathed in galactic cosmic rays: protons and atomic nuclei traveling, nearly at the speed of light, from all directions. Earth’s magnetic field and atmosphere shield us from most of this harmful radiation, but outside of that shelter, the bombardment is strong enough to prove a threat to astronauts.
But a new analysis of data from the Chang’e-4 lunar lander published in Science Advances revealed an extended cosmic ray shelter stretching from Earth at an unexpected angle at
The solar system is bathed in galactic cosmic rays: protons and atomic nuclei traveling, nearly at the speed of light, from all directions. Earth’s magnetic field and atmosphere shield us from most of this harmful radiation, but outside of that shelter, the bombardment is strong enough to prove a threat to astronauts.
But a new analysis of data from the Chang’e-4 lunar lander published in Science Advances revealed an extended cosmic ray shelter stretching from Earth at an unexpected angle at least as far as the Moon, though exactly how far is unclear. When the Moon passes through this shelter in its orbit of Earth, the lunar surface experiences a roughly 20% reduction in the galactic cosmic ray flux.
“We found Earth casts kind of a shadow in the galactic cosmic ray space,” said Robert F. Wimmer-Schweingruber, a space physicist at Kiel University in Germany. “This was unexpected, and to me that was the cool part of this paper.”
The surprise came in part because the shape of Earth’s magnetic field is well understood: It forms a strong protective region around the planet known as the magnetosphere, with a long “tail” shaped by the solar wind of charged particles streaming from the Sun.
If the magnetotail is like a person’s shadow cast behind them by sunshine, this newly discovered bubble would be like if that shadow extended to the front of the person as well.
“You would expect an effect inside the tail or as [the Moon goes] through the tail, but we find an effect of the tail ahead of the tail,” said Wimmer-Schweingruber. He noted that if the magnetotail is like a person’s shadow cast behind them by sunshine, this newly discovered bubble would be like if that shadow extended to the front of the person as well and tilted rather than lying along a line connecting Earth, the Sun, and the Moon.
“The observed region of reduced [galactic cosmic ray] flux on the sunward side of the Moon’s orbit outside the geomagnetic field where it is compressed by the solar wind is unexpected,” Brian Flint Rauch wrote in an email. Rauch, a cosmic ray physicist at Washington University in St. Louis who was not involved in the Chang’e-4 study, added that any reduction in cosmic ray exposure is noteworthy for potential astronauts on the Moon.
A 20% decrease in flux during part of the lunar orbit is unlikely to make a large difference in determining when it’s safest for astronauts go out onto the lunar surface. But it might help guide individual decisions in the moment because while spacesuits won’t protect astronauts from cosmic rays, the metal of a habitat or lander would.
Shelter from the Storm
The China National Space Administration’s Chang’e-4 spacecraft was the first successful mission to the lunar farside, landing in the Von Kármán crater on 3 January 2019. As part of its suite of scientific instruments, the probe carried the Lunar Lander Neutron and Dosimetry experiment (LND) developed by Wimmer-Schweingruber and collaborators at Kiel University in an astonishingly rapid 18 months. This detector was designed in part to gauge conditions for human exploration by measuring the radiation on the Moon’s surface, including cosmic rays.
LND collected data between January 2019 and January 2022. Though Apollo astronauts carried radiation dosimeters, those instruments did not provide detailed information about fluctuations in exposure, making LND the primary source for such information from the lunar surface. For that reason, it provided the best data on galactic cosmic rays, which consist mostly of protons accelerated to nearly the speed of light in the remnants of supernovas.
Measurements show the ambient radiation dose on the lunar surface is more than twice as high as on the ISS and nearly 200 times as high as on Earth.
These protons arrive in the solar system from every direction, often undeflected by the magnetic fields of stars or planets. However, Earth’s magnetosphere is strong enough to repel many galactic cosmic rays in low orbit, where the International Space Station (ISS) resides. Meanwhile, measurements show the ambient radiation dose on the lunar surface is more than twice as high as on the ISS and nearly 200 times as high as on Earth, which is a matter of concern for long-term human presence on the Moon.
All of these reasons are why everyone was surprised when LND data revealed Earth’s magnetic protection extends far beyond the magnetosphere and at an angle to the line connecting Earth and the Sun. Lead author Wensai Shang of Shandong University in Weihai, China, worked out that the angle corresponds to the twisting of the Sun’s magnetic field.
“As the Sun rotates, it pulls the solar wind along the solar magnetic field,” Wimmer-Schweingruber said. “That produces a spiral.” Apparently, an unanticipated interaction between this twist in the solar magnetic field and Earth’s magnetic field produces the cosmic ray shelter revealed by LND.
Wimmer-Schweingruber noted that he was extremely skeptical that such results were possible at first. He warned Shang, a graduate student he worked with, that he might be wasting his time looking for cosmic ray anomalies in the Chang’e-4 data. It was only after Shang provided ironclad analyses ruling out other possibilities that he was swayed.
With the LND instrument shut off, researchers need other sources of data to continue the work. Wimmer-Schweingruber expressed particular interest in understanding how cosmic rays produce secondary radiation—especially neutrons, which are very dangerous to humans—when they impact the lunar soil. In the meantime, the general understanding of the radiation environment provided by Chang’e-4 shows we still have some surprises in store as humans explore the solar system.
Citation: Francis, M. R. (2026), Moon mission data reveal unexpected cosmic ray “shadow,” Eos, 107, https://doi.org/10.1029/2026EO260137. Published on 4 May 2026.
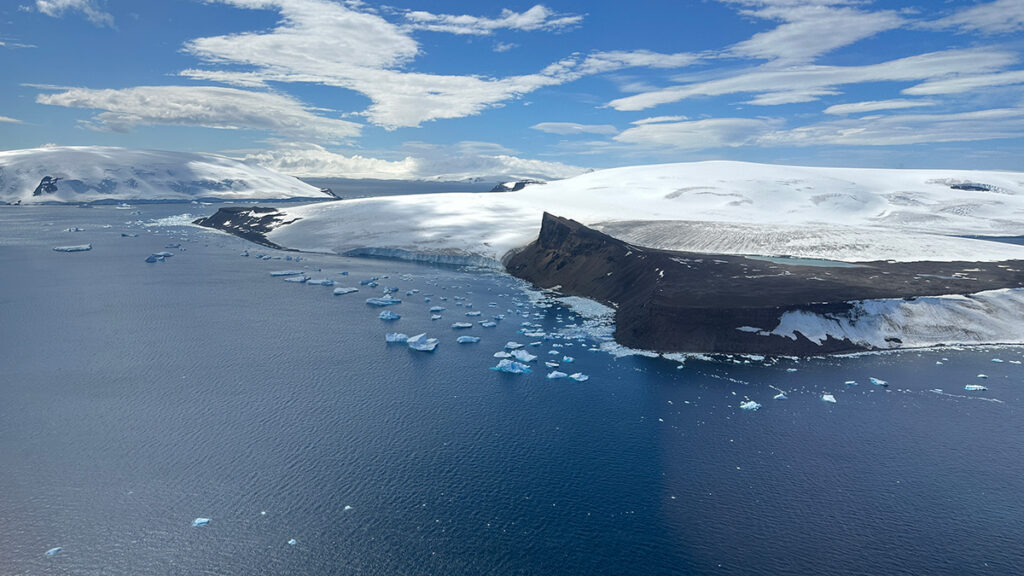
A critical ocean current that regulates Antarctica’s climate may have formed only once continents separated and winds aligned with new ocean passageways, according to a new study published in the Proceedings of the National Academy of Sciences of the United States of America.
Today, the Antarctic Circumpolar Current transports more than 100 times as much water as all of Earth’s rivers combined and, critically, insulates the Antarctic Ice Sheet from heat at lower latitudes. A clear picture of
Today, the Antarctic Circumpolar Current transports more than 100 times as much water as all of Earth’s rivers combined and, critically, insulates the Antarctic Ice Sheet from heat at lower latitudes. A clear picture of the origins of this current can help scientists further understand the relationships between contemporary ocean dynamics, the global climate, and ice formation in Antarctica.
“It’s very interesting to learn more about this current, how it developed, and what role it played in the climate change that was happening at that time,” said Hanna Knahl, a paleoclimatologist and doctoral student at the Alfred-Wegener-Institut in Germany and lead author of the new study.
The Birth of a Current
About 34 million years ago, Earth was undergoing a climatic shift, now known as the Eocene-Oligocene transition, during which atmospheric carbon dioxide decreased and the planet cooled.
Earth’s tectonic plates in the Southern Ocean moved away from each other, opening and deepening bodies of water such as the Tasmanian Gateway and the Drake Passage, which separate Antarctica, Australia, and South America.
For years, scientists hypothesized that the alignment of these newly formed waterways, along with westerly winds, could have channeled ocean water and spurred the formation of the Antarctic Circumpolar Current.
“The exact position of the westerly winds and their relative position to the [ocean] gateways have to click together.”
To test that hypothesis, Knahl and her colleagues simulated conditions of the early Oligocene Southern Ocean with a coupled model that included ocean dynamics, atmosphere and wind patterns, temperatures, ice sheet growth, and precipitation. The research team compared these simulations to data from actual Antarctic sediment cores and scans of the ocean floor.
Results confirmed that westerly winds were necessary for the Antarctic Circumpolar Current to form.
“The exact position of the westerly winds and their relative position to the [ocean] gateways have to click together,” Knahl said.
Joanne Whittaker, a marine geophysicist at the University of Tasmania who was not involved in the new study, was a coauthor of a 2015 study that proposed westerly wind alignment played a role in the formation of the current. Knahl’s study presents a more sophisticated model of the early Oligocene Southern Ocean and is a great next step in the investigation of the current’s origins, Whittaker said.
“They did a really nice job of taking a range of different people’s work and linking it all together,” she said.
Oligocene Understandings
“If you can have a model that works in the past, it’s going to give you confidence that it’s going to work for the future, as well.”
Scientists often use Earth’s past behavior to better understand how Earth systems may behave in the present or future. “If you can have a model that works in the past,” Whittaker explained, “it’s going to give you confidence that it’s going to work for the future, as well.”
The Eocene-Oligocene transition is a key to understanding the relationship between atmospheric carbon, ocean dynamics, and the glaciation of Antarctica, Whittaker said. Knowing how the current’s behavior affected carbon uptake millions of years ago helps scientists model how the present current’s behavior might also affect atmospheric carbon.
In addition to carbon uptake, the new research hints at how changes in westerly winds may influence the advance and retreat of the Antarctic Ice Sheet. Some modeling and proxy data indicate the westerly winds that spurred the Antarctic Circumpolar Current’s formation 34 million years ago have shifted in the past century and may continue to shift in the future. Understanding the role these winds initially played in the current’s development may shed light on the current’s present ability to guard the Antarctic Ice Sheet from warmer air masses.
There are still Oligocene patterns that require more research to sort out, though. For example, modeling in the new study showed interesting asymmetries in the timing of the development of different parts of the Antarctic Circumpolar Current, Knahl said. Scientists know from proxy data and modeling that similar asymmetry exists in the history of the Antarctic Ice Sheet; the ice sheet in East Antarctica began to form about 7 million years before the ice sheet began to form in West Antarctica.
“It could be interesting to see if there’s a connection between the asymmetries that we see here,” Knahl said. “Are they linked, or were they more or less independent?”
Citation: van Deelen, G. (2026), Widening channels and westerly winds together formed Earth’s strongest current, Eos, 107, https://doi.org/10.1029/2026EO260126. Published on 24 April 2026.
Research & Developments is a blog for brief updates that provide context for the flurry of news that impacts science and scientists today.
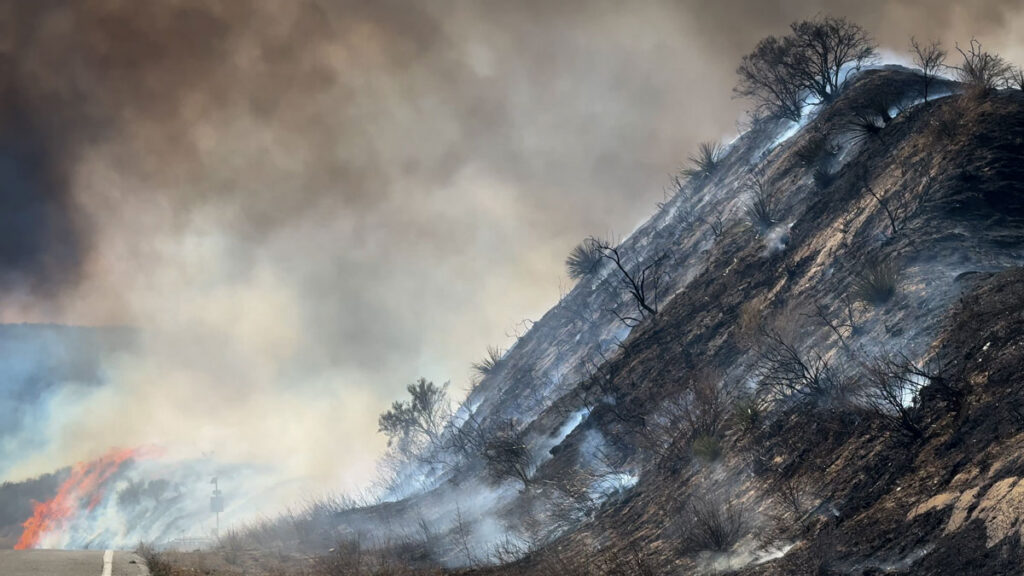
As the midpoint of the year approaches, several climate records have already been broken. Arctic winter sea ice extent reached a record low. Several countries saw record-breaking winter heat waves. And more than 150 million hectares have already burned globally in wildfires.
The increasingly likely emergence of an El Niño this summer will like
Research & Developments is a blog for brief updates that provide context for the flurry of news that impacts science and scientists today.
As the midpoint of the year approaches, several climate records have already been broken. Arctic winter sea ice extent reached a record low. Several countries saw record-breaking winter heat waves. And more than 150 million hectares have already burned globally in wildfires.
The increasingly likely emergence of an El Niño this summer will likely continue the year’s record-breaking weather trends and could lead to “an unprecedented year of global fire,” according to a statement from World Weather Attribution, a climate research collaboration.
“In modern human history, we’ve never experienced a strong or very strong El Niño event amid pre-existing conditions that were this warm globally.”
NOAA’s Climate Prediction Center predicts there is a 61% chance of El Niño—a natural climate pattern that involves warming waters in the Pacific Ocean—emerging by July 2026 and persisting through the end of the year. El Niño typically temporarily boosts global temperatures.
At a press briefing on 11 May hosted by World Weather Attribution, climate scientists outlined the potential risks of this emerging El Niño against the backdrop of human-caused climate change, including intensifying wildfire seasons, extreme heat waves, and worsening droughts.
In the press briefing, Frederike Otto, a climate scientist at World Weather Attribution and Imperial College London, emphasized that climate change will likely play a larger role in the rest of this year’s extreme weather events than El Niño will, pointing to more than 100 analyses done by World Weather Attribution that have controlled for the effects of the El Niño Southern Oscillation (ENSO), the broader climate phenomenon that produces El Niño and its sister condition, La Niña.
“We find that human-induced climate change has a much greater influence on the likelihood and intensity of extreme weather events than ENSO,” she said.
Still, El Niño could push average global temperatures to extremes. The effects of El Niño will “be amplified considerably by the now nearly 1.5°C [(2.7°F)] of global warming experienced as of 2026,” Daniel Swain, a climate scientist at the University of California, Los Angeles and the California Institute for Water Resources, said in a statement. “In modern human history, we’ve never experienced a strong or very strong El Niño event amid pre-existing conditions that were this warm globally.”
The global fire season has “got off to a very fast start,” particularly in the African savanna, Southeast Asia, and northeastern China, Theodore Keeping, who studies extreme weather and wildfires at Imperial College London and World Weather Attribution, said in the briefing. Though El Niño may have mixed effects on the U.S. wildfire season, much of the U.S. is expected to face elevated wildfire risk, and a strong El Niño could worsen wildfires elsewhere in the world, particularly in the Amazon rainforest and Australia, Keeping said.
More than 150 million hectares have burned in wildfires so far this year. Credit: Our World in Data, CC BY
“This rapid start [to the wildfire season], in combination with the forecast El Niño, means that we’re looking at a particularly severe year materializing,” Keeping said. “The likelihood of harmful, extreme fires potentially could be the highest we’ve seen in recent history.”
These updates are made possible through information from the scientific community. Do you have a story about science or scientists? Send us a tip at eos@agu.org.
The retreat of glaciers and ice sheets is expected to have widespread impacts on communities around the world because of its effect on sea levels. Already, the global average sea level is more than 10 centimeters higher than it was just 3 decades ago; and the rate of rise is increasing, contributing to increased storm surges and flooding, lost infrastructure and community lands, and more.
Recent reports on the instability of Antarctica’s Thwaites Glacier, for example, have focused attention
The retreat of glaciers and ice sheets is expected to have widespread impacts on communities around the world because of its effect on sea levels. Already, the global average sea level is more than 10 centimeters higher than it was just 3 decades ago; and the rate of rise is increasing, contributing to increased storm surges and flooding, lost infrastructure and community lands, and more.
Recent reports on the instability of Antarctica’s Thwaites Glacier, for example, have focused attention on how accelerating ice flow can lead to ice sheet collapse and rising sea levels.
Earth’s ice sheets accumulate ice through snowfall and lose mass through a mix of surface ablation, iceberg calving, and melting at their interface with the ocean. Glacial ice flows under its own weight, and the rate at which it flows to coastal areas is a primary control on ice sheet mass loss.
Flow rates depend on how much resistance an ice sheet encounters at its interface with the ground (e.g., whether it is frozen to its substrate) and on its effective viscosity, a measure of how strongly it resists deformation. The viscosity of ice, in turn, varies based on properties including temperature, crystal size and orientation, and impurity content.
Some properties within and beneath ice sheets that affect how they flow are anisotropic, meaning they vary by direction. For example, roughness in some directions at the ice bed can facilitate ice sliding more effectively than roughness in other directions, similar to the way a properly oriented corrugated metal roof allows snow to slide off. Several forms of anisotropy within ice also affect how ice flows from land to ocean (Figure 1).
Fig. 1. Anisotropy in glaciers and ice sheets has various sources, including from ice fabric and other properties within the ice (englacial) or at the ice-bed interface. Many forms of anisotropy in glacial ice can be measured with radar. Credit: Adapted from Hills et al., 2025, https://doi.org/10.1029/2024RG000842, CC BY 4.0
Measuring anisotropic properties is key to better understanding how quickly changes at the edges of the Greenland and Antarctic ice sheets will lead to sea level rise. Recent advances in ice-penetrating radar technology and in processing radar data are revolutionizing how we observe directionally varying ice sheet properties, paving the way for projections of mass changes that account for previously neglected processes.
Crystal Fabric: Memory and Modulator of Ice Flow
Fabric, the orientation of crystals composing ice, is the best studied and arguably most important of anisotropic ice sheet properties. As ice deforms, for example, by stretching horizontally as it flows toward the coast, its millimeter-scale crystals are reoriented (Figure 1).
Fabric thus contains a memory of past flow. Simultaneously, fabric influences flow because ice crystals are about 3 orders of magnitude easier to shear in some directions than others—similar to how stacked playing cards slide easily against each other when held along their edges but resist motion when pinched top to bottom.
Over the past 20 years, radar polarimetry has matured into a quicker and easier alternative means for inferring fabric.
The potential importance of fabric on large-scale ice flow has long been recognized, but a shortage of observations has made it difficult to quantify and validate its effect in ice sheet models. Until recently, fabric could be measured only directly in ice cores or inferred through seismic soundings. These methods provide highly detailed information about how fabric develops but are expensive, logistically taxing, and provide information only about sparse point locations.
Over the past 20 years, though, radar polarimetry has matured into a quicker and easier alternative means for inferring fabric, enabling observations at the scale of entire glaciers and providing new constraints on how fabric influences ice sheet flow.
How Radar Reveals Fabric
Ice-penetrating radar instruments emit electromagnetic energy as radio frequency waves. These waves reflect off interfaces within and beneath glacial ice, including transitions in ice chemistry and the contact surface between the ice sheet and the ground or water below. The properties of the reflected waves are then measured when they return to the radar. Just as fabric leads to anisotropic ice deformation, it also introduces directional dependence in the measured electrical properties.
The speed of a radar wave through an ice crystal is approximately 1% faster if the wave is polarized across the crystal’s principal (c) axis rather than aligned with it. Though small, this difference can compound enough that it causes measurable changes in returned radar signals.
In a typical radar survey over anisotropic ice, waves with different polarizations travel at slightly different speeds (Figure 2). The times that return signals arrive back at the receiver thus vary directionally, a difference that can be identified using polarimetric radars that transmit and receive radio waves at multiple orientations.
Fig. 2. Propagation of polarized radio waves through anisotropic ice reveals structural variations with depth because waves aligned across the prevailing ice fabric (represented by the ball, in which darker shading indicates a greater concentration of c axes) travel faster than waves aligned with the fabric. The phase delay increases as the effect of the anisotropy accumulates with depth. Credit: Adapted from Hills et al., 2025, https://doi.org/10.1029/2024RG000842, CC BY 4.0
Fabric’s effect on radar signal travel times accumulates through an ice column, so it is more prominent in thicker ice with stronger horizontal fabric (i.e., the ice crystals are more consistently aligned). In such cases, differences in travel times between polarizations can be measured even by standard radars.
When fabric is weaker or ice is thinner, the offset is smaller and detectable only by systems that can identify the phases of radar returns—that is, the exact positions of the returned waves in their oscillation cycle. Even small wave speed differences from weak fabrics accumulate into measurable phase shifts between polarizations, which can be used to determine the consistency of crystal alignment and the predominant crystal orientation.
Small differences in fabric through an ice column can also change the strength, or amplitude, of returned signals. This amplitude difference offers an independent way to identify fabric orientation and its depth variation.
Polarimetric radar has been widely applied in cryospheric science in recent years largely due to the advent of low-cost systems that can measure signal phases. For example, the popular Autonomous phase-sensitive Radio Echo Sounder (ApRES) is a lightweight, ground-based system that can be used to infer ice fabric at single points down to 2 kilometers deep. In the past decade, polarimetric ApRES systems have revealed ice flow histories, including changes in flow directions, of key glaciers over the past few millennia. These measurements offer windows into how ice sheets responded to previous climate variations.
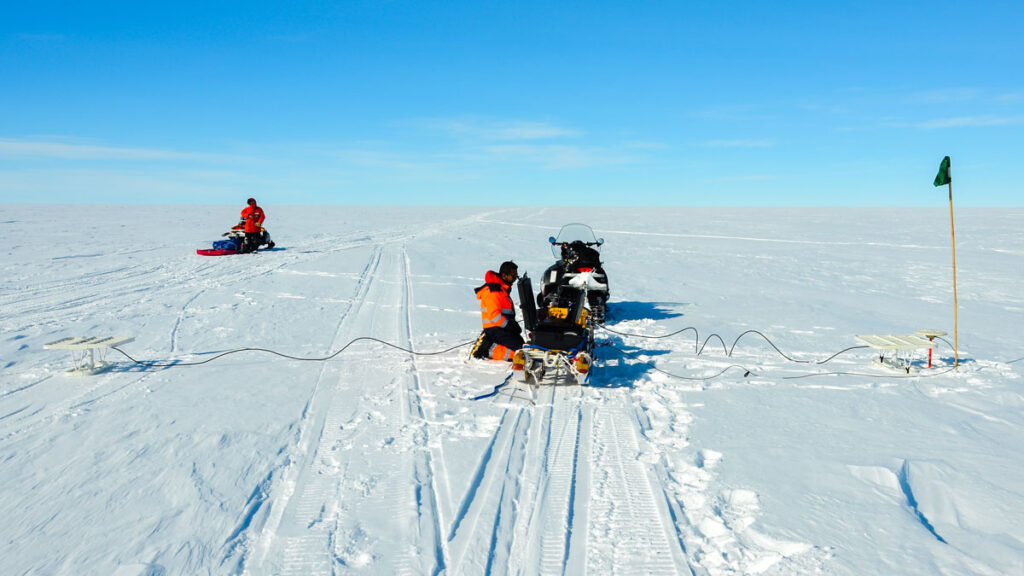
A mobile, quad-polarimetric radar is dragged by snowmobile over the surface of Müller Ice Cap on Axel Heiberg Island in Nunavut, Canada, in May 2023. Credit: David Lilien
The next generation of polarimetric radars go beyond one-point-at-a-time stationary soundings, offering full polarimetry capabilities on moving platforms. These systems may soon allow scientists to map directional ice properties at the scale of entire ice sheets.
Insights into Fast-Flowing Ice Fabric
The growing number of radar studies conducted near sites where ice cores have been collected, which allow fabric to be investigated up close, has provided validation and bolstered confidence that fabric can be inferred accurately from its effects on radar. Researchers now infer fabric from radar in more dynamic areas, such as Thwaites Glacier, Whillans Ice Stream, and the Northeast Greenland Ice Stream (NEGIS), where ice fabrics change over short spatial scales and where drilling ice cores is logistically difficult. Airborne radar surveys are particularly effective in these settings because they can efficiently map fabric variations across large, fast-moving areas.
Observations of strong fabrics in fast-flowing regions suggest that fabric is an important control on ice viscosity, although its implications for ice flow are just beginning to be explored. For example, at Rutford Ice Stream in Antarctica, ApRES data indicate that fabric causes sharp changes in viscosity in different directions with depth, a complexity not captured by current ice flow models.
A combination of airborne and ground-based radar shows that the fabric of the NEGIS varies substantially across the ice stream, which facilitates horizontal shear that allows faster and more cohesive flow in the middle of the ice stream while simultaneously stiffening this ice against along-flow stretching. These viscosity variations may alter how quickly coastal changes, such as increased melt due to climate warming, influence inland ice flow.
Scientists have studied ice sheet mass balance at glacier-mounted stations along the renowned “K-transect” near Kangerlussuaq in southwestern Greenland since the early 1990s. This image shows a view up the transect in April 2025. Polarimetric radar offers another tool with which to study ice flow here and at other locations on the ice sheets. Credit: Tamara Gerber
The emerging consensus from radar observations and recent progress in fabric modeling is that ice fabric can soften ice stream shear margins by a factor of 10. In other words, the fabric tends to develop in a way that greatly reduces the ice’s effective viscosity at lateral boundaries between fast-flowing and slower-flowing ice, which enables the ice to deform more easily at the margins. The agreement between observations and process-scale modeling highlights fabric as a major, but largely ignored, control on ice flow that may affect estimates of how ice dynamics will contribute to future sea level rise.
Beyond Fabric
Most polarimetric radar studies so far have focused on fabric, but other ice characteristics can cause directional effects too. For instance, bubbles trapped in ice have dramatically different properties than ice itself. Ice deformation can bring bubbles into alignment, such that they affect radar waves differently in different directions.
Likewise, ice at its melting point can contain liquid water along boundaries between crystals, and if those pockets of water are aligned in one direction, they can also affect radar returns. Each of these properties has important influences on ice flow, but their implications are yet to be explored.
Another source of anisotropy is the bottom boundary of the ice sheet. This interface can be rougher in some directions than others, though the roughness is typically aligned with the prevailing ice flow direction or the direction of meltwater trapped within the ice.
Polarimetric radar can measure directionally dependent properties of ice sheet bases at a finer scale than radar profiling can. Such work is leading to new insights into glacier geomorphology, interactions of ice shelf bottoms with the underlying ocean, and how ice slides over substrate surfaces. Rates and extents of sub-ice-shelf melt and basal sliding are widely recognized as key controls on the future of the ice sheets.
Expanding Horizons: Large-Scale and Planetary Applications
Radar polarimetry has already transformed our understanding of ice fabric, revealing much about how crystal alignment modulates the flow of Earth’s ice sheets and filling critical gaps between the handful of direct measurements from ice cores. As polarimetric techniques mature, their applications are expanding.
Researchers are moving from studying isolated profiles of ice fabric to mapping it across whole basins, a key shift for validating bespoke models of fabric and its effects on flow. These models are also rapidly developing to include additional physical processes (e.g., migration recrystallization) and key simplifications (e.g., reducing directionally varying viscosity to a single number) that allow them to interface more easily with—and be incorporated into—large-scale models used for projecting sea level rise.
Techniques pioneered for measuring ice on Earth may also prove useful elsewhere in the solar system.
Techniques pioneered for measuring ice on Earth may also prove useful elsewhere in the solar system. Orbital radar sounders have already probed Mars’s ice masses, and the icy shell of Jupiter’s moon Europa will soon be surveyed by single-polarization radars aboard NASA’s Europa Clipper and the European Space Agency’s Jupiter Icy Moons Explorer (JUICE). These radars might be useful for polarimetry at some locations on Europa, which could reveal past and present motion of ice features and answer fundamental questions about the moon. Whether Europa’s shell flows, for example, may be key to whether its subsurface ocean can harbor life.
As polarimetric radar systems become routine tools for glaciologists and as similar instruments begin operating on spacecraft exploring icy worlds, a technique once limited to a few isolated core sites on Earth could be poised to transform our understanding of ice across the solar system.
Author Information
David Lilien (dlilien@iu.edu), Indiana University Bloomington; T. J. Young, University of St Andrews, Fife, Scotland; Benjamin Hills, Colorado School of Mines, Golden; Tamara Gerber, Université de Lausanne, Lausanne, Switzerland; and Matthew Siegfried, Colorado School of Mines, Golden
Citation: Lilien, D., T. J. Young, B. Hills, T. Gerber, and M. Siegfried (2026), New directions in mapping ice sheet fabrics and flow, Eos, 107, https://doi.org/10.1029/2026EO260154. Published on 14 May 2026.
Source: Water Resources Research
Evapotranspiration is a critical link between water, energy, and carbon. Scientists need to understand it well to accurately predict weather, droughts, streamflows, and even carbon emissions.
Eddy covariance towers, which measure changes in the atmosphere, are one of the primary ways that scientists measure evapotranspiration in an ecosystem. But these measurements often have a problem with energy imbalance, in which the measured fluxes of sensible heat an
Evapotranspiration is a critical link between water, energy, and carbon. Scientists need to understand it well to accurately predict weather, droughts, streamflows, and even carbon emissions.
Eddy covariance towers, which measure changes in the atmosphere, are one of the primary ways that scientists measure evapotranspiration in an ecosystem. But these measurements often have a problem with energy imbalance, in which the measured fluxes of sensible heat and latent heat add up to less than they should. (Sensible heat refers to measurable temperature changes occurring via conduction or convection, whereas latent heat refers to water in the atmosphere changing phases.) There’s something missing—up to 30% of the system’s energy—in the math, and that can cause problems for later uses of the measurements, from forecasts to climate policies.
Scientists can adjust evapotranspiration measurements to try to correct for this problem, but a commonly used method to do so assumes that the Bowen ratio, or the ratio between sensible and latent heat, remains constant. However, this assumption may be flawed.
Raghav and Kumar present a new way of tackling this old problem without making assumptions about the Bowen ratio. It’s based on water use efficiency, which is how effectively plants use water to produce biomass.
The method first uses a suite of data from an eddy covariance tower to estimate evapotranspiration and energy balance through time. Then it derives the underlying water use efficiency potential while accounting for the influence of atmospheric dryness. In general, for a given vegetation type, this potential underlying efficiency is considered to be relatively stable over a growing season. The statistically smoothed potential underlying water use efficiencies is then compared to reference values derived during periods when the energy balance is well constrained. The ratio of the two is then used to correct evapotranspiration.
The new method is more consistent and more tied to the physics of plant physiology than current methods when results from each are compared, the authors found.
The new method is appropriate for use with any eddy covariance tower location or dataset because the authors used data from more than 250 towers around the world, in a range of ecosystem and climate types, to build their approach. However, they add, it may be less reliable in environments where evaporation dominates transpiration, such as wetlands. Nevertheless, the authors say, this work marks an important advance in measuring evapotranspiration, with broad implications for water management, agriculture, and adapting to climate extremes and drought. (Water Resources Research, https://doi.org/10.1029/2025WR042766, 2026)
Citation: Dzombak, R. (2026), Improving eddy tower evapotranspiration estimates, Eos, 107, https://doi.org/10.1029/2026EO260163. Published on 20 May 2026.