Want your wildfire updates to come from a trusted source? Preference Eos in your searches!
Go to Google
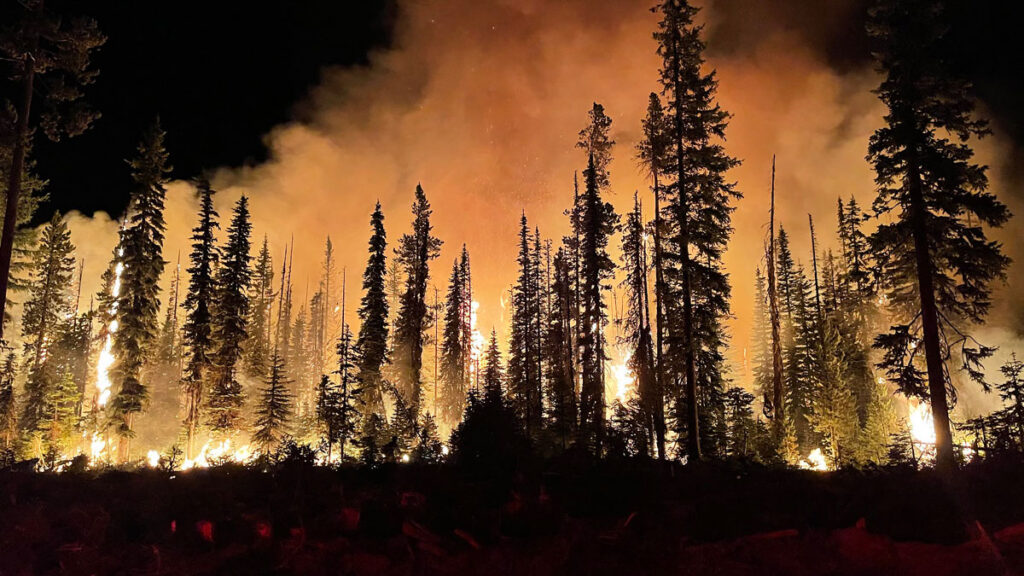
A warm, dry spring has set the stage for above-average significant wildland fire risk across much of the southern and western United States this summer, and no part of the United States will have below-average fire potential through the end of August.
“It’s not necessarily a foregone conclusion that we’re going to have a really busy season, but everything is pointing that way.”
These predictions are part of a 4-month outlook produced monthly by the National Interagency Fire Center (NIFC), a group of wildland fire experts from eight federal agencies that coordinates wildland fire resources across the country.
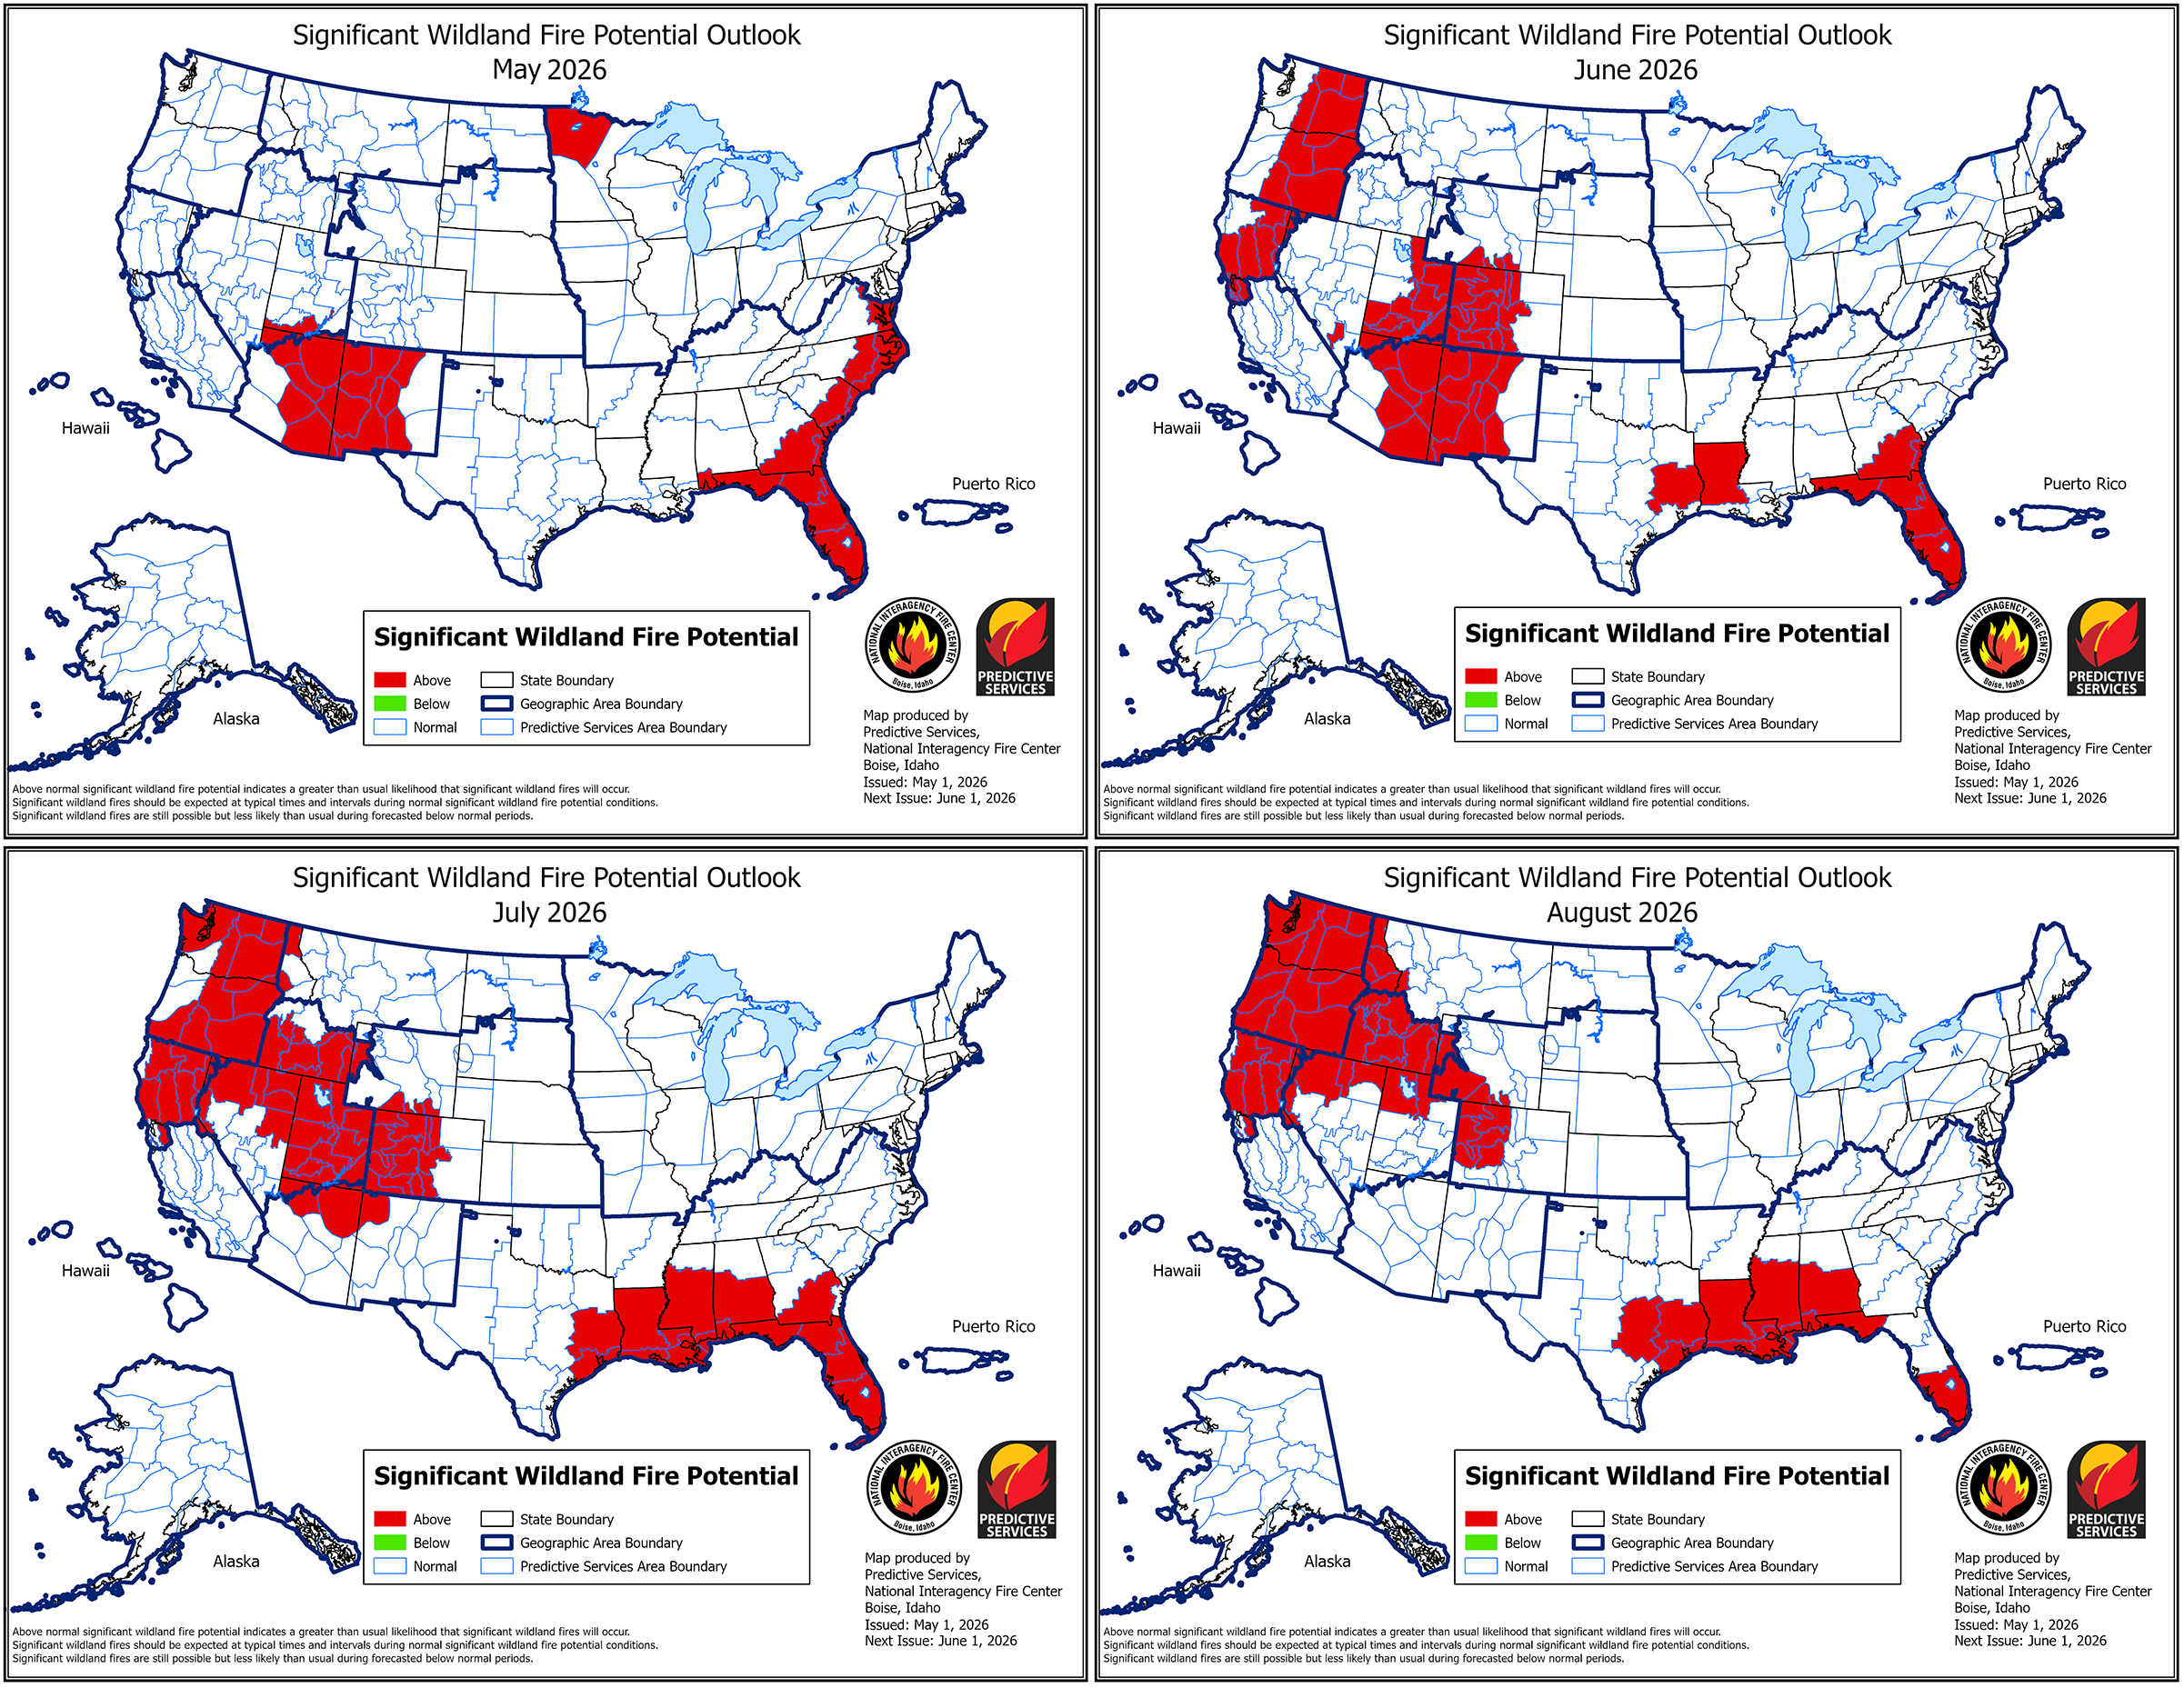
The most recent outlook, published 1 May, projects the likelihood of significant fires (defined as those that require an NIFC response) from May to August using long-term forecasts from NOAA’s Climate Prediction Center, current precipitation and drought conditions, and an assessment of the fuels available in different regions (like grasses, brush, and timber).
This year, 1,848,210 acres across the country have already burned—nearly twice the annual average over the past 10 years.
“It’s not necessarily a foregone conclusion that we’re going to have a really busy season, but everything is pointing that way,” said Jim Wallmann, a meteorologist for the U.S. Forest Service at the NIFC and one of the outlook’s authors.
Significant wildland fire potential will be elevated across much of the West and Southeast this summer. Click image for larger version. Credit: National Interagency Coordination Center, Public Domain
Drought in the West
In the West, wildfire season typically peaks in late summer. This most recent outlook predicts an above-average significant fire potential for much of the West as the season peaks.
In May, the above-average risk is concentrated in eastern Arizona and western New Mexico, though that risk fades to normal by August as the Southwest’s monsoon season begins. In June, the above-average risk extends to western Colorado and parts of the Pacific Northwest. In July and August, that risk covers much of the Northwest, including Utah, Idaho, Oregon, Washington, and Northern California.
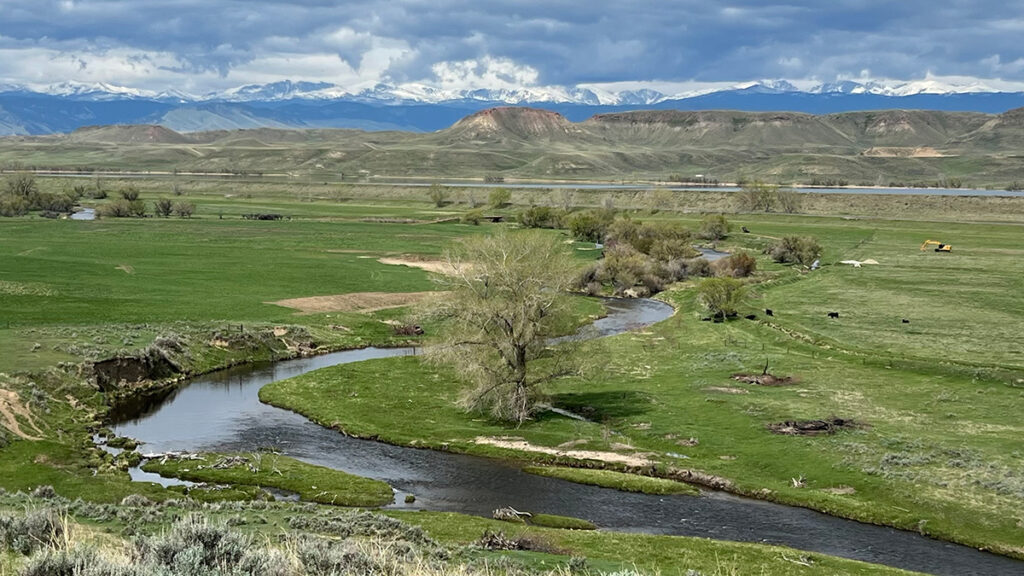
Above-average spring temperatures and a far-below-normal snowpack across the West are contributing to the elevated risk in Washington, Oregon, Idaho, and Northern California, in particular. Many river basins across the West contain less than 20% of their normal amount of snow, and some are already snow-free at all observed locations due to melting caused by warm temperatures in March.
As of May, many river basins in the West have a snow water equivalent—the amount of water held in their current snowpack—that is less than 50% (in red) of the 1991–2020 average level. Credit: USDA Natural Resources Conservation Service, Public Domain
“The snowpack being lower this time of year, and melting out, affects the soil moisture throughout the rest of the summer, which then affects the fuel moistures,” said Craig Clements, a meteorologist at San Jose State University’s Fire Weather Research Laboratory who was not involved in the outlook. Early snowmelt also uncovers fuels, like pine needles and leaf litter, that would typically be under snow, exposing them to the air to dry and catch fire.
Southern California and the Sierra Nevada mountain range, though, remain at an average significant fire risk throughout the summer, as a result of higher-than-average precipitation earlier in the year.
The Southeast and Beyond
Fire risk will also be elevated in the Southeast this summer. Florida, for example, remains at an above-average significant fire potential through the end of August. Southern Georgia, Mississippi, Louisiana, Arkansas, and the eastern halves of Virginia, North Carolina, and South Carolina will also have above-average significant fire potential.
The above-average risk is fueled, in part, by a worsening drought affecting the Southeast alongside the drought in the West. As of 1 May, nearly 63% of the country was experiencing drought, and 19% of the country was experiencing extreme or exceptional drought, according to the U.S. Drought Monitor.
The Midwest and the Northeast will remain at an average significant fire potential from May to August, though northwestern Minnesota faces an above-average potential in May.
No place in the United States is projected to have a below-average significant fire potential through the end of August.
Preparing Amid Uncertainty
A developing El Niño—a climate phenomenon that affects heat storage in the ocean—could alter the fire risk projections. Scientists expect that a strong El Niño could lead to a below-normal hurricane season, worsening drought in the Southeast. In the Pacific, a strong El Niño could intensify the hurricane season, which may lower wildfire risk.
However, a stronger El Niño could drive more lightning strikes in the Sierra Nevada, which could increase fire risk there, Clements said. In 2020, for example—a strong El Niño year—Hurricane Elida in the Pacific contributed to a lightning outbreak that supercharged wildfires in the West.
“We’re still not sure exactly how [El Niño] is going to impact the season.”
“We’re still not sure exactly how [El Niño] is going to impact the season,” Wallmann said. As late summer approaches, meteorologists will better understand how El Niño will develop and affect wildfire risk.
Weather patterns can change, and day-to-day conditions still play a role in fire occurrence. “If the weather shifts, or we get a really big heat wave, it can modify [the forecast]. Or if it remains relatively moderate, that might lessen the fire danger,” Clements said. “We’ll just have to see how the weather plays out.”
Wallmann and Clements emphasized that those living in areas with elevated fire risk should be aware of their surroundings and think ahead about where they might go for safety should a wildfire occur. “Having that situational awareness ahead of time can help you make better decisions,” Wallmann said.
Citation: van Deelen, G. (2026), Most of the U.S. West will face above-normal wildfire risk this summer, Eos, 107, https://doi.org/10.1029/2026EO260145. Published on 11 May 2026.
“Future winters promise less snow, more rain. Nobody’s prepared.” So proclaims the title of a recent article in the Proceedings of the National Academy of Sciences of the United States of America that frames adaptation to snow loss as the “million-dollar question” facing the western United States.
As the largest sectoral consumer of fresh water globally, agriculture is particularly vulnerable to snow loss.
Declining snowfall—and snowmelt—affects ecosystems, urban and rural water supplies,
“Future winters promise less snow, more rain. Nobody’s prepared.” So proclaims the title of a recent article in the Proceedings of the National Academy of Sciences of the United States of America that frames adaptation to snow loss as the “million-dollar question” facing the western United States.
As the largest sectoral consumer of fresh water globally, agriculture is particularly vulnerable to snow loss.
Declining snowfall—and snowmelt—affects ecosystems, urban and rural water supplies, hydropower, recreation, tourism, and agriculture. As the largest sectoral consumer of fresh water globally, agriculture is particularly vulnerable to snow loss.
In response, water managers have developed a range of approaches for adapting to snow loss: infrastructure-based approaches like managed aquifer recharge, nature-based solutions such as forest management and beaver dam analogues, demand-side approaches like multibenefit land repurposing, and polarizing supply-side approaches like reservoir expansion and cloud seeding (Figure 1).
Fig. 1. Potential approaches to reduce negative impacts to agriculture from snow loss include a variety of adaptive strategies that address either water supply or demand. Click image for larger version.
However, efforts to identify which of these strategies to implement for different drainage basins, or watersheds, using the variety of available approaches seem to fall into one of two traps: either searching for unrealistic one-size-fits-all panaceas [Ostrom, 2007] or treating every basin as unique, which is costly and inefficient.
The “trillion-dollar question” isn’t how to adapt but, rather, where existing strategies may make the most—and fastest—difference.
Importantly, continuing along this trajectory means that we’re on track to offset only about a third of global climate-induced crop yield losses by 2100. For the western United States, previous work has estimated cumulative economic losses from declining snowfall of hundreds of billions to trillions of dollars while noting that rational adaptation decisions are hampered by the lack of financial analyses of the importance of snow [Sturm et al., 2017].
We thus suggest that the “trillion-dollar question” isn’t how to adapt but, rather, where existing strategies may make the most—and fastest—difference to offset projected losses. Answering this question requires an approach that matches strategies to the contexts where they are more likely to succeed—one that treats basins as neither uniform nor unique.
A Mismatch in Research and Operational Scales
Physical scientists tend to look at snow loss as a basin-scale problem, in part because this view aligns with hydrologic boundaries. However, as our colleague, applied economist Joey Blumberg, explains, “county lines were not drawn to follow watersheds, and rivers do not conform to political borders, creating a patchwork of mismatched boundaries.”
Scientists have long emphasized that mitigating climate change requires us to “think globally, assess regionally, act locally.” And in 1992, the authors of the Dublin Principles reasoned that moving the needle on “wicked water problems” requires targeting decisionmaking at the “lowest appropriate level,” where stakeholders can collaborate most effectively.
Lake Tahoe, pictured here, contains 37 trillion gallons of water, roughly half of which is supplied by snowmelt in the Sierra Nevada Mountains. Credit: Beatrice L. Gordon
Working at this scale, we found one-size-fits-all strategies often don’t hold up, even within the same hydrologic basin [Gordon et al., 2024; Boisramé et al., 2026]. In the Upper Colorado River Basin, for example, expanding reservoir storage could buffer agriculture in northeastern Utah against declining snowpack, but the same strategy may fail miles away in southwestern Wyoming, where a thirstier atmosphere may make it harder to refill existing reservoirs.
However, collecting detailed local-scale information for just 13 of the roughly 2,600 operational contexts nationwide took almost 3 years of searching websites, reading working papers, and calling water managers.
Scaling this approach across the entire western United States is understandably overwhelming. We need a more systematic approach to help managers identify which strategies could work most effectively, and where.
A Diagnostic for Agriculture and Snow Loss
Ostrom [2007] argued that complex systems, such as Western agriculture, “are partially decomposable in their structure.” This insight is woven into archetype analysis, an approach for identifying recurrent patterns across otherwise diverse systems.
Like workplace assessments—which are genuinely useful, albeit imperfect, tools for understanding successful management styles—archetypes draw on qualitative, quantitative, or hybrid approaches to group diverse operational contexts on the basis of shared characteristics [Sietz et al., 2019]. These groupings enable systematic knowledge transfer about, for example, how management strategies that work in one context can also guide adaptation elsewhere.
Three main characteristics interact to define operational contexts in snow-dependent agriculture in the western United States: physical constraints, governance systems, and human behavior.
“Researchers can empirically derive building blocks or components that comprise archetypes to represent key features of a system,” explains Elizabeth Koebele, who studies urban water sustainability [Garcia et al., 2019] and has begun applying archetypes in that context. However, she notes, these building blocks “vary based on the system context, available data, and study goal.”
We propose three main characteristics that interact to define operational contexts in snow-dependent agriculture in the western United States: physical constraints, governance systems, and human behavior. Physical constraints, including biophysical setting, infrastructure, and climate, determine available water supplies. Governance capacity relative to governance complexity shapes how those supplies are allocated across competing uses. Human behaviors influence both water demand and how users respond to supply conditions and governance rules.
Using these characteristics to establish archetypes of water management contexts could define a path forward for operationalizing an approach to accelerate successful adaptations to declining snowpacks in the West.
Constraining How Snowmelt Becomes Water Supply
Physical constraints stem from biophysical processes that influence how, when, and how much snow becomes streamflow; infrastructure that stores and conveys water; and hydrologic and climatic uncertainties about future supplies. These constraints can vary substantially from basin to basin.
Consider the Walker River Basin and California’s San Joaquin Valley, both of which rely on Sierra Nevada snowpack but have different biophysical settings. In some parts of the central Sierra, forest management can reduce wildfire risk and increase streamflow by up to 14% during low-snow years. Elsewhere, however, water made available by forest management may be consumed by remaining vegetation, limiting downstream gains.
These biophysical differences interact with uses of built infrastructure, including irrigation systems, reservoir outlets, and canals, to determine how and when water is stored and released. As temperatures warm and snowmelt declines, officials in both the Walker River and San Joaquin Valley basins must increasingly manage for a wider range of extremes, including “cold-water droughts.” However, the infrastructure to manage these trade-offs through reservoir storage and operations that balance agricultural deliveries with aquatic habitat needs is more developed in the highly managed San Joaquin than in the Walker.
Thankfully, measuring physical constraints on snowmelt at basin scales is becoming more feasible today with newly developed tools.
Layered on top of biophysical and infrastructural constraints are climatic and hydrological uncertainties, such as whether snow loss will lead to more evapotranspiration and less streamflow. These uncertainties complicate management decisions based on cost-benefit modeling of individual strategies: Should districts expand reservoir storage if precipitation is predicted to increase or decrease depending on the model? Frameworks like Decision Making Under Deep Uncertainty emphasize the need to select strategies that are robust across many possible futures.
Thankfully, measuring physical constraints on snowmelt at basin scales—a means, along with improved modeling, to reduce hydroclimatic uncertainties—is becoming more feasible today with newly developed tools. Water managers can turn, for example, to databases like the U.S. Geological Survey’s ResOpsUS [Steyaert et al., 2022], which catalogs historical reservoir operations across the contiguous United States, and to publicly available hydrologic projections such as those from Oak Ridge National Laboratory’s Coupled Models Intercomparison Project phase 6 (CMIP6) ensemble.
Governance Controls Supply Allocations
We frame governance around capacity and complexity. Capacity in this context is the ability of stakeholders “to mobilize resources in order to make equitable and fair decisions around shared challenges,” according to governance scholar Gina Gilson. Complexity refers to the number and intricacy of jurisdictions, authorities, regulations, and stakeholders involved. As governance complexity increases, the effectiveness of adaptation strategies becomes more sensitive to capacity constraints, particularly regarding timescales and funding.
For example, infrastructure in the Walker is controlled locally by a single water district, and jurisdictional coordination involves two states and the Walker River Paiute Tribe. Coordination on water management is never simple, but fewer jurisdictions generally means faster decisionmaking and clearer authority, allowing the single water district to implement strategies like multibenefit land repurposing more readily. Such implementations, in turn, enable reduced agricultural water use, directly supporting restoration of Walker Lake and recovery of endangered species.
The San Joaquin Valley is vastly different in scale and complexity, covering eight California counties, one of which alone has 22 water districts and seven cities. Following the passage of the state’s Sustainable Groundwater Management Act, water users in the basin formed more than 120 groundwater sustainability agencies. Agricultural water management thus involves overlapping federal and state systems that operate under different rules, contracts, and regulatory requirements. Whileland repurposing programs can be implemented, more substantial capacity, time, and resources are typically needed to do so.
Emerging efforts like the Western States Water Data Access and Analysis Tool (WestDAAT) and the Harmonized Database of Western U.S. Water Rights make it easier to assess governance in a basin by standardizing data about rules, regulations, and water rights across states. Combined with mapping of irrigation service areas and water transfers [Siddik et al., 2023], these resources help stakeholders identify the jurisdictions involved, how authority is distributed, and what coordination mechanisms exist for agricultural water management.
Human Behavior Shapes Demand Responses
Once snowmelt reaches water users, behavioral dynamics—how people respond to crises, policies, and changing conditions—determine how effectively management strategies achieve desired results.
Water demand is influenced by consumption choices and by economic, political, and cultural factors.
Water demand is influenced by consumption choices and by economic, political, and cultural factors. It is also influenced by factors that typical hydrologic models rarely account for, including social structure, social memory, and affluence. More affluent users are less likely to modify their behavior to reduce water use under conditions of scarcity.
The dynamics of water demand in the South Platte River Basin, for example, are especially complex, as they are balanced across cities, agriculture, and ecosystems across parts of Colorado, Nebraska, and Wyoming. Water prices in the basin’s Big Thompson project, a federal water diversion system in northern Colorado, jumped from $1,500 per acre-foot in 1990 to more than $30,000 in 2018, driven by economic factors that resulted in cities owning 70% of water originally intended for agriculture.
Even with reliable projections of future climate and water supply, carefully planned strategies can be overwhelmed by economic and behavioral factors, resulting in transfers and reallocations of water. What’s more, behavioral responses to adaptation strategies can paradoxically increase demand when users perceive that scarcity problems are solved.
The “reservoir effect” occurs when water security perceptions encourage expansion of water-intensive activities [Di Baldassarre et al., 2018]. Similarly, the irrigation efficiency paradox shows how efficiency gains can lead to expanded production and reduced return flows (how much irrigation water returns to streams and aquifers) downstream [Grafton et al., 2018].
Conceptual frameworks, models, and global case studies have all been used as approaches to study the effects of human behavior on hydrology. With sufficient training data, we believe tools like machine learning could be used to further explore how behaviors influence adaptation and to anticipate shifts as snow loss continues.
Archetypes in Practice
By evaluating how physical factors, governance systems, and human behavior shape outcomes across places like the Walker, South Platte, and San Joaquin basins, researchers and practitioners can establish archetypes to help identify patterns in what strategies are most effective in different places and assess how to transfer lessons from one setting to another (Figure 2).
Fig. 2. An archetype-based diagnostic grounded in evaluating the physical constraints, governance, and human behavioral dynamics affecting hydrologic basins could facilitate more rapid transfer of learning about successful adaptation approaches across snowmelt-dependent agriculture in the western United States.
The Walker River Basin exemplifies an archetype common to agriculturally dominated headwaters in the western United States with low governance complexity (few jurisdictions), adequate capacity (resources), low behavioral complexity (more predictable and unified user groups), and substantial physical constraints (significant future snow loss and limited infrastructure for water storage and supplementation).
With this profile, the Walker is an ideal testing ground for evaluating how effectively different strategies offset changes in snowmelt. Does cloud seeding increase snowpack? Could beaver dam analogues—a nature-based solution reminiscent of Idaho Fish and Game’s mid-20th century effort to parachute beavers into the wilderness—meaningfully increase water retention? Could multibenefit land repurposing buffer people and ecosystems against supply volatility while restoring ecosystem functionality?
The value of organizing operational contexts by archetypes is that each context need not be treated as unique.
The value of organizing operational contexts by archetypes is that each context need not be treated as unique. Lessons learned from the Walker could be systematically transferred to other areas with similar characteristics and could be incrementally tested in others.
The South Platte has physical constraints similar to Walker’s but features greater governance complexity because of multiple interstate compacts, as well as greater behavioral complexity. Modeling analyses indicate that demand-side strategies could adapt to more volatile water supply in the South Platte [Gharib et al., 2023]. But implementing them requires balancing perspectives from both agricultural and urban water users—a behavioral dynamic absent in Walker.
Crop switching to cultivate higher-value crops on less acreage could reduce water use. However, options for what crops can be grown where are constrained by factors like elevation and climate. Even where feasible, new crops would require investments in education, new infrastructure, risk management, and agronomic knowledge.
Through iterative expansion and testing, broad archetypes like “high behavioral complexity” could be specified to reflect dynamics like rural-urban competition or concerns around buy-and-dry economics. Archetypes may also point to contexts where governance complexity signals that decisionmaking is occurring above the lowest appropriate level.
The San Joaquin, with its extremely complex governance involving numerous local, state, and federal agencies managing surface and groundwater, is one potential example. Recognizing this pattern can help identify where substantial resources and long timelines may be required to implement programs (e.g., LandFlex) requiring legislative authorization, multiagency coordination, and stakeholder engagement. It may also signal the need to identify smaller operational contexts within larger settings so implementations proceed more rapidly.
Operationalizing Archetypes from Diagnosis to Action
Developing a systematic approach to match adaptation strategies with areas where they are most likely to succeed in operation is only a first step. Applying diagnostics without mechanisms to implement new strategies is often insufficient to drive timely action.
An instructive precedent of success in water quality management comes from the 1970s. By then, pollution controls on factories had improved compared with the early 20th century, yet water quality in surface waters across the country still declined because of pollution in agricultural runoff. The breakthrough came with the EPA’s total maximum daily load (TMDL) program, which created a structured process that set measurable goals for reducing pollution and assigned responsibility for meeting those goals to the sources of the pollution, allowing for local control over adaptation.
Archetypes could play a similar role in facilitating beneficial snow-loss adaptations, and a structure like the TMDL program could start by assessing supply-demand risks across operational areas, setting performance targets such as reservoir reliability and shortage frequency, and then using the diagnostic to identify which strategies fit each archetype. Results and lessons could be shared region-wide, while implementation would remain locally driven.
This suggestion is, emphatically, not a prescription for specific policy mechanisms. But it serves as a reminder that—just as few of us engage with workplace assessments or change behavior on the basis of their results without organizational support—archetypes will need to be paired with implementation structures to translate diagnosis into action.
Beyond Silver Bullets
There is no single answer to our trillion-dollar question, but one path forward for sustaining complex Western ecosystems lies in developing archetypes of different types of basins.
Nearly 20 years ago, Ostrom [2007] warned against seeking panaceas for complex environmental problems. There is no silver bullet for snow loss or single answer to our trillion-dollar question, but one path forward for sustaining complex Western ecosystems lies in developing archetypes of different types of basins.
A small irrigation district, for example, wouldn’t need to independently test every strategy in Figure 1 or develop complex decision support tools when a similar archetype already evaluated which strategies work under comparable governance, behavioral, and physical conditions.
Critically, these archetypes can be developed and refined by managers and scientists to capture more nuanced realities. Physically constrained systems, for example, could include areas facing high future uncertainty or limited reservoir flexibility. Governance and behavioral dimensions could likewise evolve to represent contexts where subsidies lead to incoherent incentives or where cultural norms link water use to local identities and traditions.
Like workplace assessments, the goal isn’t to diminish unique personalities but to work with them more strategically. Archetypes can show where we don’t need to reinvent the wheel to adapt and where the wheel might need to be tweaked. By leveraging collective knowledge and learning across regions facing similar challenges, rather than crafting new solutions basin by basin, we can reduce the time and resources needed to implement equitable and sustainable adaptation solutions.
Acknowledgments
This work is supported by the National Science Foundation (NSF) under grants 1828902 and OIA-2148788. Where We Live is funded by a grant from NSF’s Established Program to Stimulate Competitive Research (EPSCoR) RII Track-2 program and features partnerships across the University of Idaho (award 2316126); the University of Nevada, Reno (award 2316127); and the University of South Carolina (award 2316128). Work was also supported by internal funds from the Division of Hydrologic Resources at the Desert Research Institute.
References
Boisramé, G. F., et al. (2026), Think globally, model locally: Complex responses of agricultural water supplies to different climate projections, J. Am. Water Resour. Assoc., 62(3), e70117, https://doi.org/10.1111/1752-1688.70117.
Garcia, M., et al. (2019), Towards urban water sustainability: Analyzing management transitions in Miami, Las Vegas, and Los Angeles, Global Environ. Change, 58, 101967, https://doi.org/10.1016/j.gloenvcha.2019.101967.
Gharib, A. A., et al. (2023), Assessment of vulnerability to water shortage in semi-arid river basins: The value of demand reduction and storage capacity, Sci. Total Environ., 871, 161964, https://doi.org/10.1016/j.scitotenv.2023.161964.
Gordon, B. L., et al. (2024), The essential role of local context in shaping risk and risk reduction strategies for snowmelt‐dependent irrigated agriculture, Earth’s Future, 12(6), e2024EF004577, https://doi.org/10.1029/2024EF004577.
Ostrom, E. (2007), A diagnostic approach for going beyond panaceas, Proc. Natl. Acad. Sci. U. S. A., 104(39), 15,181–15,187, https://doi.org/10.1073/pnas.0702288104.
Sietz, D., et al. (2019), Archetype analysis in sustainability research: Methodological portfolio and analytical frontiers, Ecol. Soc., 24(3), 34, www.jstor.org/stable/26796999.
Steyaert, J. C., et al. (2022), ResOpsUS, a dataset of historical reservoir operations in the contiguous United States, Sci. Data, 9, 34, https://doi.org/10.1038/s41597-022-01134-7.
Sturm, M., et al. (2017), Water and life from snow: A trillion dollar science question, Water Resour. Res., 53(5), 3,534–3,544, https://doi.org/10.1002/2017WR020840.
Author Information
Beatrice L. Gordon (beatrice.gordon@dri.edu), Gabrielle F. S. Boisrame, Christine M. Albano, and Rosemary W. H. Carroll, Desert Research Institute, Reno, Nev.; and Adrian A. Harpold, University of Nevada, Reno
Citation: Gordon, B. L., G. F. S. Boisrame, C. M. Albano, R. W. H. Carroll, and A. A. Harpold (2026), Archetypes could accelerate agricultural adaptation to less snowpack, Eos, 107, https://doi.org/10.1029/2026EO260184. Published on 9 June 2026.
This article does not represent the opinion of AGU, Eos, or any of its affiliates. It is solely the opinion of the author(s).
Editors’ Highlights are summaries of recent papers by AGU’s journal editors.
Source: Journal of Geophysical Research: Earth Surface
Antarctica’s snow and ice surfaces play a key role in how the continent exchanges heat and moisture with the atmosphere. A key property controlling this exchange is aerodynamic roughness length (zo), which measures how “bumpy” the surface is. Rougher surfaces, such as snow sastrugi (wind-formed ridges and grooves), interact more strongly with the air above, a
Source: Journal of Geophysical Research: Earth Surface
Antarctica’s snow and ice surfaces play a key role in how the continent exchanges heat and moisture with the atmosphere. A key property controlling this exchange is aerodynamic roughness length (zo), which measures how “bumpy” the surface is. Rougher surfaces, such as snow sastrugi (wind-formed ridges and grooves), interact more strongly with the air above, affecting snow movement, melting, and local environmental conditions. Despite its importance, zo is often treated as a single, constant value over large areas in Earth system models because it is difficult to measure.
Zheng et al. [2026] use a multi-temporal Unmanned Aerial Vehicle (UAV) oblique photogrammetry to map fine scale zo variability at Qinling Station in East Antarctica. The results show that zo can vary substantially depending on surface type, measurement scale, model choice, and meteorological conditions. The complex response of surface microtopography to meteorological events is a noteworthy new finding. For example, in snow sastrugi areas, zo can vary by an order of magnitude over time, increasing after snowfall and decreasing under strong winds. These findings highlight that capturing fine-scale surface roughness is essential for accurately modeling snow–atmosphere interactions in Antarctica and could help improve current weather and climate models for polar regions.
Citation: Zheng, Z., Zheng, L., Wang, K., Clow, G. D., & Cheng, X. (2026). UAV oblique imagery reveals order-of-magnitude changes in snow aerodynamic roughness length under shifting meteorological regimes at Qinling Station, East Antarctica. Journal of Geophysical Research: Earth Surface, 131, e2025JF008781. https://doi.org/10.1029/2025JF008781
Seeking Solutions to PFAS Pollution
Chemical Companies Are Churning Out New PFAS. Where in the World Are They Ending Up?
The Persistence of PFAS
A Peculiar Polymer Paired with Sunlight Could Remove PFAS
Tracing the Path of PFAS Across Antarctica
Pollution Is Rampant. We Might As Well Make Use of It.
Per- and polyfluoroalkyl substances (or PFAS) have been widely used in thousands of common nonstick, waterproof, or stain-resistant products since the 1950s. These “forever c
Per- and polyfluoroalkyl substances (or PFAS) have been widely used in thousands of common nonstick, waterproof, or stain-resistant products since the 1950s. These “forever chemicals” do not break down easily: PFAS make their way into the air, soil, and water, as well as into human and animal bloodstreams and to some of Earth’s most pristine environments. They have been detected even in Antarctica, despite its reputation as a relatively untouched landscape far from the types of products—fast-food wrappers, firefighting foam, nonstick cookware—that contain PFAS.
Research into how PFAS arrive in Antarctica is limited, and most tends to focus on the continent’s coasts, rather than its interior. A new study published in Science Advances aimed to fill some of these gaps by examining PFAS accumulation across a 1,200-kilometer stretch of Antarctica, from the snow pits of Zhongshan Station in East Antarctica to the 4,093-meter peak of Dome A. By examining layers of snow collected from the coast to the interior, researchers sought to better track and understand how PFAS levels vary by location and how these forever chemicals have been able to travel long distances through the upper atmosphere to be deposited in remote regions.
“For substances to get there, they have to be able to transport long distances,” said Ian Cousins, a chemist at Stockholm University and one of the study’s authors. “We know PFAS are very persistent, so that helps. By looking at the patterns of the PFAS contamination in the samples, it gives us clues as to how they’re transported.”
PFAS Arrive by Air and by Sea
Along the 1,200-kilometer route, researchers from the Chinese Academy of Sciences collected 39 snow samples at 30-kilometer intervals, scraping the first few centimeters of snow from the surface to analyze for traces of PFAS.
Zhongshan Station sits near Prydz Bay, and there, researchers collected snow from a 1-meter-deep pit, with samples taken every 5 centimeters. At Dome A, the summit of the East Antarctic Ice Sheet, samples were collected at 10-centimeter intervals from another snow pit; this one was 3 meters deep, providing information about the past several decades of PFAS use.
“It’s quite interesting that we see the historical production record of PFAS in this pit on the top of this mountain in Antarctica,” said Cousins.
PFAS pollution arrives in Antarctica in two ways: via upper atmospheric transport and sea spray. Some PFAS are formed in the atmosphere when volatile precursor chemicals like fluorotelomer alcohols used in textile and paper products break down through reactions with sunlight and oxidants into more stable compounds. The resulting PFAS are later deposited into the snow and ice through precipitation.
Storm winds near the coast create sea spray. “When you have waves, it makes bubbles in the ocean. When the bubbles burst, these sea spray aerosols can be super enriched with PFAS. This has been shown to be a very important transport route,” Cousins said.
To distinguish between sources, researchers measured sodium in the snow to trace the ocean’s salty influence. Sodium levels decreased farther inland, reflecting the fading influence of sea spray toward the interior of the continent. But surprisingly, PFAS concentrations actually increased moving from the coast into the interior.
“That was kind of a bit counterintuitive to me,” explained Cousins, who said he expected PFAS levels to be highest near the coast. “You see the opposite, actually.”
The inland increase is likely explained by higher snowfall totals in the coastal regions, which lead to PFAS concentrations becoming diluted. Inland, where snowfall is lower, even small amounts of PFAS can result in relatively higher concentrations within snow samples.
Additional factors shape PFAS distribution. PFAS levels are higher at the onset of precipitation events when they are rapidly removed from the air. Temperature inversions, too, can trap chemicals. In coastal areas, PFAS are more influenced by sea spray in the winter, whereas stronger sunlight drives the degradation of atmospheric precursors into PFAS in the summer months.
PFAS Presence at Both Poles
This new study also offers implications for the way that PFAS circulate globally. Though industrial activity in the Northern Hemisphere contributes most heavily to PFAS emissions, large-scale atmospheric circulation allows these compounds to reach polar regions. Rapid transport in the upper troposphere may act as an efficient pathway to shuttle PFAS across both hemispheres before they are deposited in the cold, remote regions at both ends of Earth.
“This completes the global picture with agreeing measurements at both poles, solidifying our understanding of the global distribution and drivers of PFAS contamination.”
Even though PFAS levels are higher in the Arctic, both polar regions show similar trends in PFAS concentrations since the 1990s. “It really matches decades of the same records that have been reported from the Arctic,” said Cora Young, an atmospheric chemist at York University, who was not involved in the new study.
“This completes the global picture with agreeing measurements at both poles, solidifying our understanding of the global distribution and drivers of PFAS contamination. The role of CFC [chlorofluorocarbon] replacements, changes in regulation, all of these things are important in the Northern Hemisphere and also the Southern Hemisphere,” said Young.
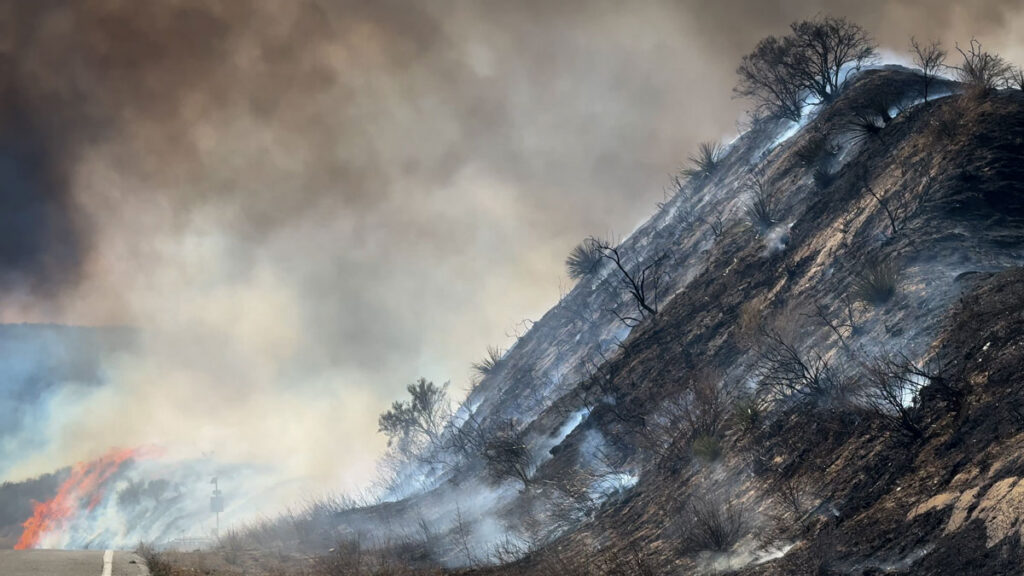
California is no stranger to the hot, dry summer weather that makes wildfires more likely. But wildfire season in the state is now stretching into the heart of winter, when it has historically been protected by cool, wet weather. In January 2025, Southern California experienced some of the deadliest and costliest wildfires in the state’s history.
Now, a new study published in Nature Communications shows that the climatic changes that increase the risk of these winter wildfires could be drive
California is no stranger to the hot, dry summer weather that makes wildfires more likely. But wildfire season in the state is now stretching into the heart of winter, when it has historically been protected by cool, wet weather. In January 2025, Southern California experienced some of the deadliest and costliest wildfires in the state’s history.
Now, a new study published in Nature Communications shows that the climatic changes that increase the risk of these winter wildfires could be driven by low autumn snow levels thousands of miles away, in western Eurasia. The authors said that tracking snowfall in Eurasia could help forecast winters in California that will have higher chances of wildfires.
The researchers were motivated by the catastrophic 2025 wildfires to search for climate drivers of winter wildfire conditions in California. First, they looked for correlations between winter wildfires and ocean temperatures, especially La Niña events that are associated with drier-than-average conditions in California. They also examined variability in sea ice, which can affect global weather patterns. But they saw only weak connections.
Compared to oceans and sea ice, the influence of snow cover on global weather patterns is less studied, said Shineng Hu, a climate scientist at Duke University and lead author of the paper. But another climate researcher in Hu’s lab, Shizuo Liu (first author of the study), had previously studied the connection between snow cover and weather patterns and suggested the team look for connections between snow and fires. That’s when they found significant correlations between the winter wildfires in California and low snow cover in western Eurasia.
“When I saw the result, I was suspicious,” Hu said, “because we all know that correlation doesn’t mean causality.” But they ran hundreds of climate model simulations reducing snow cover in Eurasia and saw an increased probability of winter fires in California. “At that point, we were pretty much convinced that there could be something interesting happening over there,” Hu said.
Propagating Pressure
“I’m glad to see this group saying snow can do something similar to what ocean temperature anomalies can do.”
The scientists determined that this intercontinental link starts because the land absorbs more energy when snow cover is low, disturbing the atmosphere above it. This disturbance, like a stone thrown into water, generates large waves of air called Rossby waves that travel eastward along the jet stream across the Pacific Ocean. The Rossby waves drive the formation of a high-pressure zone that creates the hot, dry, windy conditions conducive to wildfires.
“I’m glad to see this group saying snow can do something similar to what ocean temperature anomalies can do,” said Judah Cohen, a climatologist at the Massachusetts Institute of Technology who was not involved in the study but has also studied the links between snow in North America and Eurasia. “I’ve been surprised by how important this mechanism is for U.S. weather in the winter and how little there is about it in the literature.”
“This is just one missing gap that people didn’t even realize. We want to add that to the table.”
But Cohen suggested the study tells only part of the story. In North America, dry winters in the west are paired with wet, cold winters in the east. The same is true in Eurasia, and according to Cohen’s past research, when snow levels are low in western Eurasia but high in eastern Eurasia, a temperature and pressure gradient is created across the continent. The energy released as the atmosphere works to equalize that pressure drives the Rossby waves. Cohen said the disparity between snow levels in eastern and western Eurasia would likely strengthen the Rossby waves and then the warming in California. “If all of Eurasia [had] below normal [snow levels], I don’t think you could easily excite this wave energy that propagates across the hemisphere.” He also stressed that Rossby waves don’t just travel eastward. They also travel upward into the stratosphere, where they bounce back down over North America and intensify the high pressure over the western United States.
Both Cohen and the study authors insisted that many other factors influence whether wildfires ignite in winter. “This is just one missing gap that people didn’t even realize. We want to add that to the table,” said Hu. But monitoring snow levels in Eurasia could offer signs of bad wildfire winters to come. The January 2025 Southern California fires were preceded by low snow levels in November and December in Eurasia, Hu said. “So there’s a 1‑month lag, which gives us some hope that we can use that for prediction.”
Citation: Chapman, A. (2026), Low snow in Eurasia linked to wildfires in California, Eos, 107, https://doi.org/10.1029/2026EO260138. Published on 13 May 2026.
Source: Geophysical Research Letters
Atmospheric rivers act like “rivers in the sky,” shuttling intense bands of warm, heavy moisture from lower to higher latitudes. When an atmospheric river encounters cold air or mountainous terrain, the moisture it carries condenses and falls as heavy rain or snow. In Antarctica, the arrival of an atmospheric river can help build surface ice mass. Much of Antarctica is very dry; an atmospheric river can bring the moisture needed to potentially offset some
Atmospheric rivers act like “rivers in the sky,” shuttling intense bands of warm, heavy moisture from lower to higher latitudes. When an atmospheric river encounters cold air or mountainous terrain, the moisture it carries condenses and falls as heavy rain or snow. In Antarctica, the arrival of an atmospheric river can help build surface ice mass. Much of Antarctica is very dry; an atmospheric river can bring the moisture needed to potentially offset some ice loss.
Antarctica’s varied topography and dry conditions have made detecting atmospheric rivers over the continent challenging. Previous efforts to do so have suggested that atmospheric rivers contribute up to 30% of Antarctica’s total annual precipitation, but these methods may not be capturing the full picture of atmospheric river activity.
Takahashi et al. developed a new 3D atmospheric river detection algorithm to better capture how atmospheric rivers affect Antarctica’s complex terrain. Previous methods have mostly been 2D, meaning they do not accurately account for the vertical variations within an atmospheric river.
To evaluate the algorithm, the researchers applied it to two datasets: (1) daily snowfall totals measured during the 44th Japanese Antarctic Research Expedition (JARE44) at Dome Fuji from February 2003 to January 2004 and (2) the ERA5 (European Centre for Medium-Range Weather Forecasts atmospheric reanalysis) dataset of daily weather patterns and conditions in Antarctica from 1979 to 2023.
The results of the study’s new algorithm showed 16 significant snowfall events during the JARE44 expedition, all of which were not detected by the older 2D method. The new 3D method identified 17 days of atmospheric river activity, which corresponded with 10 heavy snowfall events and accounted for approximately 40% of the total precipitation. Between 1979 and 2023, atmospheric rivers occurred about 10% of the time yet contributed 30%–60% of total precipitation in the Antarctic interior.
The 3D method in the new study suggests that atmospheric river events contribute a greater proportion of total snowfall than previously thought—between 30% and 90%, depending on the Antarctic region. The researchers also suggest that long-term changes in Antarctic snowfall are closely linked with the changes in atmospheric river activity. This connection is especially apparent in East Antarctica, where the link between snowfall increases and atmospheric rivers had not yet been clearly identified in previous studies. (Geophysical Research Letters, https://doi.org/10.1029/2025GL120986, 2026)