Editors’ Vox is a blog from AGU’s Publications Department.
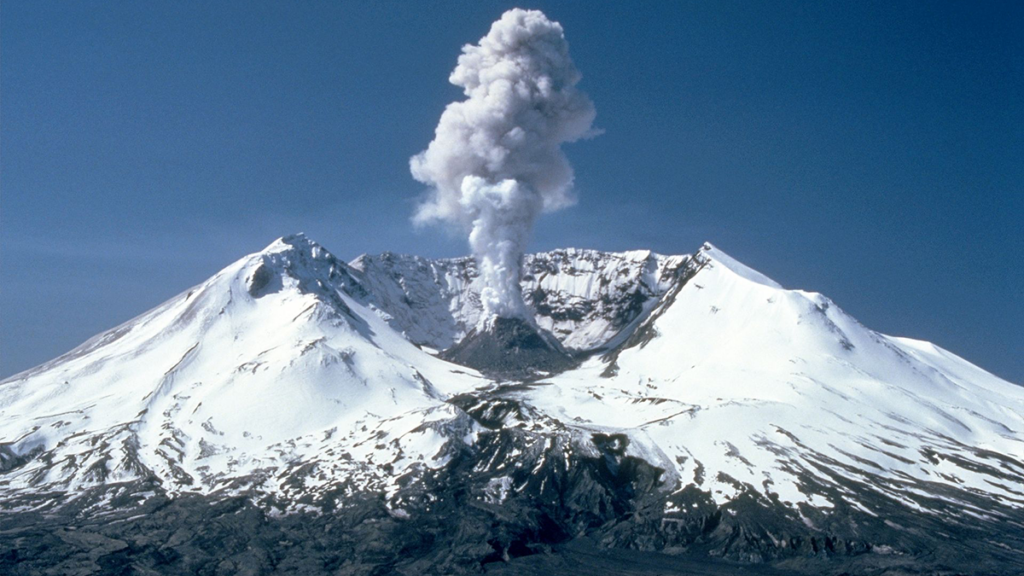
Explosive volcanic eruptions inject gases and ash into the atmosphere, posing major hazards for human health, infrastructure, and aviation. A new article in Reviews of Geophysics examines recent advances in estimating Eruption Source Parameters (ESPs), the key conditions at the volcanic vent that are a necessity for modeling the behavior of volcanic plumes. Here, we asked the authors to explain what ESPs are, what technologies are us
Explosive volcanic eruptions inject gases and ash into the atmosphere, posing major hazards for human health, infrastructure, and aviation. A new article in Reviews of Geophysics examines recent advances in estimating Eruption Source Parameters (ESPs), the key conditions at the volcanic vent that are a necessity for modeling the behavior of volcanic plumes. Here, we asked the authors to explain what ESPs are, what technologies are used to observe eruptions, and which scientific challenges and future research directions remain for improving volcanic plume monitoring and modeling.
In simple terms, what are Eruption Source Parameters?
Eruption Source Parameters (ESPs) describe the key conditions at the volcanic vent during an eruption.
Eruption Source Parameters (ESPs) describe the key conditions at the volcanic vent during an eruption, such as the mass eruption rate, exit velocity, temperature, and particle size distribution. These parameters define how material is injected into the atmosphere and are essential inputs for models that simulate plume rise and subsequent dispersal of volcanic gases and ash in the atmosphere. In simple terms, ESPs represent the boundary conditions that control the behavior of volcanic plumes. Because they cannot usually be measured during an eruption, they must be estimated from indirect observations and models, which introduces significant uncertainty.
Why is it important to understand how volcanic ash and gases disperse after an eruption?
Volcanic ash and gases can travel long distances and affect aviation safety, human health, infrastructure, and even climate. Fine ash particles are particularly hazardous for aircrafts, while ash fallout can disrupt communities and critical services on the ground. Gas emissions may also impact air quality and alter the atmospheric radiative budget. Understanding volcanic dispersion is therefore essential for forecasting the movement of volcanic clouds and issuing timely warnings. Reliable forecasts support risk mitigation strategies and enable more effective responses by civil protection agencies and aviation authorities.
What technologies are used to observe volcanic plumes?
Volcanic plumes are observed using a combination of satellite, ground-based, and, more rarely, airborne measurements. Satellite observations are crucial for tracking ash and gas clouds over large spatial scales and in near real time. Ground-based instruments, such as radar, cameras, and infrasound sensors, provide detailed information on plume dynamics close to the source. Increasingly, these observations are integrated with numerical models to infer eruption conditions. The combination of multiple data streams is essential for constraining ESPs and improving the reliability of plume simulations.
What are some of the recent advances in estimating Eruption Source Parameters?
Recent advances have focused on combining observations with numerical models to better constrain ESPs. Multi-sensor approaches, data inversion techniques, and improved plume models have significantly enhanced our ability to estimate eruption rates and plume dynamics. At the same time, high-resolution computational fluid dynamics (CFD) simulations provide deeper insights into the complex fluid dynamic processes governing plume behavior. However, these models are computationally expensive and unsuitable for real-time applications, highlighting the need for approaches that bridge the gap between physical realism and operational efficiency.
What strategies do you propose in your review to improve Eruption Source Parameters estimation?
A central contribution of this review is the proposal of a new class of operational models for volcanic plumes.
A central contribution of this review is the proposal of a new class of operational models for volcanic plumes. These models integrate the physical realism of high-fidelity CFD simulations with the efficiency of simplified models used in forecasting. In particular, the review highlights the potential of artificial intelligence and machine learning techniques to “learn” from CFD results and optimally calibrate the key variables controlling plume dynamics. This hybrid approach allows complex physical processes to be represented in a computationally efficient framework, making it suitable for real-time applications while retaining improved accuracy.
How does improved volcanic plume monitoring lead to more effective volcanic hazard assessment?
Improved monitoring leads to more accurate estimates of ESPs, which directly translate into better forecasts of plume rise and ash dispersion. This reduces uncertainty in hazard assessments and supports more reliable decision-making. For example, more accurate forecasts can help aviation authorities minimize disruptions while maintaining safety and enable civil protection agencies to issue targeted warnings. Ultimately, better integration of observations and models enhances the capacity to respond effectively during eruptions and to mitigate their societal and economic impacts.
What are the remaining questions or knowledge gaps where additional research is needed?
Further research is needed to improve the coupling between observations, physics-based models, and data-driven approaches.
Despite progress, significant challenges remain. ESPs are still difficult to constrain in real time, and uncertainties in both observations and models propagate into forecasts. The integration of diverse data sources is not yet fully optimized, and different estimation methods can yield inconsistent results. Further research is needed to improve the coupling between observations, physics-based models, and data-driven approaches. In particular, developing robust hybrid frameworks that combine CFD, simplified models, and machine learning represents a key direction for advancing both scientific understanding and operational forecasting.
Editor’s Note: It is the policy of AGU Publications to invite the authors of articles published in Reviews of Geophysics to write a summary for Eos Editors’ Vox.
Research & Developments is a blog for brief updates that provide context for the flurry of news regarding law and policy changes that impact science and scientists today.
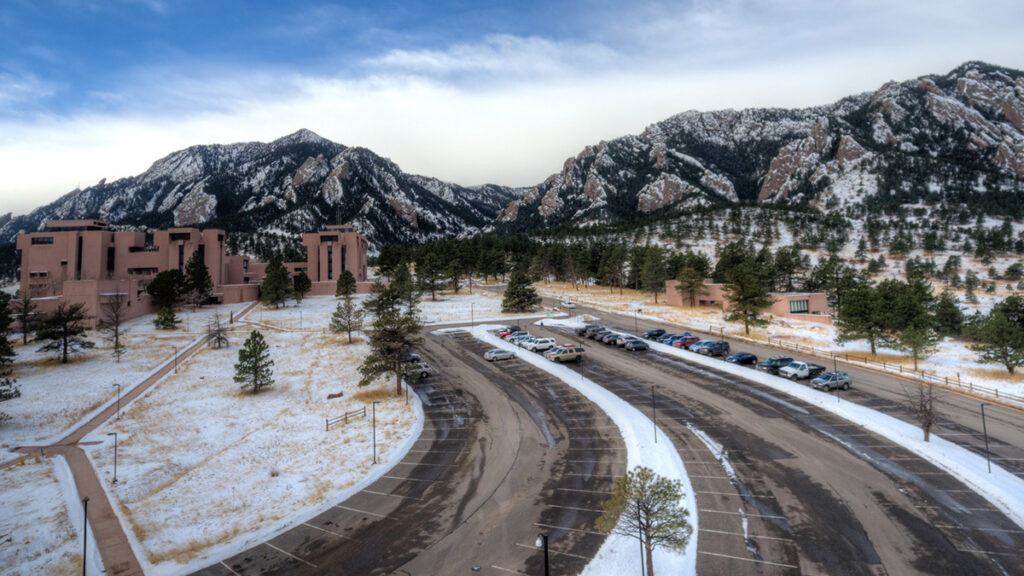
A Colorado judge has granted a preliminary injunction to the University Corporation for Atmospheric Research (UCAR). The move temporarily blocks the federal government from moving forward with one part of its effort to dismantle UCAR’s National Center for Atmospheric Research (NCAR) by transferring stewardship of a
Research & Developments is a blog for brief updates that provide context for the flurry of news regarding law and policy changes that impact science and scientists today.
A Colorado judge has granted a preliminary injunction to the University Corporation for Atmospheric Research (UCAR). The move temporarily blocks the federal government from moving forward with one part of its effort to dismantle UCAR’s National Center for Atmospheric Research (NCAR) by transferring stewardship of a state-of-the-art supercomputing facility.
Together, UCAR—a nonprofit consortium of universities and colleges—and the National Science Foundation (NSF) operate and maintain the NCAR-Wyoming Supercomputing Center (NWSC) in Cheyenne, Wyo. The facility provides scientists with enormous computational power necessary to run sophisticated analyses of weather, climate, and other Earth systems.
In February, as another step in a chain of actions taken to dismantle NCAR, the NSF informed UCAR and NCAR that it would transfer management and operations of NWSC to a third-party operator.
In turn, UCAR filed a lawsuitalleging that the action violated federal law under the Administrative Procedure Act (APA). To halt NSF’s action under the act, the agency’s attempt to remove UCAR’s stewardship of the facility must be shown to be “arbitrary, capricious, an abuse of discretion, or otherwise not in accordance with law.”
Judge Richard Brooke Jackson of the U.S. District Court for the District of Colorado wrote in a 1 June court order that the action was both arbitrary and capricious “for at least two reasons.” First, NSF didn’t offer an explanation for its decision, and second, it didn’t follow an outlined process to consider public feedback.
The decision means that UCAR will temporarily retain its stewardship of NWSC.
“NSF’s failure to provide any explanation for its decision—let alone a reasonable one—thwarts meaningful judicial review and renders the challenged action arbitrary and capricious,” Jackson wrote.
He went on to note that efforts to transfer stewardship of UCAR assets, including the supercomputing center, to other institutions, pose the risk of “irreparable harm” to UCAR. One of the chief harms would be brain drain, the judge noted multiple times, writing that “UCAR cannot easily replace employees with the level of education, specialized training, and institutional knowledge necessary to operate and maintain the NWSC’s ‘highly integrated, high-performance supercomputing system.'”
In addition to brain drain, Jackson cited financial injuries to UCAR that would be “difficult, if not impossible” to quantify, as well as an overall threat to the consortium’s mission.
“Any degradation in forecasting, modeling, or related scientific capabilities carries real-world consequences, including potential harm to property and human life. Given those stakes, the public interest strongly favors maintaining the status quo unless and until NSF demonstrates that its transfer decision complies with the APA,” he concluded.
In a statement posted to the UCAR website, the consortium’s interim president, Eric Barron, said UCAR was pleased that Judge Jackson recognized how harmful the proposed transfer would be for the the nation’s scientific enterprise.
“UCAR’s top priority is to advance Earth system science in service to society,” he wrote. “Today’s decision ensures that the NWSC will be able to continue its vital work on behalf of the United States and its stakeholders without interruption.”
These updates are made possible through information from the scientific community. Do you have a story about how changes in law or policy are affecting scientists or research? Send us a tip at eos@agu.org.
AI is wreaking havoc in the fashion industry. Brands are taking advantage of the technology to pump out low-cost images of their products in a seismic shift that is wiping out clothing catalog models while also reducing work for photographers.
[Read More]
AI is wreaking havoc in the fashion industry. Brands are taking advantage of the technology to pump out low-cost images of their products in a seismic shift that is wiping out clothing catalog models while also reducing work for photographers.
Source: AGU Advances
The Indian monsoon has shifted over the past quarter century. Northwest India now receives substantially more rain than it once did, while a lack of rain sends the Indo-Gangetic Plain toward drought.
More than a billion people rely on the monsoon to confer economic stability across southern Asia; further changes to this weather system could lead to widespread hardship. Scientists have struggled to predict how this weather pattern will change moving forward because com
The Indian monsoon has shifted over the past quarter century. Northwest India now receives substantially more rain than it once did, while a lack of rain sends the Indo-Gangetic Plain toward drought.
More than a billion people rely on the monsoon to confer economic stability across southern Asia; further changes to this weather system could lead to widespread hardship. Scientists have struggled to predict how this weather pattern will change moving forward because commonly used climate models fail to capture changes to the monsoon that have already occurred.
Mahendra et al. suggest that models do not adequately represent either changes in the temperature of the Atlantic Ocean or how those temperature changes are linked to weather patterns around the rest of the globe. As a result, the coupled models tend to fail to predict this monsoon shift.
Specifically, current climate models lack the ability to incorporate information about the cold blob, a patch of cold water off the south of Greenland. When the researchers added the cold blob to climate model results, they found that it can alter the jet stream in a way that makes it pull moisture toward northwest India while also preventing storm systems from forming elsewhere. This is exactly the type of shift that has been observed in monsoon patterns. When a large-scale wind pattern prevents the formation of smaller-scale weather patterns in this way, it is called a barotropic governor mechanism.
This barotropic governor mechanism also explains why midlatitudes around the globe have observed more storm activity in recent years. The results highlight the importance of connecting processes from disparate parts of the globe when formulating climate models, the authors write. (AGU Advances, https://doi.org/10.1029/2025AV002173, 2026)
Citation: Sidik, S. M. (2026), The surprising link between a cold blob and the Indian monsoon, Eos, 107, https://doi.org/10.1029/2026EO260177. Published on 1 June 2026.
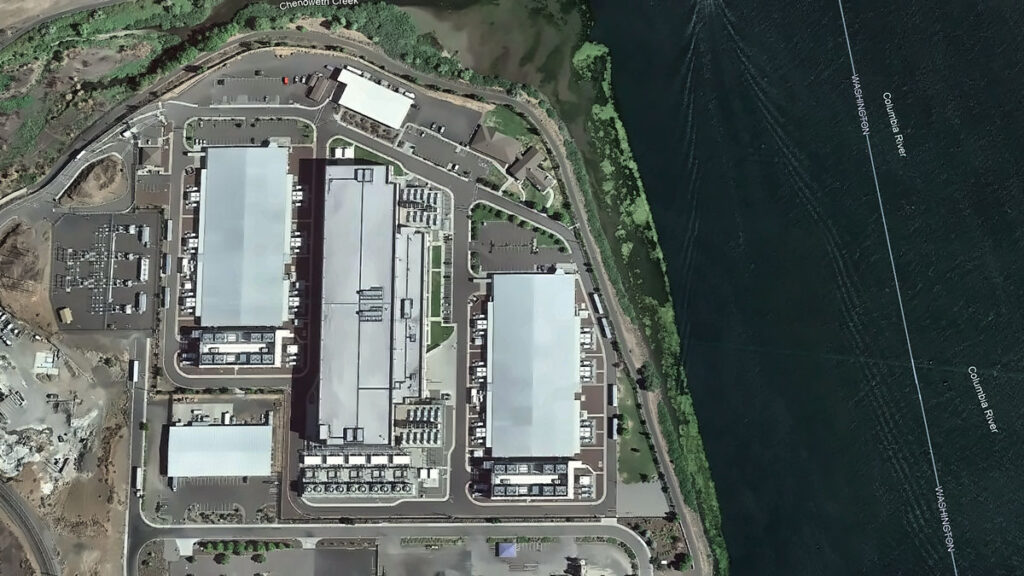
Every chip fabricated in a semiconductor plant needs ultrapure water. Most nuclear reactors need water as a coolant and neutron moderator. Every artificial intelligence (AI) data center drinks between 1 million and 5 million gallons of water a day, with thirst often peaking during drought.
Water runs through every technology priority the United States has named, yet the word does not appear once in “Launching the Genesis Mission,” an executive order (EO) released in November 2025. As describ
Every chip fabricated in a semiconductor plant needs ultrapure water. Most nuclear reactors need water as a coolant and neutron moderator. Every artificial intelligence (AI) data center drinks between 1 million and 5 million gallons of water a day, with thirst often peaking during drought.
Water runs through every technology priority the United States has named, yet the word does not appear once in “Launching the Genesis Mission,” an executive order (EO) released in November 2025. As described in the EO, the Genesis Mission is a “dedicated, coordinated national effort to unleash a new age of AI-accelerated innovation and discovery that can solve the most challenging problems of this century.”
Led by the Department of Energy (DOE), the initiative aims to build an integrated AI framework that would harness federal scientific datasets to accelerate breakthroughs in advanced manufacturing, biotechnology, critical materials, nuclear fission and fusion energy, quantum information science, and semiconductor development. The scope of the mission is comparable to that of the Manhattan Project.
Since the announcement, the DOE has listed “Predicting U.S. Water for Energy” among its 26 Genesis Mission Science and Technology Challenges. The project is also soliciting proposals in three water-related focus areas.
This framework provides a foothold for hydrology in the Genesis Mission, but it is scoped narrowly around water as a supply variable for energy production.
In reality, water is a crosscutting constraint that will help determine whether the mission’s priorities translate into deployable outcomes. The hydrology community now has a seat at the table, and if it moves first and positions water security as one of the “most challenging problems of this century,” the Genesis Mission can become the sandbox in which AI reshapes how the country measures, models, and manages water.
Making this happen will require that the DOE and the Office of Science and Technology Policy charter a hydrology workstream inside the Genesis Mission, with interagency delivery involving the U.S. Geological Survey (USGS), NOAA, the Bureau of Reclamation, the EPA, and partners at state, regional, and community levels. Here is what we think that workstream should look like:
A water-centric Genesis Mission architecture supports seven hydrological components that both feed into and receive decisions from the Genesis AI platform. Each component maps to a section of this article. Credit: Amobichukwu C. Amanambu. Click image for larger version.
While the existing challenges reflect some of these components, others will require coordinated effort from the hydrology community to bring into the Genesis Mission’s scope.
Build the Water Corpus Genesis Will Need
The Genesis Mission EO instructs the DOE to create an American Science and Security Platform to provide the public, scientists, agencies, and policymakers access to crucial scientific datasets.
The good news is that accessible water data systems already exist across several federal agencies and academic research centers. The USGS National Water Information System tracks real-time and historical water quality and use across the country. NASA’s Earth Science Data Systems Program provides open access to Earth science observations. NOAA’s National Water Center, the first federal facility dedicated to national water resource forecasting, operates the National Water Model, which continuously forecasts flows on 2.7 million stream reaches across the continental United States. The Catchment Attributes and Meteorology for Large-Sample Studies (CAMELS) dataset, currently hosted by the National Center for Atmospheric Research, provides data tailored for hydrological research on hundreds of river basins, and the Caravan framework pulls together multiple large-sample meteorological and hydrological datasets at a global scale.
What is missing is a unified, AI-ready repository that brings federal, state, and community data together.
What is missing is a unified, AI-ready repository that brings federal, state, and community data together. Building one is hard. Water data are fragmented, inconsistent, and often entirely absent. Consistent, reliable data for groundwater, withdrawals, reservoir operations, and water quality are especially difficult to obtain.
Local resistance to sharing data is real. In Texas, for example, landowners hold private property rights over groundwater and have opposed metering and reporting requirements imposed by groundwater conservation districts. In California, agricultural well owners fought metering mandates for years before the Sustainable Groundwater Management Act compelled local agencies to begin tracking withdrawals. Tribal nations face a different concern: Water data collected on Indigenous lands has been misrepresented in federal datasets that were modeled without accounting for Indian country, leading many nations to restrict access to their data as an exercise of sovereignty.
Practical steps toward building a unified AI-ready repository include tiered access and licensing for different stakeholders, clear provenance tracking for all data reported, financial and educational incentives for stakeholders for reporting, and targeted gap filling. Where measurements are missing, AI can fuse remote sensing with gauged records and operational logs—but only if the results carry honest uncertainty estimates tied to real decisions.
Get the corpus right, and it will outlive any single program name. It becomes infrastructure the country can lean on.
Develop Shared Hydrologic Foundation Models
The Genesis Mission EO directs the DOE to provide “domain-specific foundation models across the range of scientific domains covered.”
Hydrology has a head start. Long short-term memory (LSTM) networks are a key type of neural network designed to last thousands of time steps. Hydrology LSTMs trained on CAMELS data have already matched traditional conceptual models for daily streamflow discharge prediction. Open-source Neural Hydrology tools serve as baselines for regional runoff prediction. These predictions may serve as precursors to the foundation models the Genesis Mission envisions and building blocks from which they could be developed.
The process of scaling up these tools is not straightforward, however. A hydrologic investigation of snowmelt-driven streams in Colorado will not require the same spatiotemporal data as tile-drained fields in Iowa, for example. A hydrology-specific foundation model must take nuanced requirements into consideration and provide a clear path for managing and exploiting a variety of datasets.
Google’s Flood Hub shows what is possible: Its AI-enabled flood forecasts now cover more than 80 countries. However, Flood Hub’s core model code and trained weights remain proprietary, meaning researchers can use the forecasts but cannot rebuild or adapt the underlying models. Genesis, if well positioned, can fill that accessibility gap by producing foundation models for water that are reusable, reliable, and openly governed.
Build a National Water Digital Twin
The EO prescribes an integrated AI platform combining foundation models with simulation tools to stimulate AI-enabled innovations.
That architecture is exactly what a digital twin requires. Europe’s Destination Earth initiative is already building digital twins for weather extremes and nonstationary conditions on the Large Unified Modern Infrastructure (LUMI) supercomputer. The United Nations–led AI for Good initiative has prioritized water applications, warning that fragmented national efforts risk duplicating work.
If the United States aims for global strategic leadership in AI-accelerated science, water infrastructure cannot be an afterthought.
A water digital twin earns its keep when it makes the consequences of choices visible, in terms of flows, levels, temperatures, and risks to people and ecosystems.
Rather than starting from scratch, a water-centric Genesis Mission would unite existing federal models—the National Water Model, reservoir simulators, and groundwater codes—in a single digital twin. AI can become the thread that stitches them together, correcting biases and providing numerical solvers to enforce mass and energy balance.
What should this twin actually do? Help a dam operator decide whether to release water ahead of a storm. Tell planners where a new data center can draw cooling water without drying up a stream. Flag which coastal defenses will fail first under rising seas.
A water digital twin earns its keep when it makes the consequences of choices visible, in terms of flows, levels, temperatures, and risks to people and ecosystems.
Turn Basins into AI Test Beds
The Genesis Mission promotes AI-directed experimentation and directs the DOE to keep a record of robotic laboratories and production facilities in which such experimentation could be conducted. Hydrological field sites belong in that inventory. The National Ecological Observatory Network already operates 81 sites with standardized measurements of meteorology, surface water, groundwater, and biodiversity. The Critical Zone Collaborative Network instruments catchments to track water-soil-vegetation interactions over decades.
Formalizing these networks as AI test beds would link field observations back into the water digital twin so that experiments and models continually sharpen each other. Imagine mobile sensors steered by AI agents during a storm or aquifer recharge experiments designed by algorithms and verified in real time. That feedback loop is what separates a useful model from a decorative one.
Expand Water Challenges on the Genesis Mission List
The Exchange and What’s at Stake
Allowing water security to flow through the diverse components of the Genesis Mission would benefit both the policies championed by the mission itself and the hydrology community.
The Genesis Mission gets real-world, noisy test beds where AI proves value beyond benchmarks, a domain to stress test climate and infrastructure investments, and scientists trained in both AI and the stubborn realities of rivers, aquifers, and pipes.
Hydrology gets resources for shared data infrastructure, foundation models and instrumented basins no single lab can support, a seat when rules for AI and national scientific infrastructure are negotiated, and a chance to reset practices around openness, collaboration, and equity.
Earlier this year, the DOE released 26 Genesis Mission Science and Technology Challenges, and “Predicting U.S. Water for Energy” was among them. The accompanying funding call (DE-FOA-0003612) solicits proposals on cloud microphysics, coupled surface water–groundwater modeling, and seasonal to multiyear prediction, all framed around energy needs and flood resilience.
These inclusions are a significant win for a hydrology component to Genesis, but several urgent challenges sit outside their scope. Can AI close the gap between a flood forecast issued 12 hours out and the 48 hours emergency managers actually need? Can it map compound extremes, in which drought, heat, and infrastructure failure collide in the same week? Can it redesign monitoring networks so that coverage follows risk rather than where gauges happened to be installed a century ago? Integrating energy and water systems is equally urgent: Floods have caused 80% of major U.S. grid outages since 2000, while drought-driven water stress curtails cooling at thermoelectric plants and reduces hydropower output, exposing how deeply energy infrastructure depends on hydrologic extremes.
The water footprint of new AI infrastructure deserves a place on that list. A separate executive order (14318, “Accelerating Federal Permitting of Data Center Infrastructure”) is already fast-tracking expansion of data center construction, and a single hyperscale facility can consume 1 million to 5 million gallons of water daily. Emerging research shows how withdrawals at that scale can push streams below ecological thresholds during low flows.
Make Hydrology the Conscience of AI Governance
The EO directs the DOE to set data access rules and clarify policies for ownership, licensing, trade secret protections, and commercialization of products and tools associated with it.
Three principles should anchor such policies for AI use in water security.
First, Indigenous and community data rights must be embedded in every major AI water security effort, in line with the collective benefit, authority to control, responsibility, and ethics (CARE) principles for Indigenous data governance.
Second, AI’s own water footprint, through electricity generation and cooling, must be treated as a design constraint. Transparent reporting, stress-based siting, and efficiency targets will prevent hydrology in Genesis from being self-defeating.
Third, the DOE should define what failure looks like. Missing a flood crest portends loss of lives and livelihoods and breaches of treaties. Accountability standards must be measurable, and they must ask not just how accurate the forecast was on average, but who bore the cost when it was wrong.
A single executive order will not solve the country’s water security problems, and a single challenge topic will not either.
But the Genesis Mission has provided a seat at a table that did not exist 6 months ago. Whether the hydrology community treats it as a ceiling or a foundation depends on what happens next. Europe’s Destination Earth and the United Nations’ AI for Good water initiatives are already moving.
American hydrology now has a seat at the table. We should take it.
Kratzert, F., et al. (2019), Toward improved predictions in ungauged basins: Exploiting the power of machine learning, Water Resour. Res., 55, 11,344–11,354, https://doi.org/10.1029/2019WR026065.
Xiao, T., et al. (2025), Environmental impact and net-zero pathways for sustainable artificial intelligence servers in the USA, Nat. Sustainability, 8, 1,541–1,553, https://doi.org/10.1038/s41893-025-01681-y.
Zhang, L., et al. (2025), Foundation models as assistive tools in hydrometeorology: Opportunities, challenges, and perspectives, Water Resour. Res., 61, e2024WR039553, https://doi.org/10.1029/2024WR039553.
Author Information
Amobichukwu C. Amanambu (acamanambu@ua.edu), Department of Geography and the Environment, The University of Alabama, Tuscaloosa; and Jonathan Frame (jmframe@ua.edu), Department of Geological Sciences, The University of Alabama, Tuscaloosa
Citation: Amanambu, A. C., and J. Frame (2026), The Genesis Mission needs hydrology: Here’s how to incorporate it, Eos, 107, https://doi.org/10.1029/2026EO260131. Published on 28 April 2026.
This article does not represent the opinion of AGU, Eos, or any of its affiliates. It is solely the opinion of the author(s).
Editors’ Vox is a blog from AGU’s Publications Department.
Ensuring the sustainability of water resources and ecosystems in a changing world requires a thorough understanding of how water moves through Earth’s Critical Zone, a dynamic interface where air, water, soil, plants, and rocks interact. Researchers can track and model this movement of water using naturally occurring markers or “tracers.”
A recent article in Reviews of Geophysics explores the latest advancements in tracer-aided mi
Ensuring the sustainability of water resources and ecosystems in a changing world requires a thorough understanding of how water moves through Earth’s Critical Zone, a dynamic interface where air, water, soil, plants, and rocks interact. Researchers can track and model this movement of water using naturally occurring markers or “tracers.”
A recent article in Reviews of Geophysics explores the latest advancements in tracer-aided mixing models and how they can help us to better understand the Critical Zone. Here, we asked the authors to give an overview of the Critical Zone, how tracer-aided mixing modeling works, and future directions for research.
What is the Critical Zone (CZ)?
The Critical Zone is Earth’s “living skin”—the dynamic layer where the atmosphere, hydrosphere, biosphere, and lithosphere interact. It stretches from the top of the vegetation canopy and, in cold regions, from the surface of snowpacks and glaciers, down through soils and into the deeper aquifers. It encompasses lakes, streams, and wetlands at the surface, and extends beyond the soil layer to underlying groundwater aquifers. It is where rainfall, snowmelt and glacier melt become soil moisture, where plants take up water and return it to the atmosphere, where aquifers get recharged, and where streamflow is generated. In short, the Critical Zone is where most processes that sustain terrestrial life and freshwater resources unfold.
Why is it important to understand how water moves through the Critical Zone?
Virtually every freshwater resource we rely on (e.g., drinking water, irrigation) passes through the Critical Zone.
Virtually every freshwater resource we rely on (e.g., drinking water, irrigation) passes through the Critical Zone at some point. Global warming, land-use changes, and intensifying water demand emerging from rapid urbanization and changes in agriculture are reshaping how water is stored and released within the Critical Zone, often in ways we cannot yet predict. Understanding how much water is stored within the Critical Zone, how this water is both recharged from rainfall and snowmelt and eventually discharged into streams, and the timescale of these dynamic processes is essential for protecting ecosystems, safeguarding water supplies, and adapting to a changing climate.
How would you explain a tracer-aided mixing model to a non-specialist?
Imagine mixing a glass of orange juice with a glass of apple juice, and trying afterwards to work out how much of each went into the glass. If the juices had distinctive “fingerprints” (imagine its color, sugar content, or a specific chemical) and these fingerprints primarily changed because of the mixing of these two juices, you can then measure the fingerprint in the final mixture and back-calculate the proportion of its distinct sources.
Tracer-aided mixing models work in a similar way but can track the entire water cycle. Different water sources (e.g., rainfall, snowmelt, glacier melt, soil water, groundwater) can have distinct “fingerprints” in a naturally occurring tracer, such as stable isotopes of water or specific dissolved elements. By measuring these fingerprints in the streamwater or groundwater and in its potential sources for example, hydrologists can estimate how much each source contributed to the streamwater or groundwater.
Conceptual model of the different components of the Critical Zone. “Gw” stands for groundwater. Credit: Popp et al. [2025], Figure 2
What are some of the most significant and exciting recent advances in tracer-aided mixing models?
Classical mixing models relied on demanding assumptions: that all water sources can be identified and sampled, and that their signatures were distinct and constant in time. Much of the recent progress has been about relaxing these assumptions.
Bayesian approaches now estimate full probability distributions and provide a more realistic picture of uncertainty. Methods like Convex Hull End-Member Mixing Analysis (CHEMMA) use machine learning to infer the distinct sources directly from data, while ensemble hydrograph separation exploits tracer fluctuations over time, thereby making un-mixing feasible even when multiple sources have overlapping signatures. Perhaps the most conceptually novel advance is end-member splitting, which flips the question from “where does streamflow come from?” to “where does precipitation go?”
Alongside these modeling advances, there have been immense advances in how tracers are measured. Portable laser and mass spectrometers now enable high-frequency, in-situ tracer measurements which allows us to capture critical hydrological events such as storms and snowmelt in near-real time.
What are stable water isotope tracers and what are their advantages?
Stable water isotopes are naturally occurring non-radioactive atoms of hydrogen and oxygen that make up a water molecule but have slightly different molecular masses. The two stable isotopes widely used in hydrology are 2H (deuterium) and 18O (oxygen-18). Because these isotopes are part of the water molecule itself, they directly travel with the water molecule. Their key advantages are: (1) they are conservative, meaning they do not react chemically as water moves through soils and aquifers, and (2) they carry distinct signatures resulting from climatic variables such as air temperature.
These properties make stable water isotopes the most versatile and widely used tracer in Critical Zone hydrology.
Consequently, in the European Alps, winter precipitation has a different isotopic signature than summer precipitation because winters are cooler than summers. Other hydrological processes such as evaporation and sublimation leave a recognizable fingerprint on the remaining water, thereby allowing us to estimate how much evaporation or sublimation occurred. Stable water isotopes can be measured in essentially every water compartment, from atmospheric vapor and precipitation to snowpack, plant xylem, soil water, streams, and groundwater. Together, these properties make stable water isotopes the most versatile and widely used tracer in Critical Zone hydrology.
What are the current limitations of tracer-aided mixing models?
Despite their power, mixing models still face many constraints. End-member signatures vary in space and time, are sometimes too similar to distinguish, and some sources may be overlooked entirely. Non-conservative tracers such as nitrate or sulfate can react with their environment along their journey, thereby biasing results if these reactions are not explicitly accounted for.
Sampling is another major bottleneck. Capturing the spatial heterogeneity of soils, snowpacks, and groundwater requires a lot of measurements that are often logistically or financially prohibitive, especially in remote regions. Many of the newer, more powerful tracers such as noble gases or stable isotopes of trace elements, can only be analyzed by a handful of specialized laboratories. As a result, global coverage remains highly uneven, with key regions such as the Arctic and the global South still under-sampled.
What are some of the major unsolved questions and where is more research needed?
There are several fronts where more research is needed. Source signatures are not static, and methods that explicitly capture their variability in time are still underdeveloped. Embedding tracers within global Earth System Models would, in theory, enable more accurate assessment of hydrological partitioning e.g., how rainfall, snowmelt, and glacier melt are split between sublimation, evapotranspiration, groundwater, and streamflow. These will directly inform more robust climate projections, but this remains technically demanding.
Expanding data coverage in under-sampled regions is critical, and citizen science and low-cost sensors may help. Machine learning is a promising approach for uncovering non-linear relationships and gap-filling sparse datasets, but requires training data that often do not yet exist. Greater interdisciplinary integration, e.g., combining tracers with remote sensing, ecological indicators, and biogeochemical data, could yield a more holistic view of the Critical Zone. Finally, the field would benefit from shared protocols and open data practices to enhance progress.
Editor’s Note: It is the policy of AGU Publications to invite the authors of articles published in Reviews of Geophysics to write a summary for Eos Editors’ Vox.
Citation: Popp, A. L., and H. Beria (2026), Tracing water’s hidden journey through the Earth’s living skin, Eos, 107, https://doi.org/10.1029/2026EO265019. Published on 13 May 2026.
This article does not represent the opinion of AGU, Eos, or any of its affiliates. It is solely the opinion of the author(s).
Editors’ Vox is a blog from AGU’s Publications Department.
Mesoscale and submesoscale ocean processes influence ocean circulation, air-sea fluxes, ecosystem variability, and transport of materials. A new article in Reviews of Geophysics examines how these fine-scale processes shape the Indian Ocean, an ocean basin with unique monsoon behavior and a disproportionate impact on global climate. Here, we asked the authors to explain what mesoscale and submesoscale processes are, the techniques an
Mesoscale and submesoscale ocean processes influence ocean circulation, air-sea fluxes, ecosystem variability, and transport of materials. A new article in Reviews of Geophysics examines how these fine-scale processes shape the Indian Ocean, an ocean basin with unique monsoon behavior and a disproportionate impact on global climate. Here, we asked the authors to explain what mesoscale and submesoscale processes are, the techniques and challenges of observing and modeling fine-scale processes, and how biogeochemical cycles and climate change interact with these processes.
In simple terms, what are mesoscale and submesoscale processes?
Mesoscale processes pertain to oceanic features such as eddies and fronts, which typically span a range of approximately 10 to 100 kilometers and can persist from weeks to months. Submesoscale processes are of an even smaller scale, ranging between approximately 100 meters and 10 kilometers, and evolve rapidly within a time frame of hours to days. These encompass sharp fronts, filaments, and small vortices.
Mesoscale processes account for more than 80% of the total kinetic energy. Submesoscale motions are of particular significance as they generate robust vertical movements that establish a connection between the surface ocean and deeper layers. As elaborated in our review, mesoscale and submesoscale processes function as a crucial link between large-scale ocean circulation and small-scale turbulence, facilitating the transfer of energy across different scales and regulating the distribution of heat, salt, and nutrients throughout the ocean.
Why is it important to understand how fine-scale processes operate in the IndianOcean?
The Indian Ocean has a disproportionate influence on global climate.
The Indian Ocean has a disproportionate influence on global climate. It absorbs over a quarter of the ocean’s net heat gain and directly affects the environment and food security of nearly one-third of the world’s population. Unlike other ocean basins, the Indian Ocean is uniquely shaped by seasonally reversing monsoon winds and is strongly coupled with climate modes like the Indian Ocean Dipole and the Madden- Julian Oscillation. Mesoscale and submesoscale variability in this region modulates biogeochemical cycles, air-sea fluxes, and even large-scale energy balance. As our review highlights, understanding these fine-scale dynamics is essential for improving predictions of monsoon rainfall, tropical cyclone behavior, and long-term climate change.
How do scientists study mesoscale and submesoscale ocean processes?
Scientists employ a combination of field measurements, satellite observations, and numerical models, all of which were summarized in our review. In-situ observations serve as the foundation for mesoscale and submesoscale processes in the ocean. They encompass research cruises, moored arrays such as the RAMA network, Argo profiling floats, and autonomous platforms. The in-situ observations capture the three-dimensional structures and multiple variables during mesoscale and submesoscale processes.
Satellite altimetry has long been the principal tool for observing mesoscale eddies. However, the newly launched Surface Water and Ocean Topography (SWOT) mission is revolutionary, as it offers sea surface height measurements at an unprecedented resolution, enabling the direct observation of submesoscale features for the first time.
High-resolution regional models with grid spacings of a few kilometers or less enable researchers to simulate these processes and test dynamical theories under controlled conditions.
What are some of the challenges in observing and modeling these processes?
In our review paper, we tackled the challenges in observations by adhering to four principles, namely high-resolution (more observations in a relatively small region), synchrony (observations conducted at the same time), persistence (observations for a long time), and interdisciplinary (observations of multiple ocean properties). These principles are anticipated to offer valuable guidance for future observational endeavors to surmount the corresponding challenges.
Modeling also poses difficulties. Even state-of-the-art climate models are unable to explicitly resolve submesoscale processes. Consequently, their effects have to be approximated via parameterizations. The development of accurate parameterizations continues to be an active area of research. Moreover, as the model resolution improves, the widely employed hydrostatic approximation may lose its validity, necessitating more intricate non-hydrostatic formulations. Data assimilation for such rapidly evolving features presents a particularly arduous challenge.
How do fine-scale processes interact with biogeochemical cycles in the IndianOcean?
Mesoscale and submesoscale motions exert a strong regulatory influence on biogeochemical cycling.
Mesoscale and submesoscale motions exert a strong regulatory influence on biogeochemical cycling through the control of nutrient supply to the sunlit upper ocean. Cyclonic eddies elevate nutrient-rich deep waters into the euphotic zone, thereby promoting phytoplankton blooms. In contrast, anticyclonic eddies typically suppress surface productivity by deepening the mixed layer.
In the Arabian Sea, eddies and filaments can contribute up to 70% of the nutrients that support the monsoon-driven biological bloom. These fine-scale dynamics also have an impact on carbon dioxide exchange; mesoscale variability accounts for approximately 40% of the CO₂ flux variability in the western Arabian Sea. Moreover, eddies modulate oxygen minimum zones in the Arabian Sea and Bay of Bengal, where low oxygen levels have a profound effect on marine ecosystems.
How is climate change expected to influence these fine-scale processes in the Indian Ocean?
With the continuous progression of climate change, alterations in upper-ocean stratification, propelled by warming and modified freshwater inputs, are anticipated to transform the conditions giving rise to fine-scale instabilities. High-resolution climate model simulations suggest that in a warming global scenario, the eddy-active region associated with the Agulhas Current system may shift westward and poleward. This shift is correlated with the intensification of Agulhas leakage, which refers to the transport of warm Indian Ocean water into the Atlantic. These changes could exert far-reaching effects on global ocean circulation.
Warming is augmenting the frequency and intensity of marine heatwaves in the Indian Ocean.
Moreover, warming is augmenting the frequency and intensity of marine heatwaves in the Indian Ocean. These heatwaves disrupt vertical mixing and nutrient supply, thereby having cascading impacts on biological productivity. Nevertheless, substantial uncertainties persist in quantifying these long-term responses.
In general, there are two-way interactions between climate change and fine-scale processes. Alterations in one component will induce changes in the other, and the former will be subject to feedback from the latter.
What are the remaining questions or knowledge gaps where additional research is needed?
Our review reveals several key priorities. In the short term, specialized multi-scale observational campaigns are acutely required, especially in regions with insufficient sampling, to capture the three-dimensional structure and rapid evolution of submesoscale features. Additionally, a more in-depth understanding is needed regarding how eddies interact with barrier layers—regions characterized by strong salinity stratification that are unique to the northern Indian Ocean—and how these interactions regulate air-sea fluxes and marine heatwaves.
Longer-term challenges encompass integrating fine-scale dynamics into climate models and refining submesoscale parameterizations. Emerging tools from artificial intelligence and machine learning hold potential for representing unresolved processes and enhancing data assimilation. Finally, considering the logistical and financial requirements of fine-scale ocean research, sustained international collaboration will be indispensable.
Editor’s Note: It is the policy of AGU Publications to invite the authors of articles published in Reviews of Geophysics to write a summary for Eos Editors’ Vox.
Citation: Zhou, L., D. Wang, L. Wang, and C. Qiu (2026), Small-scale Indian Ocean dynamics underpin marine ecology and climate, Eos, 107, https://doi.org/10.1029/2026EO265025. Published on 4 June 2026.
This article does not represent the opinion of AGU, Eos, or any of its affiliates. It is solely the opinion of the author(s).
Source: AGU Advances
Models of glacial flow and retreat rely on estimates of glacial ice viscosity, the measure of the ice’s resistance to flow.
Ice viscosity is dependent on the stress applied to the glacier. Most ice sheet models use a standard equation to model ice flow that includes the variable n, called the stress exponent. A larger value of n means ice viscosity is more sensitive to changes in stress. For decades, glaciologists have, almost exclusively, used an assumed n value of 3
Models of glacial flow and retreat rely on estimates of glacial ice viscosity, the measure of the ice’s resistance to flow.
Ice viscosity is dependent on the stress applied to the glacier. Most ice sheet models use a standard equation to model ice flow that includes the variable n, called the stress exponent. A larger value of n means ice viscosity is more sensitive to changes in stress. For decades, glaciologists have, almost exclusively, used an assumed n value of 3 in the models they use to predict ice flow.
However, through recent experiments and observations, researchers have found that an n value of 4 may actually better represent the conditions of Earth’s ice sheets and glaciers.
Martin et al. created a model representation of the fast-retreating Pine Island Glacier in West Antarctica. The ice sheet in their model had a true n value of 4, but they ran model projections using both n = 4 and n = 3. That allowed them to observe how their model would incorrectly predict glacial flow and resulting sea level change, given an incorrect n value.
The researchers modeled glacial retreat for 100 years under both equations with two different glacial melting scenarios. They then modeled glacial recovery for another 300 years. Under a moderate scenario, the n = 3 model underestimated glacial retreat by 18% and sea level change contributions by 21%. Under an extreme melting scenario, the model underestimated sea level contributions by 35%.
Notably, those disparities in glacial retreat and sea level change contribution predictions increased more than would be expected between the two scenarios, potentially increasing the level of uncertainty in current projections of sea level change. The researchers also suggest that incorrect n values may be mistakenly attributed to other physical processes in current ice sheet models.
The results could have far-reaching implications for predictions of future glacial melt and may prompt investigations into its effects on sea level, the authors say. (AGU Advances, https://doi.org/10.1029/2025AV001946, 2026)
—Madeline Reinsel, Science Writer
Citation: Reinsel, M. (2026), Glaciers may flow into the ocean more quickly than we think, Eos, 107, https://doi.org/10.1029/2026EO260107. Published on 14 April 2026.
Source: Geophysical Research Letters
Real-time hydrologic forecasting predicts river level and flooding inundation by combining continuously updated rainfall measurements, river gauge readings, and weather forecasts. Most of these flood forecasting systems depend on human interpretation and adjustments, or a “forecasters-in-the-loop” approach, which pairs computer models with a human expert on flood dynamics and local conditions. In contrast, in a “forecasters-over-the-loop” system, humans
Real-time hydrologic forecasting predicts river level and flooding inundation by combining continuously updated rainfall measurements, river gauge readings, and weather forecasts. Most of these flood forecasting systems depend on human interpretation and adjustments, or a “forecasters-in-the-loop” approach, which pairs computer models with a human expert on flood dynamics and local conditions. In contrast, in a “forecasters-over-the-loop” system, humans supervise automated forecasts and intervene only if necessary.
Recently, artificial intelligence (AI) and machine learning (ML) have become more integrated into flood prediction, and many of these systems are faster at processing large datasets and learning complex patterns from historical records than traditional models alone. But these new technologies also come with limitations—AI and ML require extensive data and may struggle to capture extreme, rare events.
Even though ML and AI are often touted as the future of flood forecasting, most studies have tested this technology against models that provide historical simulations, not the real-time operational systems that would be used during a flood. These simplified models may lack local details or are tested at daily rather than hourly resolution. Their effectiveness may be overestimated.
Tran et al. produced the first study comparing the performance of ML models to an actual flood forecasting system used at the California Nevada River Forecast Center (CNRFC) that uses professional forecasters and traditional hydrologic models. The study suggests that a forecasters-in-the-loop approach outperforms the ML models in several key ways, including streamflow predictions and flood event detection, because forecasters can recognize model errors and account for poor input data—actions models cannot take on their own.
The researchers used data gathered from CNRFC river stage forecasts across 50 California and Nevada locations between 2012 and 2022 and river condition lead times from 1 to 96 hours. Compared to the ML models, the Community Hydrologic Prediction System used at CNRFC generally performed better at predicting stream flow and flood peaks, especially with longer lead times. Though the ML models could perform better at very short lead times, their accuracy declined quickly. Though automated forecasting options may seem promising, they are not yet a suitable replacement for human expertise when it comes to protecting lives and livelihoods from damaging floods, the researchers say. (Geophysical Research Letters,https://doi.org/10.1029/2025GL118317, 2026)
Citation: Owen. R. (2026), Keeping humans in the loop improves flood forecasting, Eos, 107, https://doi.org/10.1029/2026EO260161. Published on 19 May 2026.
Source: AGU Advances
Across the western United States, wildfires are increasing in size and intensity. As the climate continues to warm, more extreme wildfires will reshape landscapes and pose a growing risk to human health and natural ecosystems throughout the West.
Climate models, used to predict other effects of climate change, are unable to directly simulate wildfires. Instead, researchers link previously burned areas to climate variables such as temperature, precipitation, drought, a
Across the western United States, wildfires are increasing in size and intensity. As the climate continues to warm, more extreme wildfires will reshape landscapes and pose a growing risk to human health and natural ecosystems throughout the West.
Climate models, used to predict other effects of climate change, are unable to directly simulate wildfires. Instead, researchers link previously burned areas to climate variables such as temperature, precipitation, drought, and evaporation, then apply those relationships to future climate projections.
Many recent studies have connected higher vapor pressure deficit (VPD)—a measure of atmospheric dryness—to more area burned in previous fires. VPD increases as the temperature rises, so models that rely on it generally predict an increase in wildfire activity as the climate warms.
Cheng et al. raise questions about the role VPD plays in modeling wildfire, suggesting that VPD is a poor measure of fuel dryness at larger scales and overestimates potential burned areas under significant warming conditions. Instead, researchers suggest soil moisture could be a more reliable indicator of fuel dryness and lead to more moderate projections of wildfire increases.
The researchers looked at five forested ecoregions in the western states. Using the Western US MTBS-Interagency wildfire dataset from 1984 to 2020 combined with climate data (temperature, VPD, and soil moisture), the researchers analyzed drivers of the area burned from May through October. They connected this information with output from climate models to look at future burn potential.
VPD-based wildfire predictions increase sharply under warming conditions. These predictions showed that under 3°C of average global warming, 16 times as much land would burn by the end of the century, compared to historical levels. Under 4°C of warming, up to 66 times more land would burn by the end of the century. This “truly massive” increase, the authors say, would mean fires consuming vegetation almost as soon as it regrows.
Soil moisture, on the other hand, provides a more moderate, though still concerning, picture. Under the same warming scenarios, soil moisture changes would lead to an increase in burned area of only 2–3 times that of the historical period. The researchers argue that projections relying on VPD severely exaggerate wildfire risk. (AGU Advances, https://doi.org/10.1029/2026AV002350, 2026)
Citation: Owen, R. (2026), How much will western wildfires worsen under warming?, Eos, 107, https://doi.org/10.1029/2026EO260147. Published on 15 May 2026.
Planting more trees will decelerate climate change only if those trees are placed in optimal locations—primarily the tropics and subtropics—suggests new research published in Communications Earth and Environment. However, planting trees in locations like Alaska, Siberia, and large parts of the United States could actually lead to warming, said lead author and doctoral student at ETH Zurich Nora Fahrenbach.
Much of the current thinking in nature-based solutions, Fahrenbach said, is ba
Planting more trees will decelerate climate change only if those trees are placed in optimal locations—primarily the tropics and subtropics—suggests new research published in Communications Earth and Environment. However, planting trees in locations like Alaska, Siberia, and large parts of the United States could actually lead to warming, said lead author and doctoral student at ETH Zurich Nora Fahrenbach.
Much of the current thinking in nature-based solutions, Fahrenbach said, is based on the idea that “more is better.”
As in, “we’ll plant a trillion trees, or we’ll plant more than a trillion trees, and we are going to get more cooling, right?” Fahrenbach said. “That’s something we show is just not the case.”
Fahrenbach researches reforestation potentials, or global maps that identify areas where trees could be planted to mitigate climate change. In this work, she and her colleagues compared three prominent reforestation potentials to determine the effect of tree placement on local and global temperatures.
One scenario involved reforesting about 926 million hectares focused mostly on the tropics and resulted in about 0.25°C of cooling by 2100. Another called for reforesting 894 million hectares, including large areas in northern temperate and polar latitudes, and resulted in 0.13°C of cooling by 2100.
The third scenario involved planting forests strategically over only 440 million hectares of mostly tropical and subtropical land (less than half of the area covered in the other scenarios) but also resulted in 0.13°C of cooling. Geography, the findings suggest, may matter more than quantity when it comes to the cooling benefits of reforestation efforts.
Let’s Get (Biogeo)physical
The researchers modeled all three scenarios using the same parameters: Trees were planted from 2015 to 2070 and then remained steady in their population until 2100.
Planting trees in one area doesn’t just change the local temperature but has effects across the world.
All three models identified reforestation opportunities in regions such as the eastern United States, Amazonia, the Congo rainforest, and eastern China, as well as regions for which reforestation would not be as impactful, such as polar regions in the Northern Hemisphere. The researchers also found significant temperature changes across the Atlantic and Indian oceans as a result of atmospheric changes induced by reforestation, demonstrating an interconnected reality: Planting trees in one area doesn’t just change the local temperature but has effects across the world.
These local and nonlocal effects can be explained by a combination of biogeochemical and biogeophysical effects.
A biogeochemical effect relates to the movement of chemicals or chemical elements, such as trees absorbing carbon from the atmosphere.
A biogeophysical effect relates to the physical results of changing the land’s surface: Placing a tree in a snowy region, for instance, decreases the land’s albedo, meaning it causes the land surface to become darker and absorb more light, leading to more local heat. This rise in surface temperature also raises air temperature, creating cascading effects on wind patterns and oceanic currents.
Considering both processes together is essential for understanding whether a net cooling or net heating effect exists, but most policies focus only on biogeochemical effects, seeing trees solely for their ability to absorb carbon from the atmosphere, Fahrenbach said. They include prominent international policies such as the Paris Agreement and the United Nations’ Framework for REDD+.
“Really, we would also need to consider the biogeophysical effects,” Fahrenbach said. “That’s harder to do, right, considering those nonlocal effects, because just imagine, some country is going to plant a lot of trees, and that’s going to lead to warming somewhere else.”
A Call to Policymakers
Emilio Vilanova, a forest ecologist at the climate action nonprofit Verra, wrote by email, “The most important message for me is that this study emphasizes something that is often not well addressed in reforestation projects: Reforestation is not just about planting trees—it’s about designing where new forests go to maximize benefits and avoid unintended consequences.”
“Reforestation is a helpful tool, not a stand-alone solution to climate change.”
Vilanova also said the study puts the potential for reforestation efforts to address climate change in perspective. “Even very large reforestation efforts would only reduce global temperatures by about 0.13–0.25°C by the end of the century,” he said. “While meaningful, this finding also reinforces that reforestation is a helpful tool, not a stand-alone solution to climate change.”
Though the limited potential for change is sobering, the authors and Vilanova pointed out that this change does matter and that it matters how we think of our approach. They advocate for policies that adopt reforestation strategies based on location and that acknowledge both the local and nonlocal effects of reforestation.
“We really need to make sure that where we plant first, it has benefits locally, it has benefits globally,” Fahrenbach said.
22 April 2026: This article was updated to correct Nora Fahrenbach’s position at ETH Zurich.
This news article is included in our ENGAGE resource for educators seeking science news for their classroom lessons. Browse all ENGAGE articles, and share with your fellow educators how you integrated the article into an activity in the comments section below.
Citation: Meissen, A. (2026), Location, location, location: The “where” of reforestation may matter more than the extent, Eos, 107, https://doi.org/10.1029/2026EO260125. Published on 22 April 2026.
Tiny saltwater channels have a big influence on sea ice.
Sea ice typically includes pockets or channels of brine that allow salt water to flow vertically through the ice. When those channels align neatly, they need to make up only about 5% of the ice volume before the water can flow. But in more disordered, granular ice, salt water starts to flow only when the brine channels take up more space—roughly 10% of the ice volume, according to a new study published in Scientific Reports.
“If we’
Tiny saltwater channels have a big influence on sea ice.
Sea ice typically includes pockets or channels of brine that allow salt water to flow vertically through the ice. When those channels align neatly, they need to make up only about 5% of the ice volume before the water can flow. But in more disordered, granular ice, salt water starts to flow only when the brine channels take up more space—roughly 10% of the ice volume, according to a new study published in Scientific Reports.
“If we’re trying to find predictive models about how these ice cores are responding under climate change, it’s going to be necessary to take into account these structural and microstructural conditions.”
This higher threshold could slow the drainage of surface melt ponds, as well as the transport of nutrients to microbial communities inside the ice.
“If we’re trying to find predictive models about how these ice cores are responding under climate change, it’s going to be necessary to take into account these structural and microstructural conditions,” said Stephen Ackley, a sea ice researcher at the University of Texas at San Antonio who was not involved in the study.
Disorderly Constructs
As seawater freezes, it forms a mixture of ice crystals and brine. In calm conditions, the ice slowly grows into long, parallel crystals separated by orderly brine channels. This columnar sea ice is common in the Arctic, and its properties have been widely used in sea ice models.
But in choppy waves or when the ice’s snow-covered surface floods and refreezes, new ice can’t grow into these ordered columns. Instead, it forms small, randomly oriented grains separated by more complex pores containing brine and gases. Called granular ice, this form is more common in Antarctica but is becoming increasingly prevalent in the Arctic as temperatures rise and ice cover thins.
“It’s the sequel we’ve been waiting decades for.”
In 1998, University of Utah mathematician Kenneth Golden established the first estimate of the point at which the brine channels are connected enough to allow water to flow in columnar ice, called the percolation threshold. The new work, also led by Golden, extends a similar analysis to granular sea ice.
“It’s the sequel we’ve been waiting decades for,” said Don Perovich, a sea ice researcher at Dartmouth who was not involved in the new work.
To quantify the percolation threshold for granular ice, Golden and his colleagues collected sea ice samples during two expeditions off the eastern coast of Antarctica in 2007 and 2012. They measured how quickly water moved through the brine channels in the ice. After the 2012 expedition, they also mapped the arrangement of ice crystals within the ice blocks to correlate those permeability measurements with the microscale structure of the ice.
Most climate models are based on the assumption that the microstructure of sea ice is organized into columns, like those in the image on the left. But new research shows that granular ice, as seen on the right, is growing more common in the Arctic, which could affect climate modeling. Credit: Golden et al., 2026, https://doi.org/10.1038/s41598-026-41706-w, CC BY-NC-ND 4.0
The finding that in granular ice, about twice as much of the ice volume needs to be brine for water to flow compared to columnar ice suggests that brine channels within granular ice are much less interconnected.
With the higher threshold, “you have to reassess all these models, anything that relies on fluid flow through sea ice,” if granular ice is present, said Golden. Granular ice will require warmer or saltier conditions to leave enough brine in the ice structure to meet the percolation threshold and allow water to flow vertically.
Researchers extracted blocks of ice in Antarctica with a chainsaw and poured dyed salt water on top. In this way, they observed how quickly the fluid descended through the ice. Credit: Kenneth Golden
For example, the new value could influence models of how meltwater ponds behave atop an underlying ice sheet. If meltwater ponds form above a base of granular sea ice, those ponds will require warmer temperatures before they start draining than melt ponds on columnar ice will.
If these melt ponds remain on the surface longer waiting for those warmer temperatures, they could lower the albedo, or reflectivity, of the ice sheet. That could cause the ice sheet to absorb more heat, leading to a feedback loop that could accelerate melting.
The higher percolation threshold could also affect algae that lives within the ice. Ice algae make up an important food source for krill and crustaceans, which in turn become food for fish, penguins, and whales. Algae rely on water flowing through the ice to deliver nutrients. Because granular ice requires warmer temperatures for that flow to start, it could affect the depth at which algae can live inside the ice, Golden said.
Percolation Consideration
Still, experts say more data are needed to establish percolation thresholds across both Arctic and Antarctic ice. The size of the grains in granular ice can vary substantially at different temperatures, under different formation conditions, and between the poles. Larger grains could lower the percolation threshold, allowing water to flow even when the ice contains much less than 10% brine by volume, said Sønke Maus, a scientist studying ice microstructure at the Norwegian University of Science and Technology who was not involved in the study.
“The data that we have at the moment for the granular sea ice is sparse,” Maus said. “You need a big campaign to collect such data.”
Golden said that in future work he also plans to develop models to compute the electromagnetic properties of both columnar and granular sea ice. Knowing these properties can help scientists determine the thickness and age of an ice sheet from satellite data.
Citation: Ware, S. (2026), Changes in sea ice microstructure could affect climate models, Eos, 107, https://doi.org/10.1029/2026EO260164. Published on 20 May 2026.