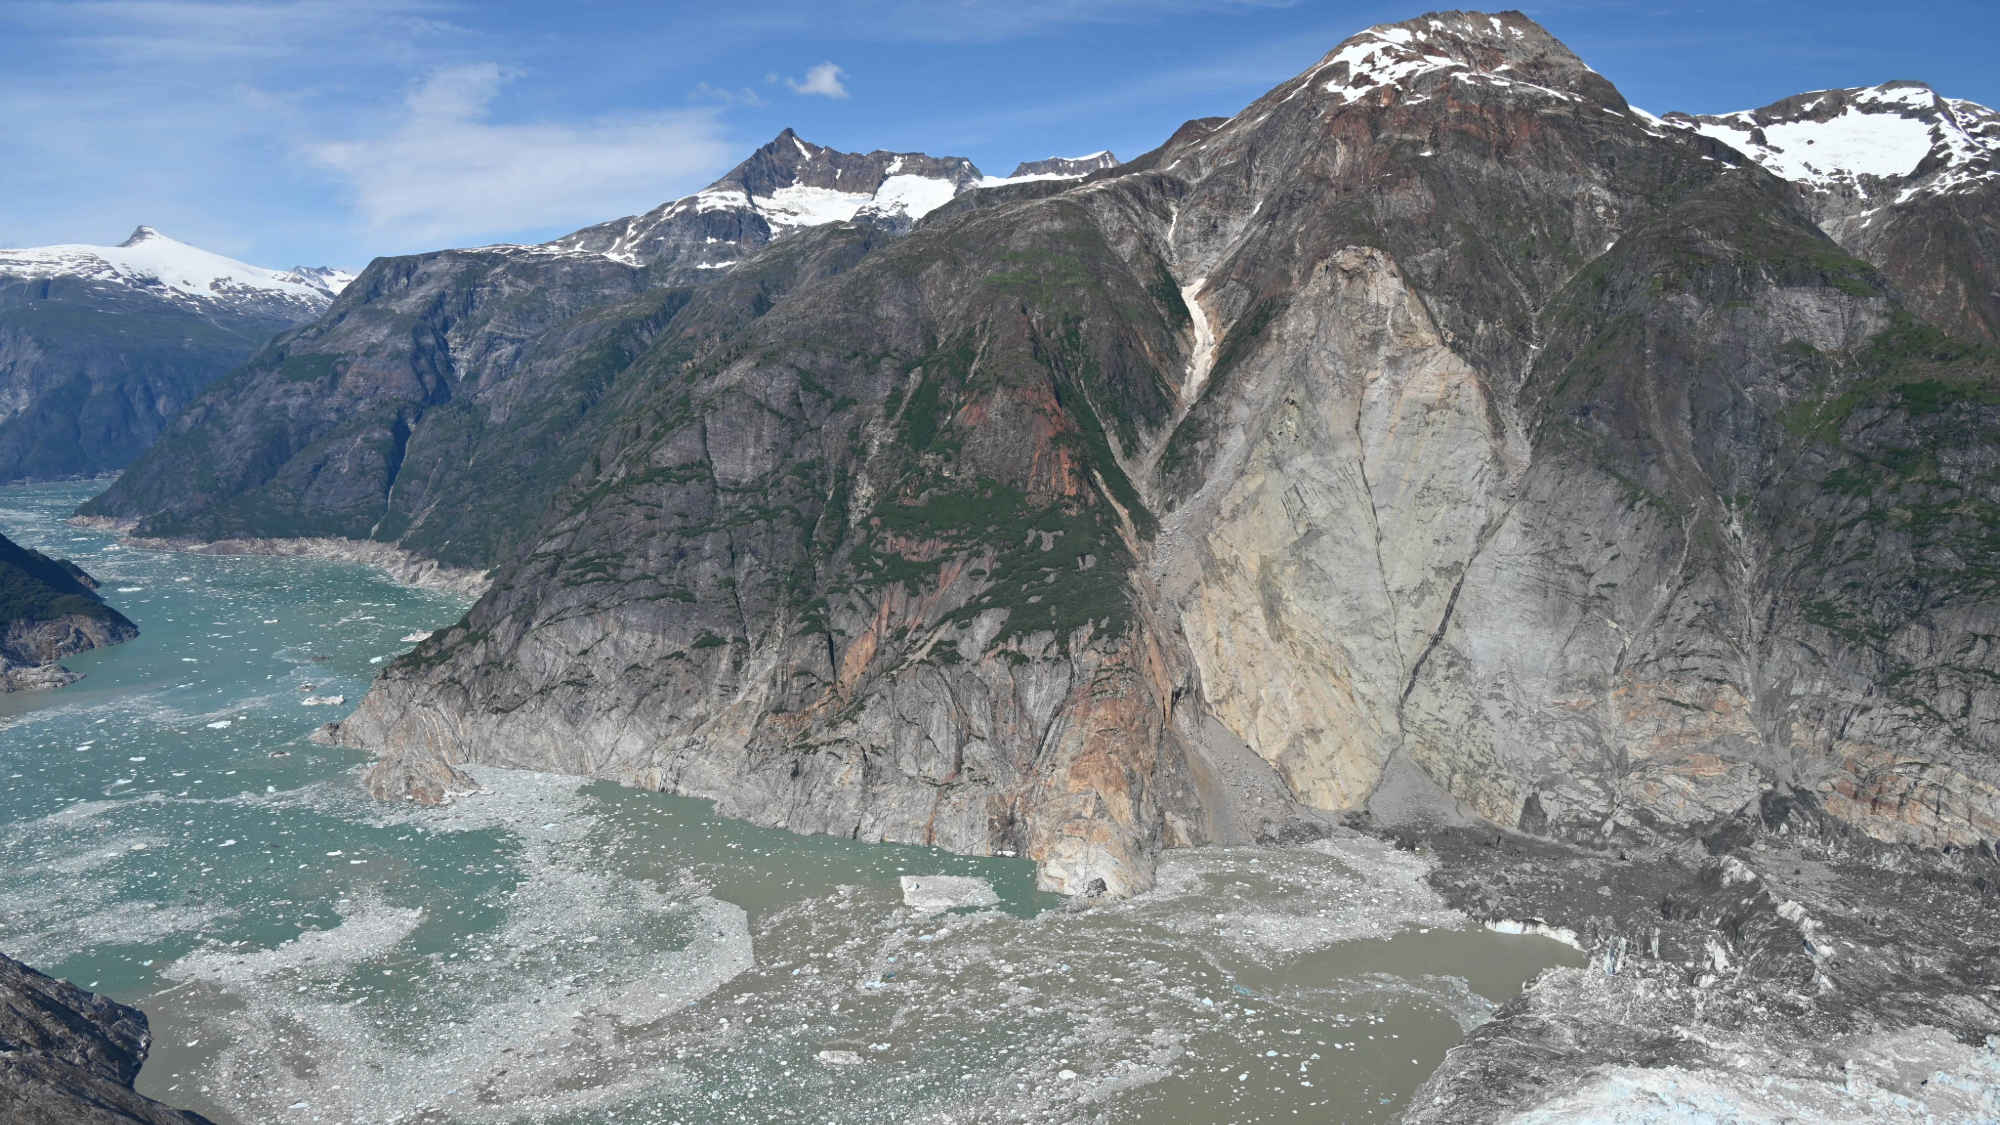
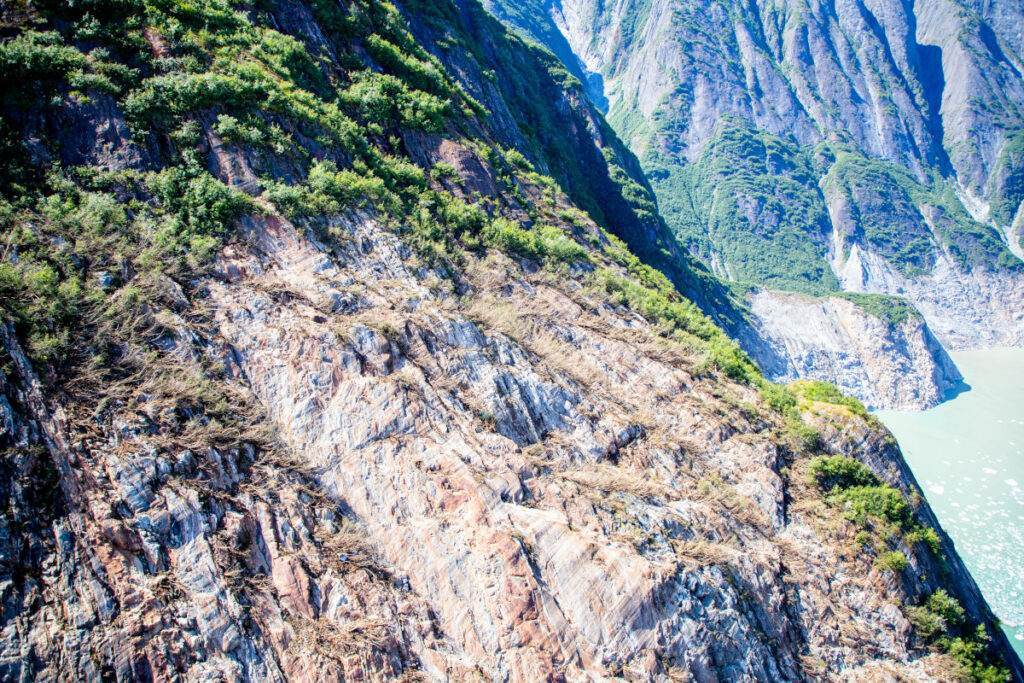
If you’re one of the roughly 1.6 million people who took a cruise in Alaska last year, chances are you sailed through the Tracy Arm fjord. The picturesque, narrow fjord is a popular sightseeing area and is part of the Tongass National Forest, about 40 to 50 miles south of the capital city of Juneau.
In the early hours of August 10, 2025, an enormous landslide triggered a massive tsunami down the fjord. The tsunami was 1,578-feet-tall, or one-and-a-half times the height of the Eiffel Tower. Fo
If you’re one of the roughly 1.6 million people who took a cruise in Alaska last year, chances are you sailed through the Tracy Arm fjord. The picturesque, narrow fjord is a popular sightseeing area and is part of the Tongass National Forest, about 40 to 50 miles south of the capital city of Juneau.
In the early hours of August 10, 2025, an enormous landslide triggered a massive tsunami down the fjord. The tsunami was 1,578-feet-tall, or one-and-a-half times the height of the Eiffel Tower. Fortunately, no one was caught in the wave since it hit around 5:30 a.m. local time. If the tsunami hit later that day, about 20 cruise ships and numerous recreational boaters and kayakers could have been impacted by the giant wave.
In a study published today in the journal Science, researchers studied this “near miss” event, finding that the continued effects of climate change were likely the cause.
The team studied several eyewitness stories from that day. In one account, a group of kayakers reported waking around 5:45 a.m. to water flowing past their campsite and carrying away a kayak and much of their gear. Another observer aboard a cruise ship near the mouth of the fjord saw currents and white water with no wave, while another eyewitness described a six-foot wave along the beach.
The team of researchers also studied satellite data with NASA’s new Surface Water Ocean Topography satellite before and after the event, in addition to seismic data and numerical modelling to understand exactly what happened that August morning.
Field photos from reconnaissance trip for 2025 Tracy Arm landslide on August 13, 2025. Image: U.S. Geological Survey
“Until now, we simply didn’t have a way to observe these waves directly, but our study has demonstrated that using data from the new Surface Water Ocean Topography satellite can reveal the full sea-surface structure of these events, even if no one witnesses them directly,” Dr. Thomas Monahan, a study co-author and engineer at the University of Oxford in the United Kingdom, said in a statement.
Monahan and the other study authors also found that there was not much warning before the landslide hit.
“Normally with these gigantic rock avalanches, they often give some sort of warning signs in the weeks, months, years prior, when the slope is slowly moving down the mountain. It’s sagging and then it catastrophically gives way in a rock avalanche,” said Dr. Dan Shugar, a geomorphologist at the University of Calgary in Canada. “In this case, that didn’t happen.”
Instead, there was some minor seismic noise that was so slight it went completely undetected
“This one was truly a surprise,” Shugar added, noting that this presents some challenges for disaster reduction in high-risk areas.
Importantly, they found that the glacial retreat in the Alaska fjord led to the tsunami. From 1985 to 2020, glacier-covered areas in Alaska decreased by 13 percent. As temperatures continue to rise, glaciers will melt more and begin to retreat or shrink. These frosty mountainsides then can become unstable if the ice that has been in place for centuries melts away.
As cold regions continue to warm, glacier retreat increases the risk of hazards like this landslide, the study argues. Landslide-generated tsunamis like this can produce extreme, localized water inundation that is even bigger than those caused by the tsunamis generated by earthquakes. The size of the waves and narrowness of the fjords can be a recipe for disaster.
However, carefully monitoring glaciers could help catch these kinds of tsunamis before they happen. This is especially important as climate change continues to affect these regions. The Tracy Arm fjord alone sees upwards of 500,000 visitors per year, so catching tsunamis early is crucial for public safety
“Ultimately what we hope is that coastal municipalities, the cruise ship industry, and other stakeholders take these threats seriously,” said Shugar.
At least six cruise lines, including Carnival Cruise Line, have altered their itineraries in Alaska for 2026 due to the hazards that remain in the Tracy Arm fjord. Additionally, the United States Geological Survey warns that steep, mountainous landslide areas are “inherently unstable.” The Tracy Arm fjord tsunami will likely continue to change the landscape for years to come.
President Donald Trump is again seeking to boost the struggling U.S. coal industry, with an announcement expected Thursday to spend nearly $700 million to support coal-fired power plants and coal exports.
President Donald Trump is again seeking to boost the struggling U.S. coal industry, with an announcement expected Thursday to spend nearly $700 million to support coal-fired power plants and coal exports.
Source: Earth’s Future
Coastal landscapes are constantly being reshaped by natural forces, and as climate change causes more frequent storms and sea level rise, that change will only intensify. Because these areas are densely populated with homes, tourist destinations, and industries, understanding how and where the coast will change is a pressing issue. However, reliable predictions that lead to actionable knowledge are rare.
Lentz et al. describe the state of knowledge regarding coastal
Coastal landscapes are constantly being reshaped by natural forces, and as climate change causes more frequent storms and sea level rise, that change will only intensify. Because these areas are densely populated with homes, tourist destinations, and industries, understanding how and where the coast will change is a pressing issue. However, reliable predictions that lead to actionable knowledge are rare.
Lentz et al. describe the state of knowledge regarding coastal evolution, highlight gaps in scientists’ understanding, and describe opportunities for integrating information from various models, data sources, and end users.
Current coastal evolution predictions are often focused on too specific a location and are therefore hard to generalize or analyze too large a region and therefore lack detail, the authors say. In addition, it’s challenging for researchers to link the effects of acute events, such as storms, with long-term trends like sea level rise.
Improving these simulations will likely require combining many different types of models, including physics-based numerical models, models based on empirical measurements, and statistical models that include machine learning. To fully understand potential changes, the authors note that it is also essential to consider both coastal processes and human actions.
The researchers recommend several ways to improve consistency and collaboration in the field of coastal change forecasting. First, standardizing approaches and outcomes would make it easier to produce national-scale predictions. Right now, the variety of tools used across different locations makes it difficult for scientists to compare results and communicate effectively. They also emphasize the need for using coordinated research approaches. Stronger transdisciplinary collaboration, accompanied by essential training and support, would also enable scientists to make better predictions, the researchers say.
Comparing predictions to real-world observations of coastal landscape change could also help untangle this multifaceted challenge. By studying how coastlines have already changed, researchers can validate models and choose those that are performing best. Such comparisons require datasets that adequately capture coastal landscape change across both time and space. Remote sensing data and the use of artificial intelligence (AI) for data processing may help provide these improved datasets, the researchers suggest.
Engaging end users during the project planning process is also helpful because only end users truly know what kind of information they need to adapt to landscape change. Knowing how to engage end users can be difficult for physical scientists, but various tools and specialized personnel exist who can help coordinate these interactions, the authors say. (Earth’s Future, https://doi.org/10.1029/2024EF005833, 2026)
Want updates from a trusted source about climate change’s impacts on oceans? Preference Eos in your searches!
Go to Google
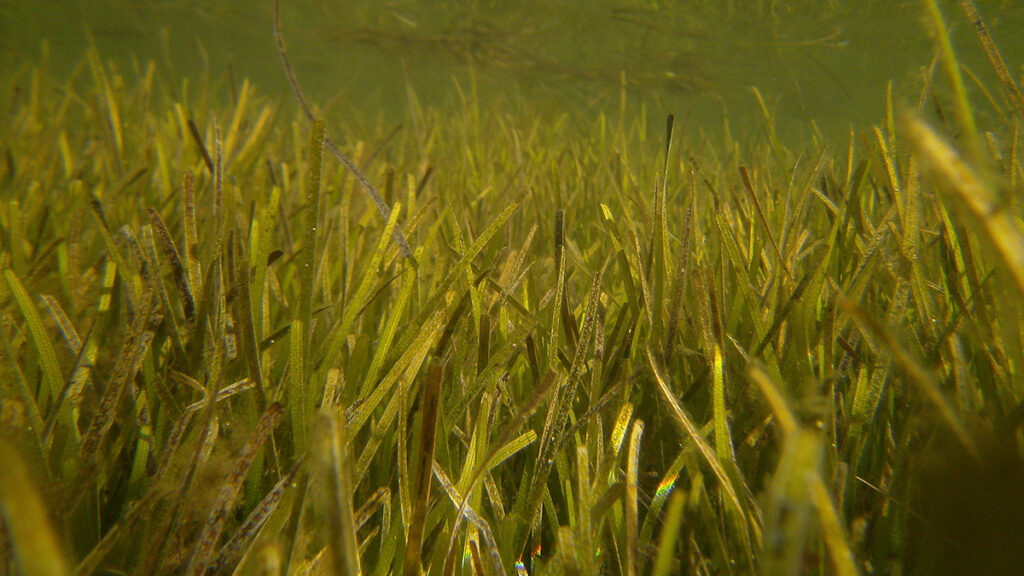
Renske Jongen, an ecologist at the University of Sydney, calls seagrass ecosystems the “tropical rainforests” of the ocean. These underwater flowering plants offer habitats to marine life, protect coastlines from damage, and, like rainforests, store enormous amounts of carbon.
They’re also under threat from pollution, development, and warming ocean waters, whic
Renske Jongen, an ecologist at the University of Sydney, calls seagrass ecosystems the “tropical rainforests” of the ocean. These underwater flowering plants offer habitats to marine life, protect coastlines from damage, and, like rainforests, store enormous amounts of carbon.
They’re also under threat from pollution, development, and warming ocean waters, which stress plants and slow growth rates. Seagrass populations have been declining globally for nearly a century, and recent estimates suggest 7% of seagrasses are lost worldwide each year.
A new study published in New Phytologist shows that warming waters may affect a microscopic aspect of the seagrass ecosystem, too: the microbes that live in their sediments. The new insight can inform efforts to restore seagrasses, the authors write.
Seagrasses are “getting attacked from both sides,” said Jongen, the lead author of the new study. Warming water stresses the plants themselves, while “something changes in the sediment that makes them grow worse.”
Sediments and Seagrass
The research team transplanted seagrasses from elsewhere in Lake Macquarie to a preexisting, artificially warmed area to run their experiment. Credit: Renske Jongen
To test how microbial communities affect seagrass growth under warming temperatures, Jongen and the research team transplanted seagrasses and their sediment from both warm and cool areas of Lake Macquarie, a coastal saltwater lake in New South Wales, Australia, into an artificially warmed part of the lake. The artificially warmed part of the lake has received intermittent plumes of heated water from a nearby power plant since 1984, leading to a consistent temperature increase of 1°C–3°C (1.8°F–5.7°F) compared with the rest of the lake.
For half of the seagrasses, the team also used an autoclave, an instrument that uses steam to sterilize materials, to kill most of the microbes in their associated sediment before transplanting them to the experimental garden. “By looking at how plants respond with and without their microbes, you can get an idea for whether [those microbes] help or harm the plant under certain environments,” Jongen said.
The plants were then left to grow for 28 days before the team measured how they’d fared.
The warm-origin seagrasses in their original, warm-origin sediments with microbes intact grew the slowest once they were in the artificially heated waters, producing 35% less aboveground biomass than their counterparts whose sediment microbial communities had been killed. That result suggests that the microbial community in warmed sediment contributes to seagrass stress, the authors wrote.
“These plants, in general, do not like sediments that have been exposed to warmer temperatures.”
“These plants, in general, do not like sediments that have been exposed to warmer temperatures,” Jongen said. She was surprised that the plants that came from the warm areas had the worst outcomes but hypothesizes that perhaps these plants were already too stressed from warm waters to deal with the changes to sediment bacterial communities that occurred after they were transplanted into the even warmer part of the lake.
“It’s just like us, for example: When we don’t sleep or we’ve had a stressful week, then we get sick more easily,” she said.
Jongen said more research is needed to say for sure why warmed sediment seems to change microbial communities in a way that harms seagrasses. But research has shown that some microbes in ocean sediment produce sulfide, which can be toxic to seagrasses if it accumulates, especially if those seagrasses are already stressed. Warmer conditions may allow these sulfide-producing microbes to grow more quickly, harming the plants.
The new research highlights the “context dependency of host-microbe interactions,” said Karolina Zabinski, a marine ecologist at the University of California, Davis, who was not involved in the new study. Previous research by Zabinski and others also showed that seagrass growth depends on their associated sediment microbiome.
Restoration Lessons
The new study “serves as a great springboard” for both academics seeking to understand seagrass-microbe interactions and practitioners working on seagrass restoration in the field, Zabinski said.
For academic researchers, the paper raises exciting questions about how the microbial communities present in the sediment actually function, she said. Though the study identified the types of microbes in the seagrasses’ sediments, it didn’t evaluate the abilities of those microbes, which genes they possess or express, or how those microbes interacted with each other. “What are their actual genes, and what are they doing?” Zabinski asked.
“When plants don’t do well, we can’t just assume it’s inherent to the plants—we have to remember it could be driven by the microbes that they’re interacting with.”
For seagrass restoration practitioners, the study could offer new methods to try to improve restoration success. Some projects, for example, aim to take plants from warmer environments and transplant them to seagrass ecosystems that will face warming stress in the future as the climate changes. “It seems pretty intuitive that maybe those plants will have the traits or the genetics to respond to that warming,” said Randall Hughes, a marine ecologist at Northeastern University in Boston who was not involved in the new study. But the study’s results highlight “that intuition is not always reliable.”
“Certainly, having experimental studies like this helps us think about those restoration efforts in a more informed way,” she said. “When plants don’t do well, we can’t just assume it’s inherent to the plants—we have to remember it could be driven by the microbes that they’re interacting with.”
Jongen hopes to continue studying related questions about how seagrasses respond to warming waters. In particular, she’d like to investigate how long changes to the sediment microbial community last and whether those changes reverse once a marine heat wave subsides.
The research team collected sediments and seagrasses from different sites within Lake Macquarie before transplanting the plants into an artificially warmed area of the lake. Credit: Renske Jongen
Ultimately, the answers to these questions will help scientists better predict where seagrasses are in danger and how they might be helped. “If we lose the seagrasses, we don’t only lose the seagrasses, we lose all the other benefits that they provide,” Jongen said. “I think they deserve a little bit more attention.”
Citation: van Deelen, G. (2026), Warm waters disrupt seagrasses’ microbial environment, Eos, 107, https://doi.org/10.1029/2026EO260166. Published on 22 May 2026.
Editors’ Vox is a blog from AGU’s Publications Department.
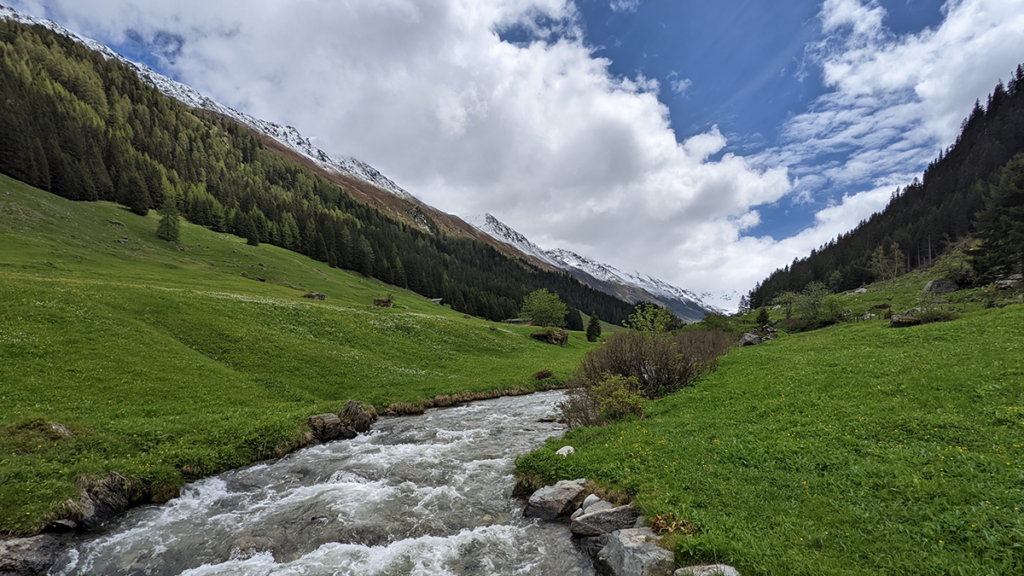
Ensuring the sustainability of water resources and ecosystems in a changing world requires a thorough understanding of how water moves through Earth’s Critical Zone, a dynamic interface where air, water, soil, plants, and rocks interact. Researchers can track and model this movement of water using naturally occurring markers or “tracers.”
A recent article in Reviews of Geophysics explores the latest advancements in tracer-aided mi
Ensuring the sustainability of water resources and ecosystems in a changing world requires a thorough understanding of how water moves through Earth’s Critical Zone, a dynamic interface where air, water, soil, plants, and rocks interact. Researchers can track and model this movement of water using naturally occurring markers or “tracers.”
A recent article in Reviews of Geophysics explores the latest advancements in tracer-aided mixing models and how they can help us to better understand the Critical Zone. Here, we asked the authors to give an overview of the Critical Zone, how tracer-aided mixing modeling works, and future directions for research.
What is the Critical Zone (CZ)?
The Critical Zone is Earth’s “living skin”—the dynamic layer where the atmosphere, hydrosphere, biosphere, and lithosphere interact. It stretches from the top of the vegetation canopy and, in cold regions, from the surface of snowpacks and glaciers, down through soils and into the deeper aquifers. It encompasses lakes, streams, and wetlands at the surface, and extends beyond the soil layer to underlying groundwater aquifers. It is where rainfall, snowmelt and glacier melt become soil moisture, where plants take up water and return it to the atmosphere, where aquifers get recharged, and where streamflow is generated. In short, the Critical Zone is where most processes that sustain terrestrial life and freshwater resources unfold.
Why is it important to understand how water moves through the Critical Zone?
Virtually every freshwater resource we rely on (e.g., drinking water, irrigation) passes through the Critical Zone.
Virtually every freshwater resource we rely on (e.g., drinking water, irrigation) passes through the Critical Zone at some point. Global warming, land-use changes, and intensifying water demand emerging from rapid urbanization and changes in agriculture are reshaping how water is stored and released within the Critical Zone, often in ways we cannot yet predict. Understanding how much water is stored within the Critical Zone, how this water is both recharged from rainfall and snowmelt and eventually discharged into streams, and the timescale of these dynamic processes is essential for protecting ecosystems, safeguarding water supplies, and adapting to a changing climate.
How would you explain a tracer-aided mixing model to a non-specialist?
Imagine mixing a glass of orange juice with a glass of apple juice, and trying afterwards to work out how much of each went into the glass. If the juices had distinctive “fingerprints” (imagine its color, sugar content, or a specific chemical) and these fingerprints primarily changed because of the mixing of these two juices, you can then measure the fingerprint in the final mixture and back-calculate the proportion of its distinct sources.
Tracer-aided mixing models work in a similar way but can track the entire water cycle. Different water sources (e.g., rainfall, snowmelt, glacier melt, soil water, groundwater) can have distinct “fingerprints” in a naturally occurring tracer, such as stable isotopes of water or specific dissolved elements. By measuring these fingerprints in the streamwater or groundwater and in its potential sources for example, hydrologists can estimate how much each source contributed to the streamwater or groundwater.
Conceptual model of the different components of the Critical Zone. “Gw” stands for groundwater. Credit: Popp et al. [2025], Figure 2
What are some of the most significant and exciting recent advances in tracer-aided mixing models?
Classical mixing models relied on demanding assumptions: that all water sources can be identified and sampled, and that their signatures were distinct and constant in time. Much of the recent progress has been about relaxing these assumptions.
Bayesian approaches now estimate full probability distributions and provide a more realistic picture of uncertainty. Methods like Convex Hull End-Member Mixing Analysis (CHEMMA) use machine learning to infer the distinct sources directly from data, while ensemble hydrograph separation exploits tracer fluctuations over time, thereby making un-mixing feasible even when multiple sources have overlapping signatures. Perhaps the most conceptually novel advance is end-member splitting, which flips the question from “where does streamflow come from?” to “where does precipitation go?”
Alongside these modeling advances, there have been immense advances in how tracers are measured. Portable laser and mass spectrometers now enable high-frequency, in-situ tracer measurements which allows us to capture critical hydrological events such as storms and snowmelt in near-real time.
What are stable water isotope tracers and what are their advantages?
Stable water isotopes are naturally occurring non-radioactive atoms of hydrogen and oxygen that make up a water molecule but have slightly different molecular masses. The two stable isotopes widely used in hydrology are 2H (deuterium) and 18O (oxygen-18). Because these isotopes are part of the water molecule itself, they directly travel with the water molecule. Their key advantages are: (1) they are conservative, meaning they do not react chemically as water moves through soils and aquifers, and (2) they carry distinct signatures resulting from climatic variables such as air temperature.
These properties make stable water isotopes the most versatile and widely used tracer in Critical Zone hydrology.
Consequently, in the European Alps, winter precipitation has a different isotopic signature than summer precipitation because winters are cooler than summers. Other hydrological processes such as evaporation and sublimation leave a recognizable fingerprint on the remaining water, thereby allowing us to estimate how much evaporation or sublimation occurred. Stable water isotopes can be measured in essentially every water compartment, from atmospheric vapor and precipitation to snowpack, plant xylem, soil water, streams, and groundwater. Together, these properties make stable water isotopes the most versatile and widely used tracer in Critical Zone hydrology.
What are the current limitations of tracer-aided mixing models?
Despite their power, mixing models still face many constraints. End-member signatures vary in space and time, are sometimes too similar to distinguish, and some sources may be overlooked entirely. Non-conservative tracers such as nitrate or sulfate can react with their environment along their journey, thereby biasing results if these reactions are not explicitly accounted for.
Sampling is another major bottleneck. Capturing the spatial heterogeneity of soils, snowpacks, and groundwater requires a lot of measurements that are often logistically or financially prohibitive, especially in remote regions. Many of the newer, more powerful tracers such as noble gases or stable isotopes of trace elements, can only be analyzed by a handful of specialized laboratories. As a result, global coverage remains highly uneven, with key regions such as the Arctic and the global South still under-sampled.
What are some of the major unsolved questions and where is more research needed?
There are several fronts where more research is needed. Source signatures are not static, and methods that explicitly capture their variability in time are still underdeveloped. Embedding tracers within global Earth System Models would, in theory, enable more accurate assessment of hydrological partitioning e.g., how rainfall, snowmelt, and glacier melt are split between sublimation, evapotranspiration, groundwater, and streamflow. These will directly inform more robust climate projections, but this remains technically demanding.
Expanding data coverage in under-sampled regions is critical, and citizen science and low-cost sensors may help. Machine learning is a promising approach for uncovering non-linear relationships and gap-filling sparse datasets, but requires training data that often do not yet exist. Greater interdisciplinary integration, e.g., combining tracers with remote sensing, ecological indicators, and biogeochemical data, could yield a more holistic view of the Critical Zone. Finally, the field would benefit from shared protocols and open data practices to enhance progress.
Editor’s Note: It is the policy of AGU Publications to invite the authors of articles published in Reviews of Geophysics to write a summary for Eos Editors’ Vox.
Citation: Popp, A. L., and H. Beria (2026), Tracing water’s hidden journey through the Earth’s living skin, Eos, 107, https://doi.org/10.1029/2026EO265019. Published on 13 May 2026.
This article does not represent the opinion of AGU, Eos, or any of its affiliates. It is solely the opinion of the author(s).
A wonderful new paper on the huge Tracy Arm landslide and tsunami will have profound but challenging implications for the management of risk in an age of increased tourism and rapid climate change.
The journal Science has published an excellent new paper (Shugar et al. 2026) that examines the extraordinary 10 August 2025 landslide and tsunami at Tracy Arm fjord in Alaska. The paper is open access, so you can read it for yourself (it is very accessible), and there has been a plethora
A wonderful new paper on the huge Tracy Arm landslide and tsunami will have profound but challenging implications for the management of risk in an age of increased tourism and rapid climate change.
The journal Science has published an excellent new paper (Shugar et al. 2026) that examines the extraordinary 10 August 2025 landslide and tsunami at Tracy Arm fjord in Alaska. The paper is open access, so you can read it for yourself (it is very accessible), and there has been a plethora of media coverage (quite rightly).
That large landslides occur in fjords is not a surprise, and that they can generate enormous displacement waves is also not news. We know that landslide occurrence in these environments in general is increasing, and specifically so in Alaska. However, this paper is the most comprehensive and systematic analysis of such an event, and it has shown the remarkable threat that these events can generate. The tsunami created by this landslide had a 481 metre run-up; it is remarkable that there were no fatalities. If a large cruise ship had been in the area, with passengers being ferried ashore on small boats and exploring the shoreline, the consequences would have been catastrophic. It is unsurprising then that cruise companies are now amending their itineraries.
The USGS released the image below of the aftermath of the landslide and tsunami – scale is hard to understand in such images, but the crown of the landslide is over 1,000 metres above the level of the fjord, and the landslide had a subaerial volume of over 63 million cubic metres.
This aerial photo shows the north side of Alaska’s Tracy Arm Fjord in the aftermath of the 2025 landslide and tsunami. The lighter-colored rock is the exposed surface, where the mountainside collapsed and fell into the water. The foot of South Sawyer Glacier is visible at lower right; in decades past, the ice extended much farther and was thick enough to hold the rock slopes in place. Credit: Cyrus Read/U.S. Geological Survey
Shugar et al. (2026) has a brief section that examines the implications of this event, and of the understanding that it provides of the hazards posed by very large landslides in fjord settings. These are locations with extensive human activity – local communities, trade, fishing and tourism. There is some evidence that these landsldies are more likely to occur in the spring and summer months, when human occupation is higher. Our resilience to a tsunami wave that starts off being hundreds of metres high is low.
A case in point lies in Milford Sound in New Zealand, where (for example) an earthquake on the Alpine Fault has the potential to trigger a large landslide that could result in a major tsunami. Milford Sound is an extremely popular tourism location. Should such an event occur, and mass fatalities result, there is no doubt that the public inquiry would find that the societal risk was known and that it was probably unacceptable. However, to ban tourism, including cruise ships, in this area would carry heavy risks in its own right – it would profoundly impact the vital tourist economy of the area, on which many livelihoods depend. This is a substantial risk in its own right, and of course politics plays a major part too. Balancing these risks is a major challenge for any society.
Some hope is offered by the fact that this landslide showed substantial precursory seismic activity, which might represent a route to providing a warning for at least some of these rock slope failures. But research in this area is immature at the moment, and of course there will be no warning for a landslide triggered by a major earthquake.
So, the landslide at Tracy Arm fjord presents us with a host of major challenges, but it also represents a big step forward in our understanding of these events. Well done to Dan and his colleagues for another brilliant paper. I shall watch the debate with great interest.
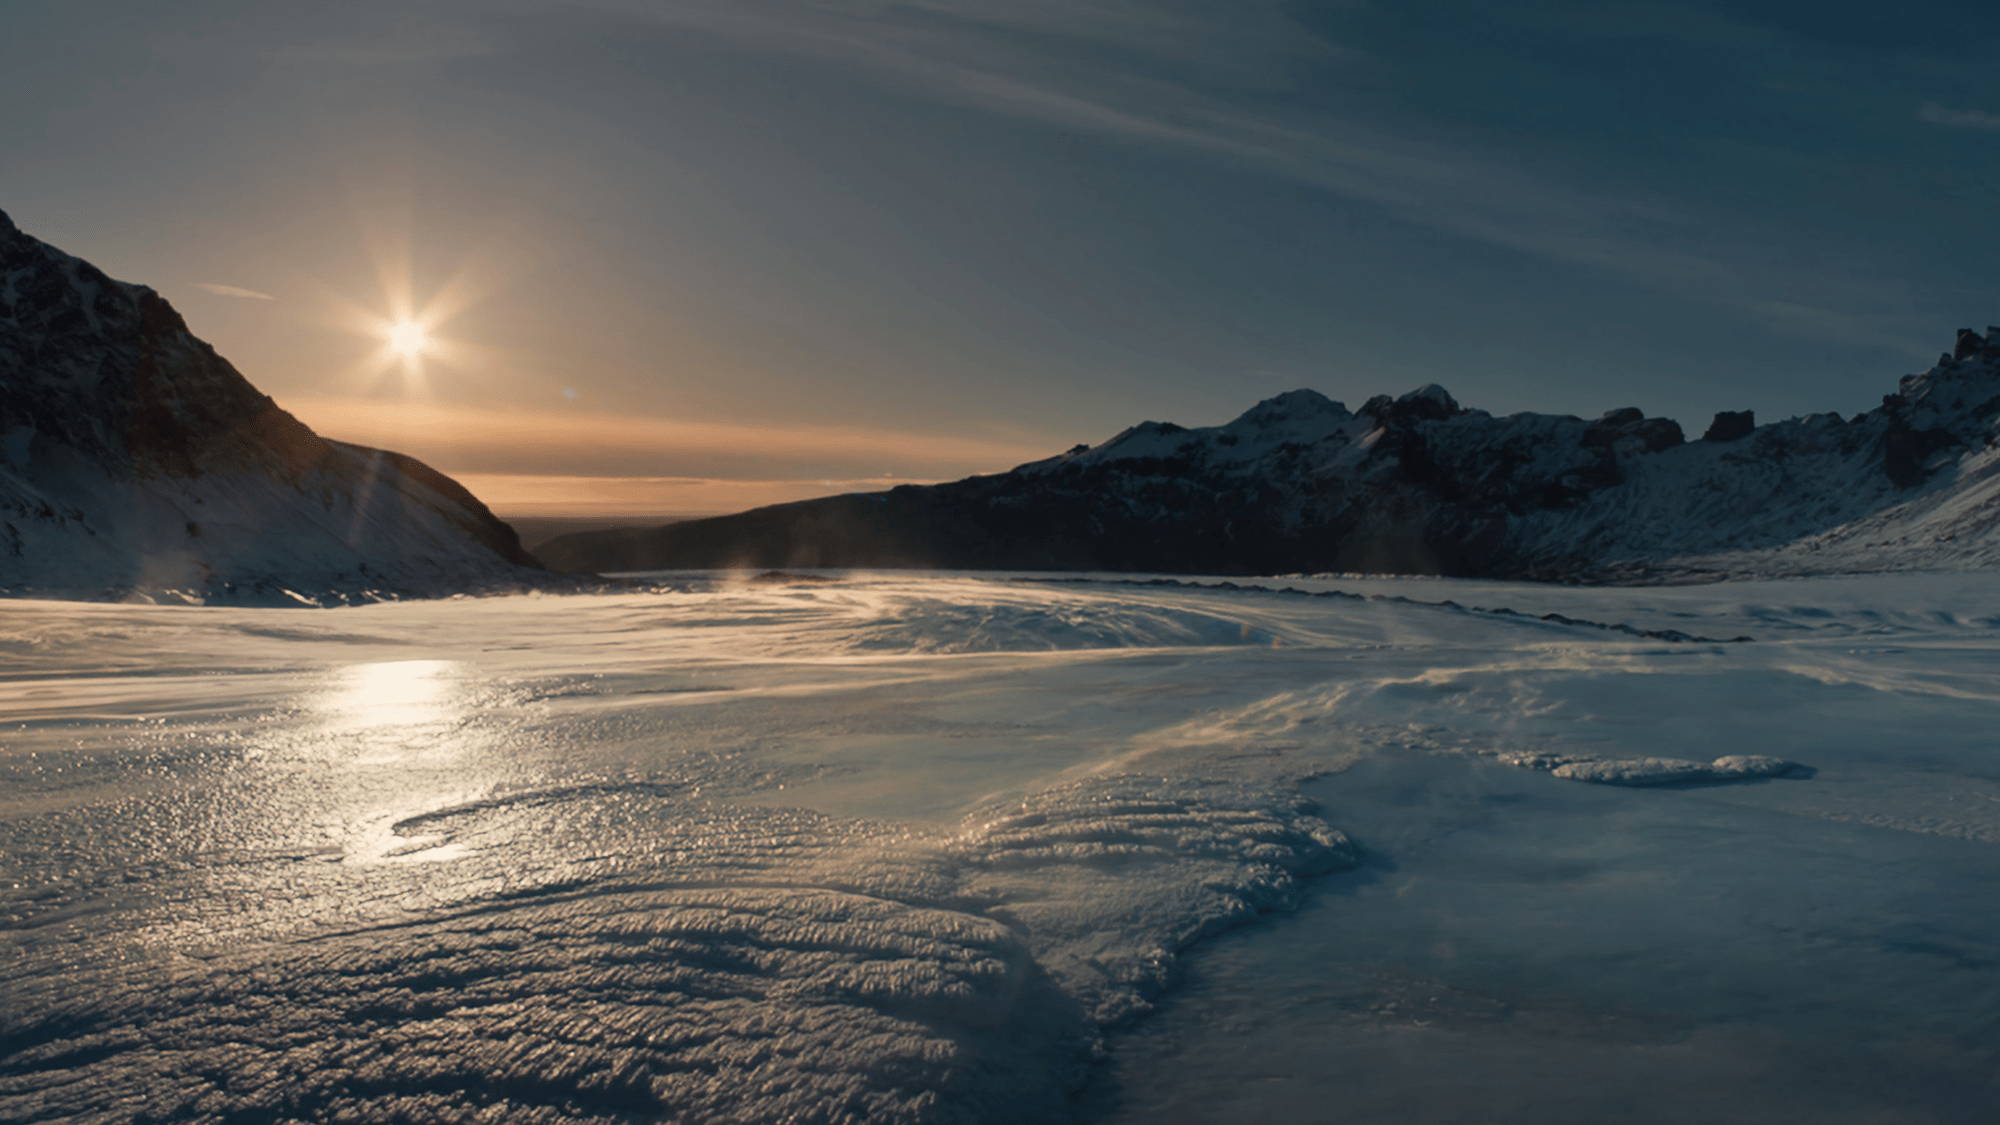
What happens when your homeland begins to melt? Icelandic poet and author Andri Snær Magnason explores this in Time and Water, a new documentary from National Geographic. Directed by Sara Dosa, archival and family photographs and folktales weave personal history with the story of the land in the face of climate change.
“In a time when the violence of the climate crisis ravages the earth, we need stories that can act as maps for our shifting world,” Dosa says in her director’s statement. “Time
What happens when your homeland begins to melt? Icelandic poet and author Andri Snær Magnason explores this in Time and Water, a new documentary from National Geographic. Directed by Sara Dosa, archival and family photographs and folktales weave personal history with the story of the land in the face of climate change.
“In a time when the violence of the climate crisis ravages the earth, we need stories that can act as maps for our shifting world,” Dosa says in her director’s statement. “Time and Water is a gesture toward such a map, one that traces the ice of Iceland through the human story of one family, anchored by the first-person perspective and expansive archives of celebrated writer Andri Snaer Magnason.”
Images from the documentary are in the gallery below. (Click to expand images to full screen.)
A silhouetted person stands beneath the vaulted ceiling of a glacial cave in Iceland. Image: Archival Materials Courtesy of Andri Snær Magnason. Icelandic Glaciological Society member, Árni Kjartansson, sits overlooking a glacier in Iceland. Image: Archival Materials Courtesy of Andri Snær Magnason. Women walk in skis on glacier. Image: Archival Materials Courtesy of Andri Snær Magnason. An ice cave in Iceland. Image: National Geographic.
The story of Andri’s grandparents is woven together with the glaciers and oceans that has sustained generations of Icelanders.
“As Andri’s grandfather Arni’s memory recedes, so too does Iceland’s ice. A story of the earth, which has been frozen for millennia inside glaciers, is rapidly melting away,” says Dosa. “But, through the framing of our film as a time capsule, which is also a nod to Andri’s work as a poet and sci-fi author, we illustrate how the transmission of stories and memories into the future can be an act of not just holding onto our beloved present world, but a way of dreaming up possibilities for a habitable future.”
A glacial tongue behind a waterfall. Image: National Geographic. Glacial tongue descends into glacial lagoon. Image: National Geographic. Melting arc made of glacial ice. Image: National Geographic. Glacial ice formations. Image: National Geographic. Strong winds lift snow off a glacial cap on a sunny day. Image: National Geographic. Birdcliff in western Iceland. Image: National Geographic.
Time and Water opens in select theaters May 29 and later this year on National Geographic & Disney+.
Source: Earth’s Future
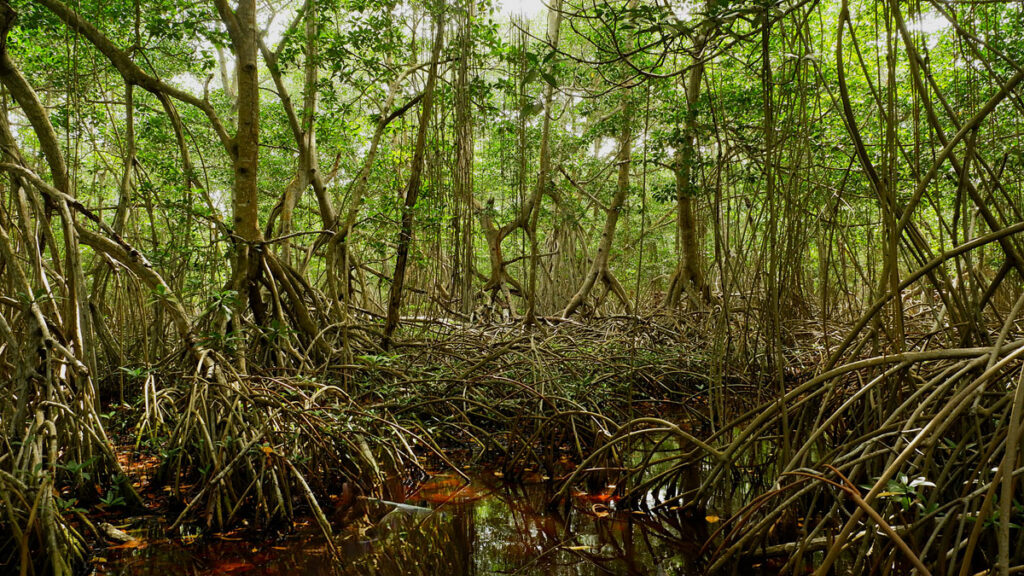
Mangrove forests straddle the edge of land and sea along some tropical and subtropical coastlines. These trees and shrubs have distinctive tangles of roots that trap sediment and produce organic matter, forming dense soils and efficiently storing carbon. Though mangroves cover only 1% of Earth’s surface, they store a whopping 15% of global ocean carbon in their trapped soils.
Their location along coastlines means mangroves are at the mercy of changing sea levels and
Mangrove forests straddle the edge of land and sea along some tropical and subtropical coastlines. These trees and shrubs have distinctive tangles of roots that trap sediment and produce organic matter, forming dense soils and efficiently storing carbon. Though mangroves cover only 1% of Earth’s surface, they store a whopping 15% of global ocean carbon in their trapped soils.
Their location along coastlines means mangroves are at the mercy of changing sea levels and sediment availability. Rising sea levels can drown mangroves or push them landward. At the same time, sediment supplies, belowground root growth, and organic matter accumulation can help build up mangrove soils, allowing forests to keep pace with sea level rise. So over time, will mangroves keep locking carbon into their soils, or will they start losing it?
Iwantoro et al. created a new model that examines the links between coastal processes to investigate vegetation growth and carbon accumulation in mangrove forests.
The researchers modeled a simplified tidal embayment to explore how different rates of sea level rise and sediment supplies would affect the mangroves. In these experiments, they found that carbon accumulation can increase at specific locations as waters rise because the increased water can lead to more mangrove growth—a result that matches existing data. However, when looking at landscape scales, they found sea level rise generally reduces total carbon sequestration through mangrove loss and soil erosion. The results showed that rising sea levels can alter mangroves from carbon storage sinks to carbon emitters.
The findings demonstrate that local trends in carbon sequestration may not be representative of larger-scale outcomes in mangrove forests. The study shows that understanding coastal landscapes as an interconnected system is crucial to understanding how mangroves can respond to climate and human-induced pressures, the researchers say. However, new assessments and approaches are needed to better understand future mangrove vulnerabilities. (Earth’s Future, https://doi.org/10.1029/2025EF006984, 2026)
Citation: Derouin, S. (2026), Mangroves may be losing their grip on carbon storage as sea levels rise, Eos, 107, https://doi.org/10.1029/2026EO260144. Published on 5 June 2026.
SINGAPORE: Singapore’s hot and humid weather has been growing on a lot of locals, and people are now thinking of possibilities to get away with this type of climate—moving into a new country.
On Reddit, a netizen shared that his/her concern is not only due to the current El Niño season but also due to the unbearable Singapore heat all year round. With this, he/she admitted to having friends who migrated to Singapore because they could not stand the weather, and those who want to experience the f
SINGAPORE: Singapore’s hot and humid weather has been growing on a lot of locals, and people are now thinking of possibilities to get away with this type of climate—moving into a new country.
On Reddit, a netizen shared that his/her concern is not only due to the current El Niño season but also due to the unbearable Singapore heat all year round. With this, he/she admitted to having friends who migrated to Singapore because they could not stand the weather, and those who want to experience the full four seasons in a country.
“Personally, my kids and I are OK with the SG weather for now, but the unbearable heat recently made me think long term,” the netizen claimed.
Many netizens shared their thoughts and opinions on this subject matter. Some people declared that people only have one life, and everyone should be doing what makes their hearts happy.
“Don’t take advice from people who have different preferences (like heat lol) and priorities in life as you,” one comment said.
“I even moved to a country warmer than Singapore. Do whatever you want, as long as your jobs, visas, and lifestyles match the country you move to,” another netizen stated.
One comment shared as well the consequences of living in a country with four seasons, especially during the winter season. The netizen said: “It’s a chore living during winter because of the blizzards and when you want to go to work or even to buy groceries, you gotta shovel the ice off your vehicle first and also heating costs. That’s the extreme that you’ll encounter when you stay somewhere that has a winter season.” The netizen added that sometimes, this season can be depressing and people should really have to invest a lot to beat the cold.
Others consider the weather to be the least factor that they consider when moving to another country. “If I ever move overseas, it probably won’t be because of the heat ngl… But having seasons really does make the years more interesting and enjoyable,” a comment concluded.
In the end, staying or leaving Singapore depends on what makes each person happy. There is no right answer for everyone, as long as they find a place that fits their life.
Source: AGU Advances
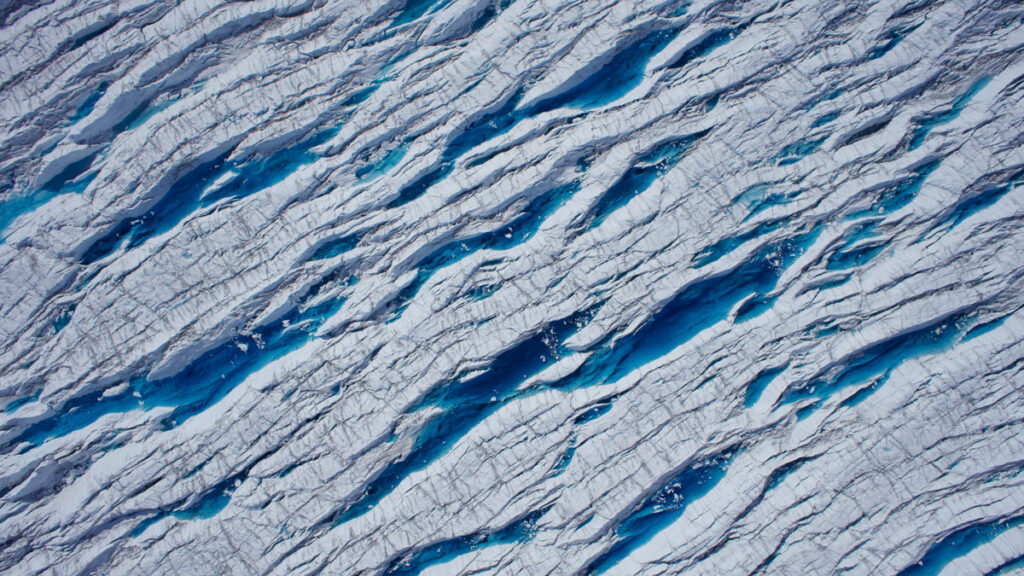
As meltwater drains through and beneath a glacier, it can alter how the ice flows and whether it breaks apart. Meltwater can also cause feedbacks that lead to more ice loss. Understanding when and how glacial meltwater drains is therefore critical to predicting how fast glaciers will lose ice and how that loss will affect sea level.
Chudley et al. modeled how the rate of water flowing into a glacier relates to seasonal changes in the forces that squeeze and stretch ic
As meltwater drains through and beneath a glacier, it can alter how the ice flows and whether it breaks apart. Meltwater can also cause feedbacks that lead to more ice loss. Understanding when and how glacial meltwater drains is therefore critical to predicting how fast glaciers will lose ice and how that loss will affect sea level.
Chudleyet al. modeled how the rate of water flowing into a glacier relates to seasonal changes in the forces that squeeze and stretch ice—forces caused by gravity pulling the glacier downhill, by the ice sliding over subglacial water, and by how portions of the ice interact with the ocean.
The researchers focused on the Sermeq Kujalleq glacier (also known as Store Gletsjer or Store Glacier) in Greenland. In spring, meltwater can fill cracks, or crevasses, that run through the surface of this glacier. These crevasses sometimes go on to drain as the year progresses.
The researchers used satellite imagery from the Sentinel-2 mission to see how much water was present in crevasses between 2016 and 2022, focusing especially on 2019, when the Sentinel-2 satellites provided the best coverage of the glacier. They fed those data into a convolutional neural network to map water cover through the season and looked for a relationship between the mechanical forces acting on the ice and the formation and drainage of crevasse ponds.
The researchers found that the mechanical forces acting on ice are the dominant factor in determining when crevasse meltwater drains into a glacier. When seasonal changes cause ice to stretch, crevasses can drain suddenly, releasing the water they held.
The Greenland Ice Sheet sheds trillions of gallons of water each year, and knowing when to expect that water to drain through the ice sheet is key to understanding processes such as how the glacier slides across the bed and when meltwater emerges in the ocean. The study’s results likely also shed light on dynamic processes in other glaciers and ice sheets, the authors say, and should help inform representations of ice behavior in numerical models. (AGU Advances, https://doi.org/10.1029/2025AV002150, 2026)
Citation: Sidik, S. M. (2026), Stretching and squeezing release glacial meltwater, Eos, 107, https://doi.org/10.1029/2026EO260152. Published on 26 May 2026.