Want updates from a trusted source about climate change’s impacts on oceans? Preference Eos in your searches!
Go to Google
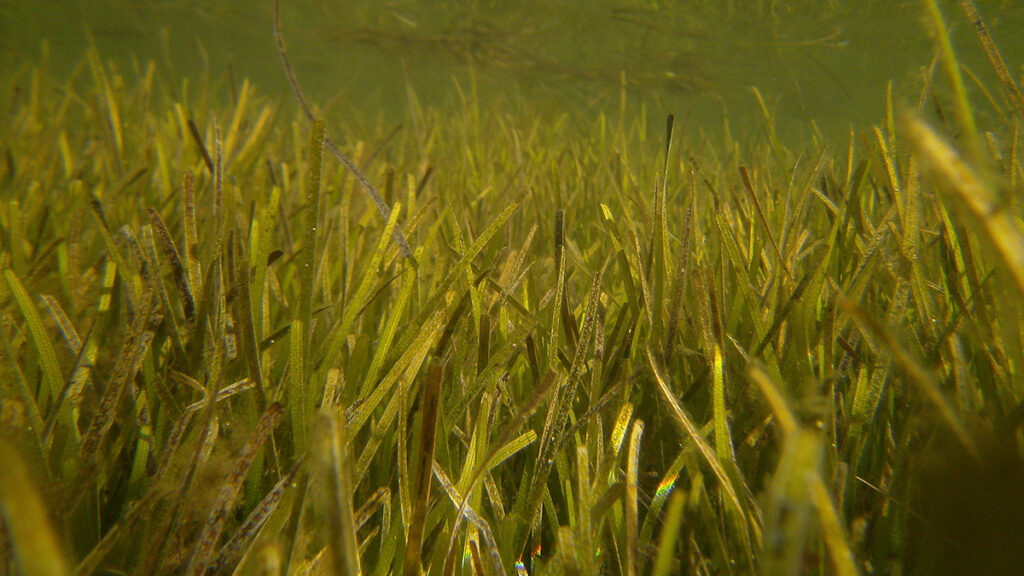
Renske Jongen, an ecologist at the University of Sydney, calls seagrass ecosystems the “tropical rainforests” of the ocean. These underwater flowering plants offer habitats to marine life, protect coastlines from damage, and, like rainforests, store enormous amounts of carbon.
They’re also under threat from pollution, development, and warming ocean waters, whic
Renske Jongen, an ecologist at the University of Sydney, calls seagrass ecosystems the “tropical rainforests” of the ocean. These underwater flowering plants offer habitats to marine life, protect coastlines from damage, and, like rainforests, store enormous amounts of carbon.
They’re also under threat from pollution, development, and warming ocean waters, which stress plants and slow growth rates. Seagrass populations have been declining globally for nearly a century, and recent estimates suggest 7% of seagrasses are lost worldwide each year.
A new study published in New Phytologist shows that warming waters may affect a microscopic aspect of the seagrass ecosystem, too: the microbes that live in their sediments. The new insight can inform efforts to restore seagrasses, the authors write.
Seagrasses are “getting attacked from both sides,” said Jongen, the lead author of the new study. Warming water stresses the plants themselves, while “something changes in the sediment that makes them grow worse.”
Sediments and Seagrass
The research team transplanted seagrasses from elsewhere in Lake Macquarie to a preexisting, artificially warmed area to run their experiment. Credit: Renske Jongen
To test how microbial communities affect seagrass growth under warming temperatures, Jongen and the research team transplanted seagrasses and their sediment from both warm and cool areas of Lake Macquarie, a coastal saltwater lake in New South Wales, Australia, into an artificially warmed part of the lake. The artificially warmed part of the lake has received intermittent plumes of heated water from a nearby power plant since 1984, leading to a consistent temperature increase of 1°C–3°C (1.8°F–5.7°F) compared with the rest of the lake.
For half of the seagrasses, the team also used an autoclave, an instrument that uses steam to sterilize materials, to kill most of the microbes in their associated sediment before transplanting them to the experimental garden. “By looking at how plants respond with and without their microbes, you can get an idea for whether [those microbes] help or harm the plant under certain environments,” Jongen said.
The plants were then left to grow for 28 days before the team measured how they’d fared.
The warm-origin seagrasses in their original, warm-origin sediments with microbes intact grew the slowest once they were in the artificially heated waters, producing 35% less aboveground biomass than their counterparts whose sediment microbial communities had been killed. That result suggests that the microbial community in warmed sediment contributes to seagrass stress, the authors wrote.
“These plants, in general, do not like sediments that have been exposed to warmer temperatures.”
“These plants, in general, do not like sediments that have been exposed to warmer temperatures,” Jongen said. She was surprised that the plants that came from the warm areas had the worst outcomes but hypothesizes that perhaps these plants were already too stressed from warm waters to deal with the changes to sediment bacterial communities that occurred after they were transplanted into the even warmer part of the lake.
“It’s just like us, for example: When we don’t sleep or we’ve had a stressful week, then we get sick more easily,” she said.
Jongen said more research is needed to say for sure why warmed sediment seems to change microbial communities in a way that harms seagrasses. But research has shown that some microbes in ocean sediment produce sulfide, which can be toxic to seagrasses if it accumulates, especially if those seagrasses are already stressed. Warmer conditions may allow these sulfide-producing microbes to grow more quickly, harming the plants.
The new research highlights the “context dependency of host-microbe interactions,” said Karolina Zabinski, a marine ecologist at the University of California, Davis, who was not involved in the new study. Previous research by Zabinski and others also showed that seagrass growth depends on their associated sediment microbiome.
Restoration Lessons
The new study “serves as a great springboard” for both academics seeking to understand seagrass-microbe interactions and practitioners working on seagrass restoration in the field, Zabinski said.
For academic researchers, the paper raises exciting questions about how the microbial communities present in the sediment actually function, she said. Though the study identified the types of microbes in the seagrasses’ sediments, it didn’t evaluate the abilities of those microbes, which genes they possess or express, or how those microbes interacted with each other. “What are their actual genes, and what are they doing?” Zabinski asked.
“When plants don’t do well, we can’t just assume it’s inherent to the plants—we have to remember it could be driven by the microbes that they’re interacting with.”
For seagrass restoration practitioners, the study could offer new methods to try to improve restoration success. Some projects, for example, aim to take plants from warmer environments and transplant them to seagrass ecosystems that will face warming stress in the future as the climate changes. “It seems pretty intuitive that maybe those plants will have the traits or the genetics to respond to that warming,” said Randall Hughes, a marine ecologist at Northeastern University in Boston who was not involved in the new study. But the study’s results highlight “that intuition is not always reliable.”
“Certainly, having experimental studies like this helps us think about those restoration efforts in a more informed way,” she said. “When plants don’t do well, we can’t just assume it’s inherent to the plants—we have to remember it could be driven by the microbes that they’re interacting with.”
Jongen hopes to continue studying related questions about how seagrasses respond to warming waters. In particular, she’d like to investigate how long changes to the sediment microbial community last and whether those changes reverse once a marine heat wave subsides.
The research team collected sediments and seagrasses from different sites within Lake Macquarie before transplanting the plants into an artificially warmed area of the lake. Credit: Renske Jongen
Ultimately, the answers to these questions will help scientists better predict where seagrasses are in danger and how they might be helped. “If we lose the seagrasses, we don’t only lose the seagrasses, we lose all the other benefits that they provide,” Jongen said. “I think they deserve a little bit more attention.”
Citation: van Deelen, G. (2026), Warm waters disrupt seagrasses’ microbial environment, Eos, 107, https://doi.org/10.1029/2026EO260166. Published on 22 May 2026.
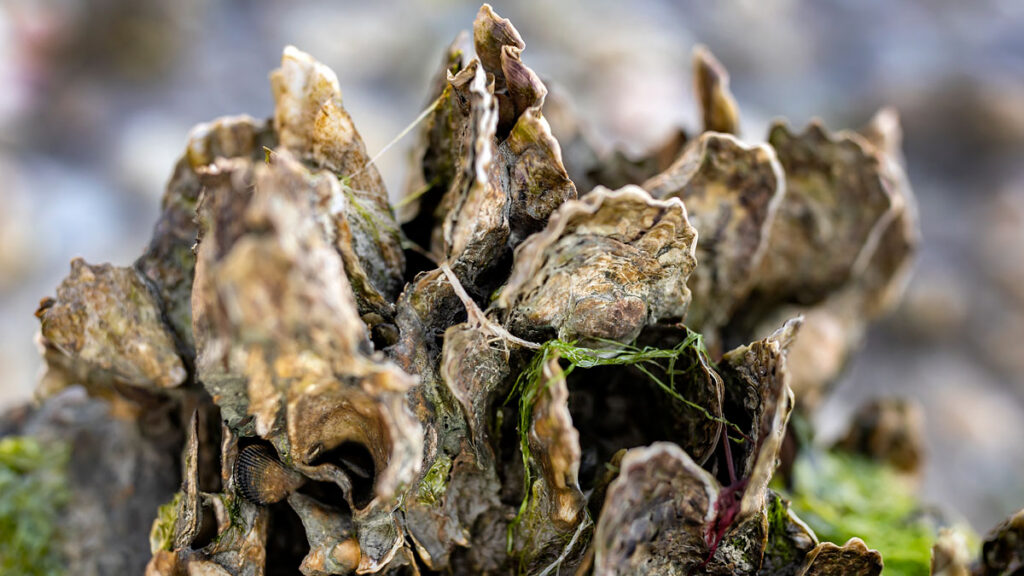
After centuries of overharvesting and environmental degradation reduced the world’s oyster reefs by 85%, restoration is bringing the conglomerations of thick-shelled mollusks back to coastal waters. And their return may have more benefits than scientists realized, new research suggests.
“Oysters build the foundation of an entire ecosystem.”
Oysters were initially restored to boost depleted fisheries, according to Rachel Smith, a marine ecologist at the University of California, Santa Barb
After centuries of overharvesting and environmental degradation reduced the world’s oyster reefs by 85%, restoration is bringing the conglomerations of thick-shelled mollusks back to coastal waters. And their return may have more benefits than scientists realized, new research suggests.
“Oysters build the foundation of an entire ecosystem.”
Oysters were initially restored to boost depleted fisheries, according to Rachel Smith, a marine ecologist at the University of California, Santa Barbara. As oysters cement their shells together into reefs, they create habitats for myriad species, including fish. “Oysters build the foundation of an entire ecosystem,” Smith said.
These days, oyster reefs are restored for reasons extending beyond ecology, including to rid coastal water of excess nutrients such as nitrogen. This pollutant enters coastal waters when wastewater, sewage, and fertilizer wash into the sea.
Past studies of nitrogen removed by oyster reefs largely looked at denitrification, a process in which microbes transform organic nitrogen in dead oysters and their excrement into inert gas. If organic nitrogen evades these microbes, it can be buried in reefs, but measurements of this mechanism are few.
Researchers collected cores from 20 oyster reefs in coastal North Carolina. Credit: Antonio Rodriguez/Institute of Marine Sciences, UNC-Chapel Hill
“[Burial] is definitely much less explored,” said Smith.
A study published in PLoS One looked beyond denitrification and found significant amounts of nitrogen become sequestered within oyster reefs as they grow, offering evidence that restored oyster reefs actually remove far more nitrogen than we thought.
Before she started this research, Anne Margaret Smiley, lead author of the new paper and a biogeochemist at the University of North Carolina (UNC) at Chapel Hill, suspected that the amount of nitrogen buried in oyster reefs would be small because organisms at the surface transform so much of it, leaving little left to bury. She was pleasantly surprised by the results.
“We’ve been looking at denitrification all this time, and now we found out that [oysters themselves] are really good at doing this too,” she said. “What an amazing thing to know.”
In Search of Buried Nitrogen
To explore how nitrogen is buried over time, scientists turned to 20 oyster reefs in the Rachel Carson National Estuarine Research Reserve near Beaufort, N.C., that were restored nearly 3 decades ago by UNC scientists.
Using a jackhammer and metal pipe, they extracted cores from the oyster reefs in 2011. About 10 centimeters in diameter, the cores sampled the full thickness of each reef, which ranged from 10 to 55 centimeters. Shortly after they were collected, the cores were sectioned off into 5-centimeter increments, sealed, and stored in a walk-in freezer. In the years since, the samples have proved useful for studying oyster reef growth during sea level rise and how much carbon the reefs sequester and in other areas of research. Recently, Smiley measured the nitrogen levels in each of these 5-centimeter sections.
Below the top 10 centimeters or so, where microbes break down organic matter, nitrogen levels increased. Looking at all samples, Smiley found that on average, a square meter of reef buried more than 6 grams of nitrogen each year, which is similar to the rate of nitrogen transformed by denitrification at oyster reefs.
“The more they can build up and out, the more [nitrogen] they can bury underneath.”
However, there was a large range in the amount of nitrogen buried, between 1 and 15 grams of nitrogen per square meter. The variability, the researchers found, was related to where the different oyster reefs grew.
For oyster reefs in sand flats, those in intertidal areas (between high and low tide on a shore) buried more than twice as much nitrogen as subtidal reefs, on average. Intertidal reefs grow faster and so bury more nitrogen. “The more they can build up and out, the more [nitrogen] they can bury underneath,” said Smiley.
But intertidal reefs that fringed the edge of salt marshes buried less nitrogen than other intertidal reefs. “They’re not able to grow as quickly,” she said, speculating that sediment from the neighboring marshes may slow reef growth.
Put Your Money Where Your Mollusk Is
Intertidal oyster reefs, like this one in coastal North Carolina, are exposed above water at low tide. Credit: Johanna Rosman/Institute of Marine Sciences, UNC-Chapel Hill
North Carolina’s Department of Environmental Quality places the economic value of each kilogram of nitrogen removed from the environment at $26.39 (in 2024 dollars, which is about $28.50 in 2026). Using this figure, Smiley and her colleagues calculated that nitrogen removed from coastal waters and buried each year by a hectare of oyster reef has a value of $1,700 on average. This finding increases previous estimates of the value of oysters’ nitrogen removal services by 25% to 42%.
“A really valuable part of the study is not just taking those measurements, but then also translating that into valuation,” said Smith, who was not involved with the new study. The value of nitrogen burial can be added to oyster reef ecosystem services—the monetary value of benefits that humans gain from oyster reefs, such as clean water, food, and flood control. “[Buried nitrogen] is definitely an ecosystem service that I think is underappreciated,” she said.
Looking more broadly at the county that is home to the Rachel Carson Reserve, Smiley and her colleagues found that all the oyster reefs countywide bury about 120,000 kilograms of nitrogen each year—more than $3 million of value in the county’s shallow sounds and bays.
Citation: Gardiner, L. S. (2026), Oysters clean up more nitrogen pollution than we thought, Eos, 107, https://doi.org/10.1029/2026EO260182. Published on 4 June 2026.
Thirty years ago, the blockbuster movie Twister featured a group of academics putting themselves at risk by chasing tornadoes in the name of science. Although the Hollywood story entailed a surfeit of sensationalism, special effects, and unrealistic stereotypes, the movie got a few things right. Specifically, the scientists were trying to study tornadoes using a large number of spatially distributed, home-built, low-cost (and potentially sacrificial) sensors.
Today, we commonly refer to the
Thirty years ago, the blockbuster movie Twister featured a group of academics putting themselves at risk by chasing tornadoes in the name of science. Although the Hollywood story entailed a surfeit of sensationalism, special effects, and unrealistic stereotypes, the movie got a few things right. Specifically, the scientists were trying to study tornadoes using a large number of spatially distributed, home-built, low-cost (and potentially sacrificial) sensors.
Today, we commonly refer to the coordinated use of tens to hundreds of similar sensors that are spread out as “large-N” sensing. Such sensor distributions have led to important advances in seismology and infrasound science, where they have improved our understanding of seismic ground motion and helped shed light on volcanic eruption dynamics [e.g., Rosenblatt et al., 2022; Anderson et al., 2023].
The benefits of large-N networks and arrays include robust spatial sampling and signal extraction from noise. They are also advantageous for detecting small signals, sensing natural hazards in remote environments, and offering critical redundancies for sensors at risk from lava or debris flows, wildfire, weather, or even malicious mammals.
Since 2013, our research group in the Department of Geosciences at Boise State University (BSU) has worked to study infrasound from geophysical phenomena by capitalizing on the benefits of low-cost, large-N sensing technology [e.g., Slad and Merchant, 2021]. More than a decade on, this effort has yielded scientific successes from a variety of environments, and it is continuing to evolve.
Large-N Sensing for Infrasound
Many violent natural processes, including landslides, volcanic eruptions, earthquakes, avalanches, and meteors, produce infrasound.
Many violent natural processes, including landslides, volcanic eruptions, earthquakes, avalanches, and meteors, produce infrasound, defined as low-frequency sound below the threshold of human hearing (less than 20 Hertz). Such events may create audible sound as well, but the subaudible band is often much more energetic in terms of sound intensity, and it has long wavelengths that can propagate long distances with little attenuation. These characteristics make infrasound especially valuable for remote sensing of natural phenomena.
Our group at BSU grew more interested in developing our own inexpensive infrasound sensing solutions after costing out technology for commercial data logging systems, the compact electronic devices that record and store sensor data. These systems can be far more expensive than infrasound transducers—the sensors that actually detect sound—themselves.
The cost element became particularly relevant after we lost instrumentation deployed at the summit of Chile’s Villarrica volcano when it erupted a 2-kilometer-tall lava fountain on 3 March 2015 [Johnson et al., 2018]. In an instant, our hardware, including seismic and infrasonic sensors and their commercial multichannel data loggers, was entombed beneath falling lava. This financial loss incentivized our work to develop low-cost loggers that would match the technical specifications and fidelity of commercial systems.
The result was the customized Gem infrasound logger, which we created using the widely available and very economical Arduino open-source electronic prototyping platform and its low–power consumption microcontroller. The Gem is an all-in-one infrasound sensor and data logger with a high dynamic range (millipascals to 100 pascals), a 100-hertz sample rate appropriate for infrasound, and a built-in GPS for precise timing and synchronization [Anderson et al., 2018].
Although we initially conceived of the Gem as an alternative to commercial loggers to be deployed as single stations or in small arrays, we quickly realized its potential for use in high-density distributed sensing arrays that enabled new detection capabilities. In particular, its small package size (it has about the dimensions and weight of a paperback novel) and its ease of deployment—simply insert alkaline batteries, place it on the ground, and turn it on—have opened opportunities for rapid, large-N deployments in difficult-to-access environments.
Early Successes for the Gem
Volcán Villarrica, near Pucon, Chile, is seen in 2025 (left). The volcano regularly releases gas from a small lava lake recessed deep within the summit crater (right). Credit: Jeffrey B. Johnson
The Gem’s inaugural field mission came in January 2020 during a return to Villarrica, where activity had returned to normal following its 2015 paroxysmal eruption [Rosenblatt et al., 2022]. Typical activity in the volcano’s normal state includes open-vent degassing from a small lava lake recessed deep within the summit crater, which produces its famously powerful volcano infrasound [e.g., Johnson et al., 2012].
To capture Villarrica’s infrasound in detail, a four-person team from BSU climbed the 3,000-meter-tall glaciated volcano and quickly installed 16 sensors around the crater rim, as well as another 16 sensors along an 8-kilometer linear transect from the summit down the northern slope (Figure 1). This unique sensor distribution permitted us to capture the infrasound wavefield and how it interacts with topography in unprecedented detail.
Fig. 1. (a) Oblique and (b) plan views of Villarica’s summit region were created from structure-from-motion surveys in 2020. Red triangles and circles indicate locations of Gem sensing packages. (c) Also in 2020, Jake Anderson adjusts a cable suspended across the volcano’s crater that held a Gem sensor (circled). (d) In 2025, Jerry Mock unloads Gem systems at Villarica’s summit during another data collection campaign there. Click image for larger version. Credit: Jeffrey B. Johnson
Deploying such an array configuration using much heavier, larger, and power-intensive conventional instruments would have taken far more time and resources, as well as a bigger group. With the Gems, however, the installation was feasible for our small team, each member of which could easily carry eight instruments and the batteries needed to power them.
To monitor volcanoes with infrasound, it is necessary to understand the influence of atmospheric effects.
Once in place, these sensors collected continuous data during the 2-week study that were used to quantify the diffraction of sound coming out of the volcanic crater [Rosenblatt et al., 2022] and to measure the sound’s attenuation as it propagated away. Such studies are important for investigating time-varying atmospheric parameters such as changing temperatures and winds, which can affect infrasound transmission, diminishing its amplitude or even—in extreme cases—completely silencing it in an acoustic shadow zone [Johnson et al., 2012]. To monitor volcanoes with infrasound, it is necessary to understand the influence of atmospheric effects.
Months later, another opportunity arose to demonstrate the Gems’ capability for large-N infrasound sensing. During the early days of the COVID-19 pandemic, on 31 March 2020, a magnitude 6.5 earthquake occurred near Stanley, Idaho. The earthquake, the largest in the state since 1983, kicked off an energetic aftershock sequence, with more than 700 magnitude 3 or greater earthquakes occurring in 6 months. Most of these events produced significant local infrasound radiation, or “airquakes,” caused by ground-atmosphere coupling [e.g., Johnson et al., 2020].
Pandemic-related precautions inhibited a large team from venturing as a group into the field. However, a lone BSU researcher (coauthor Jacob Anderson), trudging through forest terrain and deep snow on skis, was able to deploy and activate 22 Gems in less than 4 hours in early April, thanks in part to the sensors’ compact size and ease of deployment.
This array captured hundreds of local infrasonic aftershocks within about 25 kilometers of their epicenters. It also recorded a far larger event 700 kilometers away, the 15 May magnitude 6.5 Monte Cristo earthquake in Nevada. The array detected the epicentral infrasound from the distant earthquake source, as well as infrasound from numerous secondary sources, including mountain ranges throughout the western United States that reradiated the ground motion as infrasound (Figure 2) [Anderson et al., 2023].
Fig. 2. This map shows source region(s) of infrasound associated with the May 2020 Monte Cristo earthquake in Nevada that was detected by an array of Gem infrasound sensors deployed at the PARK site near Stanley, Idaho. Click image for larger version. Credit: Adapted from Anderson et al. [2023], CC BY 4.0
Detecting all these distinct signals was possible because of the enhanced array processing capabilities provided by the large number of sensors. Anderson et al. [2023] showed that when the data were processed from 3-sensor subsets of the 20+-sensor array—instead of from the whole array—it was possible to detect only the most intense earthquake infrasound arrivals. In other words, the larger array had much greater fidelity and sensing capabilities than smaller distributions of sensors.
During its 2-month deployment, the Stanley array also detected sounds from other distant nonearthquake sources, including waterfalls 195 kilometers away and thunder more than 900 kilometers away [Scamfer and Anderson, 2023]. Such enhanced detections, facilitated by large-N sensing, demonstrate an improved capacity to monitor a range of Earth phenomena continuously over a wide range of distances.
Putting Sensors in Harm’s Way
Since those proof-of-concept deployments, Gems have been used to monitor snow avalanches, lahars, river flow discharge, stratospheric sounds (while mounted aboard a solar balloon), and numerous volcanoes during field experiments [e.g., Tatum et al., 2023; Bosa et al., 2024; Rosenblatt et al., 2022; Brissaud et al., 2021]. Given their ease of use, small size, and low replacement cost, they’ve also been tested in hazardous environments where the risk to more expensive hardware could be considered unreasonable.
The motivation to put sensors in harm’s way is to gain insight into geophysical phenomena by recording subtle signals close to the source that may not be detectable from farther away.
The motivation to put sensors in harm’s way is to gain insight into geophysical phenomena by recording subtle signals close to the source that may not be detectable from farther away. For example, at Villarrica, Rosenblatt et al. [2022] suspended a Gem on a cable 100 meters above a lava lake to collect infrasound data from a unique, bird’s-eye perspective over the crater (Figure 1c). (Stringing the cable across the crater proved far more challenging than deploying the sensor itself, which slid down the cable until finding its resting place at the bottom of the cable’s arc.)
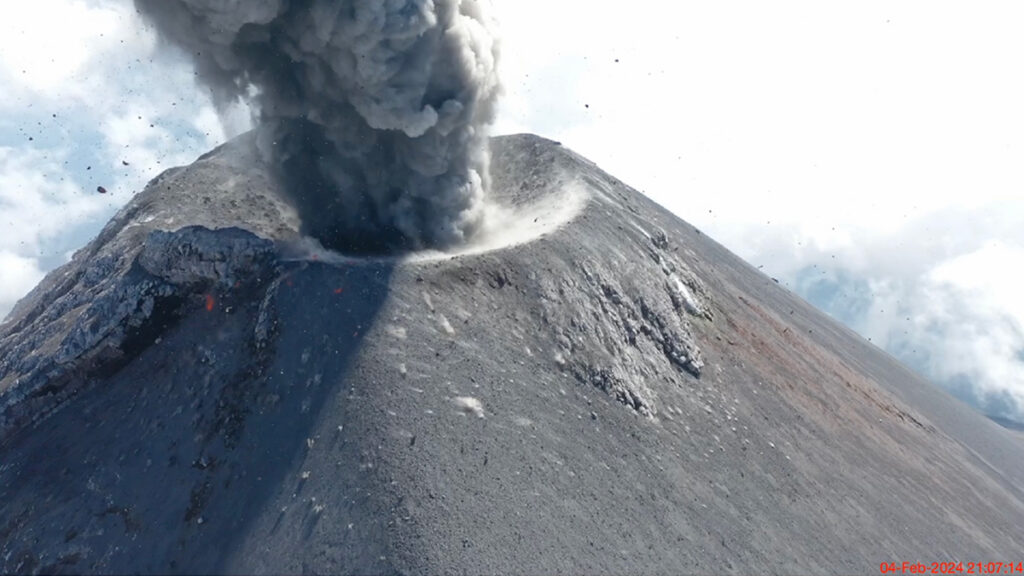
In another case, we landed a pair of Gems on the ground near a frequently exploding crater at Fuego volcano in Guatemala using a drone (see video below). We later retrieved one of the sensors from high on the volcano’s flanks. Another was lost because high winds initially posed too great a risk to fly the drone back for it. Then the following day after the wind subsided, we could not locate the stranded Gem, which was probably a casualty of a nighttime explosion.
Drone footage and infrasound recordings were collected during an explosion of Fuego volcano on 4 February 2024. Pa = pascals. Credit: video: Jerry C. Mock; animation and infrasound: Jeffrey B. Johnson
Our group at BSU also has nascent interest in using Gems to study fire in natural environments. Wildfires produce infrasound from a spatially extensive source region corresponding to actively burning areas. Because of the source complexity and the fact that fire infrasound is low amplitude and tremor-like [Johnson et al., 2025], enhancing signal-to-noise ratios in recorded infrasound is critical. This enhancement is enabled by using large-N monitoring networks, making infrasound wildfire surveillance a promising area of investigation.
Low-cost, rapid infrasound deployments could one day be used as an effective operational tool.
Toward this objective, our group installed 76 sensors ahead of a prescribed burn in Reynolds Creek, Idaho, in October 2023 to begin developing infrasound as a tool for monitoring and mapping wildfire. We have also deployed Gems for infrasound studies of naturally occurring wildfires, such as the Emigrant wildfire in Oregon in August and September 2025 (Figure 3). During that active wildfire response, a team safely and quickly installed tens of sensors within a matter of hours in an area facing dynamic hazards from the rapidly expanding fire, which eventually covered 33,000 acres (about 13,354 hectares). Luckily, no instruments were lost, and the data have shown the potential to track a wildfire as it advances.
Preliminary results suggest that low-cost, rapid infrasound deployments could one day be used as an effective operational tool. For example, in firefighting responses, infrasound might complement intermittent aerial observations, from aircraft or drones, because it provides a continuous record of fire activity. Infrasound surveillance might also be able to “hear” combustion sources within a burn area that is obscured to optical sensing because of clouds or nightfall.
Fig. 3. (a) The spread and severity of the 2025 Emigrant Fire in Oregon, as calculated from prefire (21 August) and postfire (18 October) Sentinel-2 satellite images, are shown. Inset maps show the distribution of 37 Gem sensors rapidly deployed in three arrays. (b) Smoke from the fire rises from the landscape on 31 August during deployment of the sensors. (c) Following the fire, one sensor that had been melted by the fire was recovered with its data card still intact (red circle). dNBR = differenced normalized burn ratio. Click image for larger version. Credit: (a) and (b): Madeline A. Hunt; (c): Jacob F. Anderson
The Evolution of Low-Cost Sensors
Five years ago, the single-sensor Gem was a cutting-edge infrasound logging solution. While it remains a powerful and economical tool for large-N arrays and for sensing in hostile environments, it is evolving.
Boise State University researchers (left to right) Madeline Hunt, Owen Walsh, Jerry Mock, and Jacob Anderson prepare to deploy Gem sensors in Idaho’s Sawtooth Mountains in January 2024. Credit: Jeffrey B. Johnson
We have now developed the Gem into an even more versatile version called the Aspen, which can log four independent sensors at a sample rate of 200 hertz, double that of the Gem. The Aspen retains the small size, low weight, low power consumption, and low cost of the Gem, but with the capability to record higher-resolution 24-bit, time-synchronized data from a triaxial seismic sensor and an infrasound transducer.
Recording synchronous seismoinfrasonic data on the same logging platform offers the advantage of sensing both ground shaking and infrasonic oscillations. The ability to measure waves propagating in the ground and in the air simultaneously could facilitate work in the growing field of environmental seismology, which focuses on geophysical sources at Earth’s surface like debris flows and volcanoes.
Although we have focused on seismoacoustic geophysical measurements in our work, the concept of gathering data with low-cost instrumentation in harm’s way or from coordinated arrays of numerous sensors holds promise across Earth and environmental sciences. Such approaches could be used, for example, with tiltmeters (which measure slope changes), gravity meters, or near-infrared thermometers (e.g., optical pyrometers), all of which would offer additional data streams complementing seismoacoustic observations in geophysical studies of volcanoes.
With the diversity of emerging uses, it’s clear that large-N sensing—infeasible or cost prohibitive in many cases until recently—could transform how we measure many facets of Earth, helping to reveal the inner workings of volatile volcanoes, twisting tornadoes, and more.
Acknowledgments
More information about low-cost infrasound sensing solutions can be found at https://sites.google.com/boisestate.edu/infravolc/home. Development of the Gem infrasound logging platform was supported by a grant from the National Science Foundation (EAR-2122188).
References
Anderson, J. F., et al. (2018), The Gem infrasound logger and custom‐built instrumentation, Seismol. Res. Lett., 89(1), 153–164, https://doi.org/10.1785/0220170067.
Anderson, J. F., et al. (2023), Remotely imaging seismic ground shaking via large-N infrasound beamforming, Commun. Earth Environ., 4(1), 399, https://doi.org/10.1038/s43247-023-01058-z.
Bosa, A. R., et al. (2024), Dynamics of rain-triggered lahars and destructive power inferred from seismo-acoustic arrays and time-lapse camera correlation at Volcán de Fuego, Guatemala, Nat. Hazards, 121, 3,431–3,472, https://doi.org/10.1007/s11069-024-06926-1.
Brissaud, Q., et al. (2021), The first detection of an earthquake from a balloon using its acoustic signature, Geophys. Res. Lett., 48, e2021GL093013, https://doi.org/10.1029/2021GL093013.
Johnson, J. B., et al. (2012), Probing local wind and temperature structure using infrasound from Volcan Villarrica (Chile), J. Geophys. Res., 117, D17107, https://doi.org/10.1029/2012JD017694.
Johnson, J. B., et al. (2018), Forecasting the eruption of an open-vent volcano using resonant infrasound tones, Geophys. Res. Lett., 45, 2,213–2,220, https://doi.org/10.1002/2017GL076506.
Johnson, J. B., et al. (2020), Mapping the sources of proximal earthquake infrasound, Geophys. Res. Lett., 47, e2020GL091421 , https://doi.org/10.1029/2020GL091421.
Rosenblatt, B. B., et al. (2022), Controls on the frequency content of near-source infrasound at open-vent volcanoes: A case study from Volcán Villarrica, Chile, Bull. Volcanol., 84(12), 103, https://doi.org/10.1007/s00445-022-01607-y.
Scamfer, L. T., and J. F. Anderson (2023), Exploring background noise with a large‐N infrasound array: Waterfalls, thunderstorms, and earthquakes, Geophys. Res. Lett., 50, e2023GL104635, https://doi.org/10.1029/2023GL104635.
Slad, G., and B. Merchant (2021), Evaluation of Low Cost Infrasound Sensor Packages, Sandia Rep. SAND2021-13632, Sandia Natl. Lab., Albuquerque, N.M., https://doi.org/10.2172/1829264.
Tatum, T., J. F. Anderson, and T. J. Ronan (2023), Whitewater sound dependence on discharge and wave configuration at an adjustable wave feature, Water Resour. Res., 59, e2023WR034554, https://doi.org/10.1029/2023WR034554.
Author Information
Jeffrey B. Johnson (jeffreybjohnson@boisestate.edu), Jacob F. Anderson, Madeline A. Hunt, Owen A. Walsh, and Jerry C. Mock, Department of Geosciences, Boise State University, Idaho
Citation: Johnson, J. B., J. F. Anderson, M. A. Hunt, O. A. Walsh, and J. C. Mock (2026), Sensing the sounds from Earth’s hazardous environments, Eos, 107, https://doi.org/10.1029/2026EO260142. Published on 8 May 2026.
Off Track, On Purpose
Iceland, Chile, Kenya, Antarctica, Papua New Guinea, and the Great Salt Lake. That ambitious lineup covers (most of) the destinations where scientists featured in our annual fieldwork collection have ventured to test innovative instruments and answer pressing questions about natural processes on—and off—Earth.
Read along to learn about some fascinating field science and to hit all these hot spots and cool destinations for yourself.
In “Discovering Venus on
Iceland, Chile, Kenya, Antarctica, Papua New Guinea, and the Great Salt Lake. That ambitious lineup covers (most of) the destinations where scientists featured in our annual fieldwork collection have ventured to test innovative instruments and answer pressing questions about natural processes on—and off—Earth.
Read along to learn about some fascinating field science and to hit all these hot spots and cool destinations for yourself.
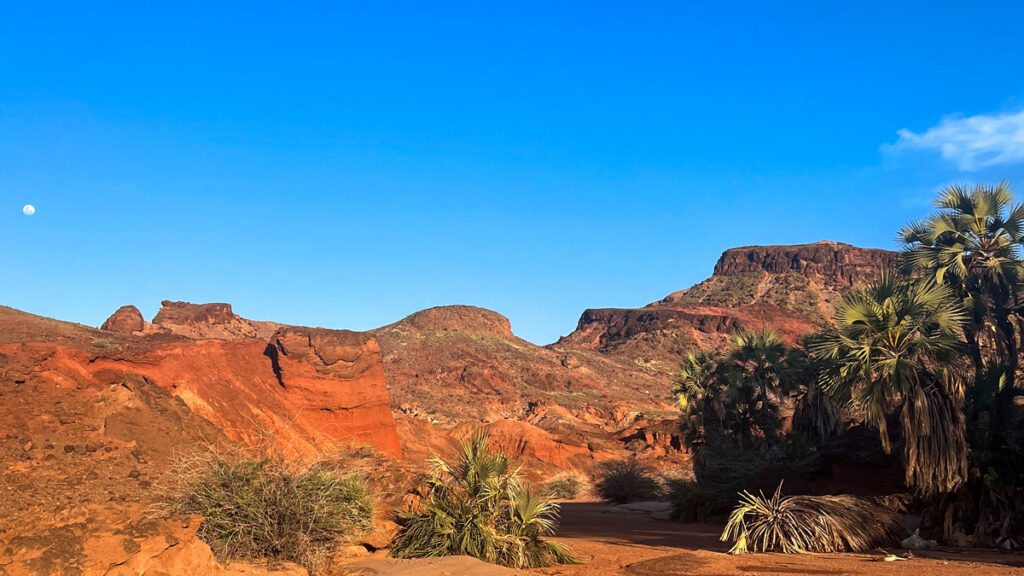
In “Discovering Venus on Iceland,” scientists describe a multiweek effort traversing three rugged and rocky sites to collect samples and validate airborne radar measurements. Iceland’s basaltic lava fields are about the closest analogue to the surface of Venus that Earth has to offer, and the team’s data collection is helping to test the performance of instruments that will be a part of NASA’s VERITAS (Venus Emissivity, Radio Science, InSAR, Topography, and Spectroscopy) mission in several years’ time.
From Iceland, travel west and south to Chile, Guatemala, and Idaho to learn how researchers have been building and using their own inexpensive, lightweight sensors to detect infrasound emanating from volcanoes, earthquakes, and wildfires in “Sensing the Sounds from Earth’s Hazardous Environments.” At Villarica volcano in the Chilean Andes, for example, they have deployed sensor clusters on, around, and even hanging from a cable above the volcano’s summit crater to better understand how infrasound may be useful for eruption monitoring.
Meanwhile, at Lake Turkana in Kenya, scientists have been partnering with local industries to map the subsurface and better understand how the continent is unzipping along the East African Rift System, as Kimberly Cartier describes in “Eastern Africa Is Splitting Apart, but Not Where We Expected.”
Stick with Cartier for another leg of our fieldwork trip as she relates how researchers have instrumented an underwater volcanic vent off Papua New Guinea to track effects of ocean acidification on corals in “Coral Diversity Drops as Ocean Acidifies.”
From there, head to the decidedly less tropical climes of the South Pole, where a team recently installed a pair of seismometers deep in the Antarctic ice, completing a challenging and years-long feat of engineering, reports Grace Van Deelen in “These South Pole Seismometers Will Detect Vibrations 1.5 Miles Under the Ice.”
Finally, journey to the North American interior to learn what scientists found when they installed electrodes on the now-desiccated surface of Utah’s Great Salt Lake in Carolyn Wilke’s—spoiler alert—“What’s Below the Great Salt Lake? More Water.”
We’ll understand if you need a break after all that globe-trotting. But you’re always welcome to join us for more adventures in the field.
For roughly 45 million years, the eastern section of the African continental plate has been slowly pulling apart. Like a giant zipper extending from the Red Sea to Mozambique, the East African Rift System will likely be home to new oceanic crust that will well up from the widening split in Earth’s surface. While most of the rifts in that system are still zipped shut, the Afar region in northern Ethiopia has already partially unzipped and may be starting to create a future ocean basin.
Most m
For roughly 45 million years, the eastern section of the African continental plate has been slowly pulling apart. Like a giant zipper extending from the Red Sea to Mozambique, the East African Rift System will likely be home to new oceanic crust that will well up from the widening split in Earth’s surface. While most of the rifts in that system are still zipped shut, the Afar region in northern Ethiopia has already partially unzipped and may be starting to create a future ocean basin.
Most models of this rift system suggest that it should continue to unzip sequentially from north to south. However, new research suggests that a region in the middle of the zipper is on the verge of splitting open.
High-resolution seismic reflection data show that the crust near Kenya’s Lake Turkana is only 13 kilometers thick. This suggests that the region has entered the second stage of rifting, called necking, and is one step closer to breaking apart. It is the only rift zone on Earth currently undergoing this short-lived tectonic process.
The Lothagam site in the Turkana Rift Zone contains tilted sediments from the late Miocene (about 7 million years ago), just before the necking phase of rifting commenced. Credit: Christian Rowan
Breaking Up Is Hard to Do
Just like mid-ocean ridges on the seafloor, sections of Earth’s crust on land also stretch apart as tectonic plates separate. This process, called rifting, takes place in three stages. First, the crust stretches, creating tension. Then it rapidly thins like pulled taffy—this is the necking stage. Finally, magma wells up from the lithospheric mantle, which creates new seafloor and breaks the continental plate apart.
“This is one of the unique places on Earth where you can see a continental rift.”
Not every rift makes it that far. Some remain stuck in the stretching phase with crust more than 20 kilometers thick. But northern sections of the East African Rift System (EARS), specifically the Afar Rift and the Red Sea, are already undergoing the final stage, oceanization.
“This is one of the unique places on Earth where you can see a continental rift,” said Anne Bécel, a geophysicist at Lamont-Doherty Earth Observatory of Columbia University in Palisades, N.Y., and coauthor of new research published in Nature Communications in April. “The East African Rift System has been studied for a very long time by geologists to really learn about our planet and how continents break apart, and then transpose that to mid-ocean ridges where oceanic plates spread apart.”
The team suspected that the Turkana Rift Zone, located at a critical triple junction in northern Kenya, was behaving differently from other areas of the rift system. It is home to an unusually large and continuous hominin fossil record dating back about 4 million years. Past research has also shown that the bottom of the crust, called the Moho, is unusually shallow in the Turkana Basin, just 20 kilometers deep compared with the average depth of 39 kilometers farther away from the rift.
During several field expeditions to Lake Turkana in partnership with local industries, the team mapped the top of the continental crust using borehole measurements and seismic reflection—sending seismic waves into the ground and measuring how the waves bounce back, like sonar. They combined those measurements with past research into Moho depths to calculate the crustal thickness near Lake Turkana.
That map showed that far away from the rift, the crust is more than 35 kilometers thick, but in the Turkana Rift Zone it is a mere 13 kilometers thick, below the threshold for necking.
“If you look at the modern day topography, the whole East African Rift is in this really low, broad land between two big plateaus, one to the north in Ethiopia and one towards the south,” said lead researcher Christian Rowan, a geologist and doctoral candidate at Columbia University. “It’s this very strange topographic feature, and part of that low-lying topography is actually how thin the crust is there.”
“The oldest rocks that record the initiation of the East Africa Rift System are also in the Turkana Rift,” said coauthor Folarin Kolawole, a Columbia University geologist. Geochemical analysis of those rocks suggests that necking in the Turkana Rift Zone began about 4 million years ago.
Christian Rowan measures a fault in the Turkana Rift. Credit: Christian Rowan
About to Break?
“Any time you have a place on the planet that is rare in the modern but seen in the past, it is compelling,” said Erik Klemetti Gonzalez, a volcanologist at Denison University in Granville, Ohio, who was not involved with this research. “The data does show that the Turkana Rift is the home of anomalously thin continental crust, so if you are looking for a location that meets criteria for necking, it seems to be the case.”
The team suspects that Turkana might have been primed to split apart more easily because another rifting event took place there a mere 17 million years before the present rift began. The Turkana Basin inherited a weaker section of crust that didn’t have time to fully heal in the (geologically) short time between rifting events. There was also an extended period of magmatic activity throughout much of the past 45 million years.
“Magmatism is well known to be a significant weakening factor in rifting,” Rowan said. “I think the two compounding effects of this inheritance and then magnetism is why the Turkana rift is so much more mature than other segments.”
“I would hope that more collaboration with African geoscientists could create the ability to collect data from places that have been more inaccessible over the past half century.”
“There are many ‘failed rifts’ in the geologic record, so the question of whether the EARS is actually leading to a continental break up, albeit a small one, is still very much up in the air,” Klemetti Gonzalez said. These new results tip the scales toward breakup, but he noted that more of the rift system still needs to be mapped to really understand the fate of this region.
“I would hope that more collaboration with African geoscientists could create the ability to collect data from places that have been more inaccessible over the past half century,” he added.
Rowan and his team are working toward that end by continuing to map crustal thicknesses in other nearby rift zones.
“This was the only known rift that was undergoing necking along the entire East African Rift System, or in the world,” said Kolawole. “But based on ongoing work, there is evidence that there are other segments that are at the onset of necking in the East African Rift System.”
Citation: Cartier, K. M. S. (2026), Eastern Africa is splitting apart, but not where we expected, Eos, 107, https://doi.org/10.1029/2026EO260148. Published on 12 May 2026.
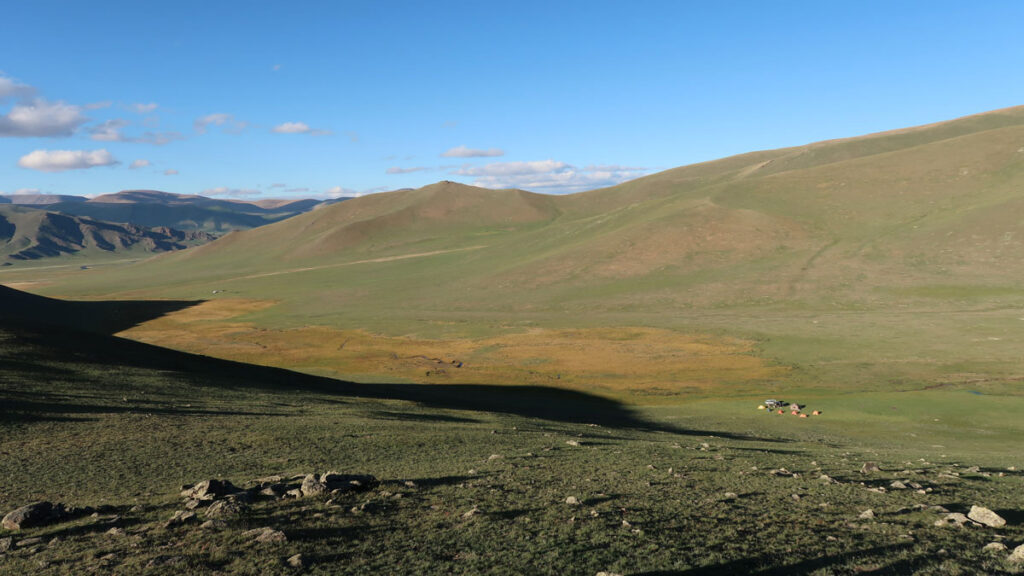
Central Mongolia’s Hangay Mountains have long posed a conundrum. Rising 4 kilometers above sea level, the dome-shaped range plays a key role in shaping the region’s climate. But it couldn’t have formed in the same way as most equally tall mountain ranges.
“These mountains in central Mongolia are very far from any plate boundary, about 3,000 kilometers away from the Pacific margin,” said Pengfei Li, a geologist at the Chinese Academy of Sciences’ Guangzhou Institute of Geochemistry. “
Central Mongolia’s Hangay Mountains have long posed a conundrum. Rising 4 kilometers above sea level, the dome-shaped range plays a key role in shaping the region’s climate. But it couldn’t have formed in the same way as most equally tall mountain ranges.
“These mountains in central Mongolia are very far from any plate boundary, about 3,000 kilometers away from the Pacific margin,” said Pengfei Li, a geologist at the Chinese Academy of Sciences’ Guangzhou Institute of Geochemistry. “It’s very hard to understand why we have such a mountain range so far from the plate boundary.”
Li recently led research finding that geochemical evidence supports a compelling explanation of how these oddball mountains formed. The researchers proposed that at the site of the future mountains, a U-shaped bend in a tectonic plate led to an extra-thick lithosphere. A chunk of that heavy lithosphere eventually broke off and sunk into the mantle. Free of the extra weight, the crust then rebounded upward as the Hangay Mountains.
Bend and Snap
“It’s the first discovery of volcanism for this period.”
Tectonic plates are far from rigid. As they move above, below, and against each other, sections of the plates far from the boundary can develop curves and folds like a scrunched up tablecloth. Curved sections, called oroclines, are common around the world. At about 6,000 kilometers long, the Mongolian orocline is one of the longest, and the Hangay Mountains sit right at the curviest part of the orocline’s U shape.
Li and his colleagues suspected that the Hangays’ location along the orocline is no coincidence. During multiple field expeditions from 2018 through 2026, the researchers collected rock samples from several sites in the Hangay Mountains that showed signs of ancient volcanic activity. Uranium-lead dating of zircons within those samples showed that the area experienced volcanic activity in the early Cretaceous period 124–114 million years ago.
“When I saw the age, I was surprised,” Li said. “120 million years—no one had ever reported volcanoes [in the Hangay Mountains] during this period.…It’s the first discovery of volcanism for this period.”
The team also analyzed the samples for major and trace elements to determine the depth at which the rocks formed. Their geochemical analysis revealed that the rocks formed in the lithosphere 80 kilometers below the surface. They published these results in Geology in April.
It’s pretty odd that the rocks originated so deep, Li said, because the modern-day lithosphere is only 70 kilometers thick.
The team proposed that when the continental plate folded and created the Mongolian orocline 200 million years ago, the lithosphere bunched up and became thicker in the curve of the U shape. That thicker section of lithosphere, a root at least 80 kilometers thick, would have been unstable in the long term, Li explained.
The lithospheric root would have been too heavy to remain attached to the crust above for long, and a chunk of it would have eventually snapped off. When it sunk, or foundered, into the deep mantle, it would have melted and generated the volcanic activity recorded in the rocks the team studied. Free from the weight of that lithospheric root, the crust above would have rebounded into the dome-shaped mountain range visible today.
Complicated Yet Compelling
“Their story, though complicated, makes a great deal of sense and in a way provides affirmation of a prediction made some time ago regarding oroclines.”
“The story that [the researchers] have put together to explain the massive Hangay topographic ‘dome’ of central west Mongolia is a compelling one that spans more than the past 200 million years of Earth history,” said Stephen Johnston, a tectonics researcher at the University of Alberta in Canada who was not involved with this research. Past research into the Iberian orocline suggested that oroclines might lead to lithospheric thickening, and this explanation of the Hangay Mountains fits that narrative.
“Their story, though complicated, makes a great deal of sense and in a way provides affirmation of a prediction made some time ago regarding oroclines,” Johnston added.
Johnston said that the new explanation of how the Hangay Mountains formed makes him wonder why it took so long—80 million years—between when the orocline formed and when the lithospheric root sank.
“This seems a long time for a gravitationally unstable mantle root to have remained attached to the overlying crust,” he said. He hopes that future work can help determine whether this process has taken place at other oroclines around the world and has simply been overlooked or whether there is something special about the Mongolian orocline.
Li and his team have turned their attention to how the formation of the Hangay Mountains shaped the region’s ancient climate. Today, the towering mountain range prevents moist air from northern Mongolia from reaching the parched Gobi Desert in the south. They hope to connect how a process deep underground, like lithospheric foundering, affected the paleoclimate and, consequently, the region’s habitability.
“It’s very new to try to understand the Earth’s habitability from a deeper sense,” Li said.
Correction 18 May 2026: The distance between the Hangay Mountains and the Pacific plate margin has been corrected. The location of newly discovered volcanic activity has been corrected.
This news article is included in our ENGAGE resource for educators seeking science news for their classroom lessons. Browse all ENGAGE articles, and share with your fellow educators how you integrated the article into an activity in the comments section below.
Citation: Cartier, K. M. S. (2026), Mongolian mountains rose when the crust bounced back, Eos, 107, https://doi.org/10.1029/2026EO260153. Published on 15 May 2026.
Since 1989, Utah’s Great Salt Lake has lost some 70% of its surface area, reducing its ecosystem services and creating stretches of drying lake bed (playa) that send toxic dust into the air.
That drying ground has also provided opportunities for scientists to survey what lies below the lake’s floor. In a study published in Geosciences, researchers revealed glimpses of fresh water and salt water, with some fresh water lurking only a few meters below the surface. The work could provide clues f
Since 1989, Utah’s Great Salt Lake has lost some 70% of its surface area, reducing its ecosystem services and creating stretches of drying lake bed (playa) that send toxic dust into the air.
That drying ground has also provided opportunities for scientists to survey what lies below the lake’s floor. In a study published in Geosciences, researchers revealed glimpses of fresh water and salt water, with some fresh water lurking only a few meters below the surface. The work could provide clues for conserving the lake, a crucial resource for both the ecology and the economy of the region.
Salt Lake, Fresh Water
In 2023, Michael Thorne and colleagues began using a technique known as electrical resistivity tomography (ERT), which can reveal the presence of fresh or salty water, at dozens of spots near the southern and eastern edges of the Great Salt Lake. Thorne is a geophysicist at the University of Utah in Salt Lake City and a coauthor of the new study.
The lake’s desiccation allowed the researchers to access areas where “at previous times, you would never be able to do measurements because [they] would be underwater,” said Thorne.
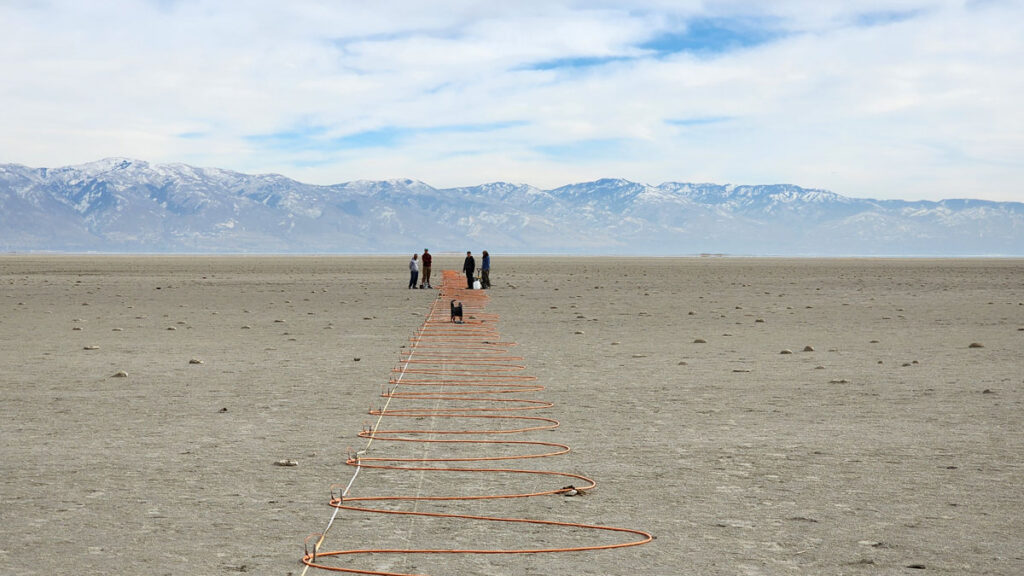
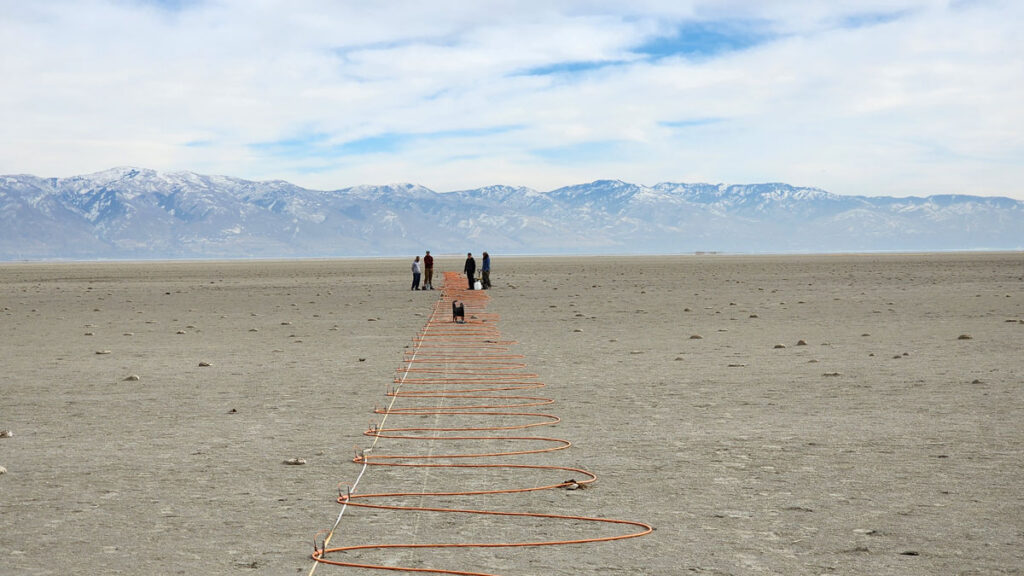
Establishing a network of ERT sensors requires robust fieldwork. Over the course of long days in the field, Mason Jacketta, lead author of the new study, and others placed electrodes into the ground a few meters apart, making lines that stretched hundreds of meters. Between pairs of electrodes, they measured the resistance to electrical current. Salty water, filled with electricity-conducting ions, has lower resistance than fresh water.
Paired with information on the rock and sediment beneath the surface, as well as with measurements from nearby wells, the ERT data allowed the team to work out a profile of how electrical resistance varied with depth and to figure out what kind of water seeped through pores in the ground below. The team shared the results of their work on the southern part of the lake in Geosciences, while more in-depth findings about the eastern shore will appear in an upcoming publication.
“What this is really showing is that [fresh water is] prevalent all over the place.”
At many of the sites, Jacketta and others found fresh water near the surface.
“What this is really showing is that [fresh water is] prevalent all over the place,” said Elliot Jagniecki, a geologist at the Utah Geological Survey who wasn’t part of the work.
That fresh water was often in close proximity to patches of salty groundwater. At one spot in the southeastern part of the lake, the team found a shallow layer of brine. But right below that, at only 5 meters of depth, they encountered fresh water. At the team’s most northern study site, they found fresh water around 2 meters deep. On the southern shore, they found fresh water in some places as shallow as 2.8 meters.
Mysterious Formations
The team’s results also helped explain curious features around the Great Salt Lake, including mounds made of salt and islands made of reeds.
The lacy-looking layers of the lake’s so-called mirabilite mounds form in the winter, when the cold freezes upwelling salty water, concentrating its salts. With measurements taken next to where some mirabilite mounds form, the researchers could visualize the underground conduits that send salty water to the surface.
While mirabilite mounds form close to shore, mounds made of Phragmites reeds appear in the lake’s interior as well as along its periphery. Thorne and his colleague William Johnson first noticed these mysterious circles popping up in Google Maps more than a decade ago. When they went to investigate, they found Phragmites.
“The population of Phragmites around the Great Salt Lake is really not allowing fresh groundwater to go back into the Great Salt Lake.”
In the new work, the team placed a line for electrical resistivity tomography straight through a Phragmites mound. These reeds wouldn’t be able to survive in the lake’s briny water, Thorne said, but the team’s results showed fresh water rising right to where the invasive reeds grew thick.
“The population of Phragmites around the Great Salt Lake is really not allowing fresh groundwater to go back into the Great Salt Lake,” said study coauthor Tonie van Dam, a geophysicist at the University of Utah. The reeds suck up some 70,000 acre-feet of fresh water that could go back into the lake, she said. In “sucking up [fresh water] for their own existence,” van Dam explained, the reeds crowd out native plant species that provide habitat for native birds.
More Than a Beautiful Landscape
Overall, the study provides a new picture of the fresh and salty groundwater beneath the lake and how these resources feed what people observe at the surface.
It’s also helped to prompt other work, Thorne said, including one recent study in which researchers used a helicopter carrying a wire loop to create and sense electrical currents underground. That study, published in Scientific Reports, suggested there could be a large amount of fresh water under one part of the lake.
But that work is a proof of concept, Jagniecki said, and accessing such potential aquifers might not be sufficient to help address the lake’s current desiccation. Even if they could, refilling them could take thousands of years. “I just don’t think that’s a solution,” he said.
Saline lakes are fragile ecosystems sensitive to climate change, Jagniecki said. The Great Salt Lake harbors plenty of life, such as brine shrimp that become food for a host of migratory birds that use the lake as a stopover. Mineral extraction and the use of brine shrimp for feed in aquaculture are important drivers of Utah’s economy.
Getting a better understanding of how saline lake systems function could be helpful in conserving them and maintaining the resources they provide humans, Jagniecki explained.
“It’s actually more than that. It’s a beautiful landscape,” he said.
—Carolyn Wilke, Science Writer
Citation: Wilke, C. (2026), What’s below the Great Salt Lake? More water, Eos, 107, https://doi.org/10.1029/2026EO260127. Published on 21 April 2026.