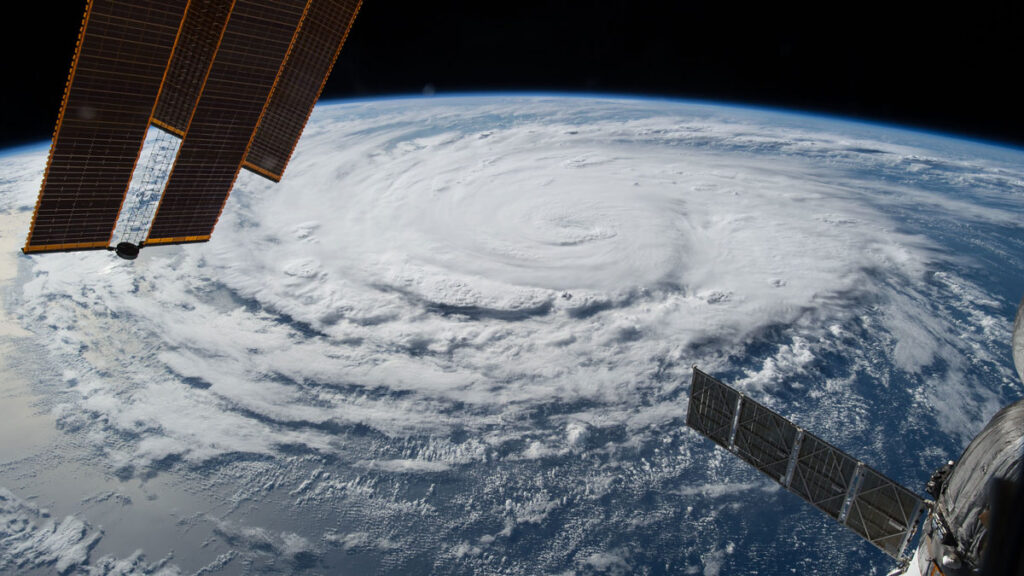
In its annual forecast of the upcoming Atlantic Hurricane season, NOAA suggests the 2026 season has a 55% chance of being below normal, compared with a 35% chance of being near normal and just a 10% chance of being above normal.
The forecast, announced at a press conference at the NOAA Aircraft Operations Center in Lakeland, Fla., includes 8 to 14 named storms (with winds of at least 39 miles per hour), 3 to 6 of which will be hurricanes (with winds of at least 74 miles per hour). One to thr
In its annual forecast of the upcoming Atlantic Hurricane season, NOAA suggests the 2026 season has a 55% chance of being below normal, compared with a 35% chance of being near normal and just a 10% chance of being above normal.
The forecast, announced at a press conference at the NOAA Aircraft Operations Center in Lakeland, Fla., includes 8 to 14 named storms (with winds of at least 39 miles per hour), 3 to 6 of which will be hurricanes (with winds of at least 74 miles per hour). One to three of those are forecast to be major hurricanes (category 3 to 5 storms, with winds of at least 111 miles per hour).
NOAA forecasts that a below-average hurricane season is most likely in 2026, largely because of El Niño conditions. Credit: NOAA
A below-average number of hurricanes does not reduce the need for people to be prepared, NOAA representatives emphasized.
“Even though we’re expecting a below-average season in the Atlantic, it’s very important to understand that it only takes one.”
“Even though we’re expecting a below-average season in the Atlantic, it’s very important to understand that it only takes one,” said Under Secretary of Commerce for Oceans and Atmosphere and NOAA Administrator Neil Jacobs. “We have had category 5s make landfall in the past during below-average seasons.”
In contrast, NOAA is forecasting an above-average season in the Pacific, with a 70% likelihood of above-normal activity.
Matthew Rosencrans, lead hurricane forecaster with NOAA’s National Weather Service, noted that the Atlantic forecast does not yet contain information about potential hurricane landfalls, just the likelihood of their formation. National Weather Service Director Ken Graham said the potential for rapid intensification—when wind speed increases by at least 35 miles per hour over the course of 24 hours—makes early preparedness particularly important.
“Every category 5 that’s made landfall in this country was a tropical storm or less 3 days out,” he said. “So they rapidly intensified that quick. You think you might have a week on your timeline. The reality is you may only have days.”
“There will never be a ‘Hurricane Justa,’” he added. “There’s no such thing as just a category 1, just a tropical storm, just a category 2.…Even the smallest storm, if it’s slow enough and big enough, it’s going to be catastrophic flooding and storm surge.”
The Atlantic hurricane season runs from 1 June to 30 November. The NOAA forecast is in line with an Atlantic hurricane forecast issued 9 April by Colorado State University (CSU), which predicted 13 named storms and 6 hurricanes, including 2 major hurricanes. Similarly, a forecast released 22 April by North Carolina State University predicted 12 to 15 named storms, 6 to 9 hurricanes, and 2 to 3 major hurricanes.
All three forecasts are slightly below the average Atlantic hurricane numbers for 1991–2020: 14.4 named storms, 7.2 hurricanes, and 3.2 major hurricanes.
The World Meteorological Organization has released its list of 2026 Atlantic tropical cyclone names. Credit: NOAA
El Niño
The forecast for below-average activity levels largely stems from El Niño, a climate pattern that increases vertical wind shear over the tropical Atlantic. Vertical wind shear is how much the speed and direction of wind change with altitude. When wind shear is too high, it can tear a hurricane apart before it forms.
“Wind shear is good for us, bad for the hurricanes,” said Phil Klotzbach, a hurricane forecaster at Colorado State University and lead author of the CSU report.
This year, researchers suggest El Niño could become the strongest in modern history, which could have ripple effects on global temperatures. At the NOAA press conference, Jacobs said that there is a 98% chance of El Niño conditions occurring later this season and an 80% chance that it will be moderate to strong. The forecasted strength of El Niño has only grown since CSU issued its forecast, Klotzbach said.
However, in addition to high wind shear, El Niño is also characterized by unusually warm waters in the Pacific. Klotzbach compared the warm waters of El Niño to loaded dice.
“If the waters are a little bit warmer, that will load the dice for the storm to get stronger.”
“To get to a hurricane, you need to have warm water,” he said. “You need to have a lot of other stuff as well, but if the waters are a little bit warmer, that will load the dice for the storm to get stronger.”
El Niño isn’t the only reason our oceans are warming.
At a press briefing hosted by Covering Climate Now prior to the NOAA press conference, Shel Winkley, a meteorologist at Climate Central, noted that about 90% of the excess heat caused by greenhouse gas emissions has gone into Earth’s oceans, as the planet tries to keep our atmosphere in balance.
“We’re not saying that climate change necessarily creates hurricanes,” Winkley said. “But it is supercharging them: More intense winds, heavier rain, bigger flooding. That’s the connection that we can confidently draw.”
Citation: Gardner, E. (2026), NOAA forecasts a below-average hurricane season, Eos, 107, https://doi.org/10.1029/2026EO260171. Published on 21 May 2026.
This story was produced by Grist and the Food & Environment Reporting Network, a nonprofit news organization. Sign up for Grist’s weekly newsletter here.
Will Runion’s 736-acre cattle and hay farm is tucked into a horseshoe bend of the Nolichucky River in northeast Tennessee. On the morning of Friday, September 27, 2024, he was in the middle of two big projects: building a riverfront campground on his land to bring in tourists and income, and cutting the last of the season’s hay. Hurrica
Will Runion’s 736-acre cattle and hay farm is tucked into a horseshoe bend of the Nolichucky River in northeast Tennessee. On the morning of Friday, September 27, 2024, he was in the middle of two big projects: building a riverfront campground on his land to bring in tourists and income, and cutting the last of the season’s hay. Hurricane Helene had been arcing up from Florida toward the Appalachian Mountains, carrying heavy rain, and the river was high. Even though the banks seemed to be holding, he decided to move some of his cows and equipment to higher ground.
But the river kept rising. At about 11 a.m., the brown water topped its banks. He and his fiancée, his son-in-law’s parents, and neighbors scrambled to salvage what farm equipment they could, but they were nearly trapped when the quickly expanding river flowed into a low-lying area behind where they were working, cutting them off from dry land.
By afternoon, the river had swollen to some 1,200 feet wide—nearly 10 times its usual size. It “looked just like a lake,” Runion said. Trees snapped in the swift current and neighbors’ barns, roofs, hay bales, and household debris swirled by. The water swallowed Runion’s hay equipment and sent the little white house he’d planned to use as the new campground’s office sailing across a field.
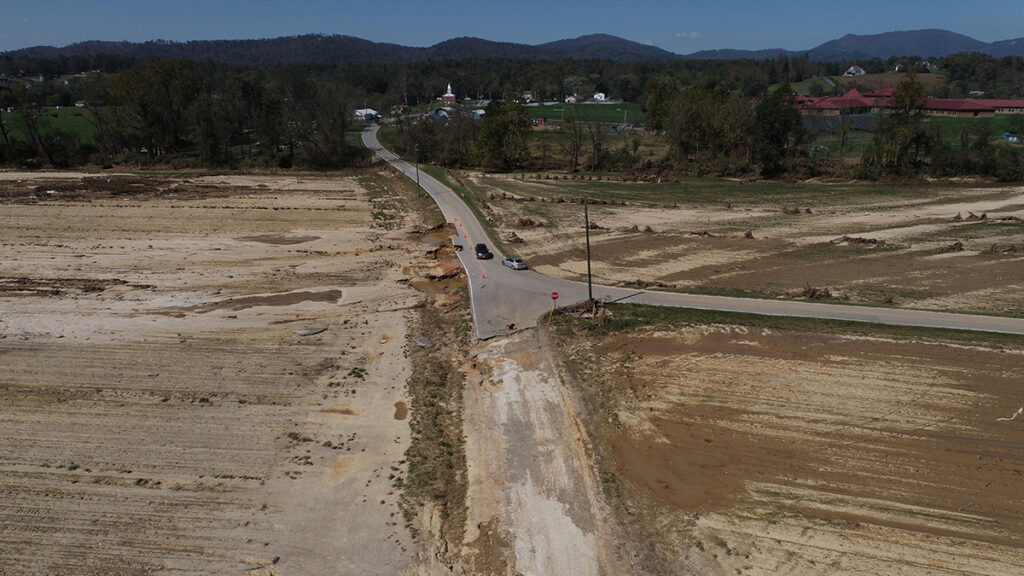
At around 8 p.m., the Nolichucky finally crested and started to recede. Runion found a third of his fields covered in debris, dead fish, and tomatoes from upstream vegetable growers. The flood had gouged two holes the size of football fields in his hay pastures, down to a depth of 12 feet. Other sections of the farm were buried in up to 8 feet of sand or silt.
Flooding from Hurricane Helene brought massive damage to Will Runion’s farm, eroding the land in some places and washing up feet of sand on agricultural fields in other sections. Courtesy of Bryan LeBarre, via Grist
Helene dropped up to 30 inches of rain on southern Appalachia, causing historic flooding and landslides in parts of North Carolina, South Carolina, Tennessee, Georgia, Kentucky, and Virginia—a largely rural region where agriculture is a vital economic driver and cultural cornerstone. The mountains make it hard to spread out here, so farms tend to be small, and many growers use flood-prone bottomland because it is flat and fertile. But floods of this magnitude hadn’t hit here in generations. In North Carolina alone, Helene caused an estimated $4.9 billion in damage to the state’s agriculture sector. In Tennessee, agricultural losses were estimated at $1.3 billion. Thousands of farmers lost crops, tools, machinery, barns, buildings, animals, and fences.
“When you see 4 feet of sandy soils on top of your topsoil, you know that’s going to be a challenge. That was overwhelming.”
More than a year later, growers are also contending with the loss of something more vital, and more difficult to replace: their soil.
Runion knew immediately that his livelihood was ravaged. Without good soil, a farmer can’t farm. “When you see 4 feet of sandy soils on top of your topsoil, you know that’s going to be a challenge,” he said. “That was overwhelming.”
He sent drone footage of the damage to Forbes Walker, an environmental soil specialist with University of Tennessee Extension. “How do you fix this?” he asked.
“I don’t know,” Walker recalled thinking when he got Runion’s email. “How do we fix this?”
Over millennia, floods helped build the fertile land that farmers depend on. But today, climate change is driving more powerful and unpredictable storms. One study found that rainfall associated with Helene was 10 percent heavier due to man-made climate change. Research by the U.S. National Science Foundation suggests that what scientists call “100-year storms” will become three times more likely, and 20 percent more severe, over the next 50 years. What’s more, there’s little solid information about what happens to soil during a flood, or what to do when a farm’s soil is eroded or covered with material from elsewhere—its nutrients washed away and microbial communities disrupted. It’s a blind spot that is becoming more of a liability as storms like Helene become more common.
“None of us had ever seen anything like this before or responded to an emergency like that,” said Stephanie Kulesza, a nutrient and soil scientist at North Carolina State University. “And so we weren’t really prepared for recommendations to provide to producers.”
Soil can take thousands of years to form. Rock is weathered and slowly dissolves into smaller and smaller pieces. As dead leaves, animals, trees, and other plants decompose, they add organic matter and nutrients to the rock. Microorganisms establish themselves in the mix, driving nutrient cycling, aiding with decomposition, and stimulating plant growth; then worms and bugs, like beetles and ants, burrow in the mixture, aerating it. For soils to work well for agriculture, they need the right structure—airy enough to allow water to enter and move through, but not too quickly or too slowly—and sufficient biological and chemical richness, including nutrients like nitrogen, phosphorous, and potassium, to nourish crops.
Farmers use synthetic or natural fertilizers to ensure their soil has enough nutrients. They can also introduce practices like no-till—farming without plowing up the ground—to maintain the physical properties of their dirt. Topsoil, the rich, uppermost layer with the most available nutrients for crops, tends to make up less than a foot of the entire soil profile, but it’s crucial for agriculture.
Soil scientist Forbes Walker visits Will Runion’s farm in 2025, examining the deep sandy deposits left behind by Hurricane Helene. Credit: Raffe Lazarian/University of Tennessee Institute of Agriculture via Grist
Helene’s floodwaters either washed away significant topsoil or deposited new sediment on top of it on thousands of farms. Some, including one of Runion’s neighbors, saw their fields stripped down to bedrock, or river rock. Runion and others woke to pastures blanketed by feet of sand or stone.
When topsoil is washed away, the necessary nutrients for growing go with it. And when topsoil is covered with sand, farmers can’t get to it. Both scenarios can significantly alter the land’s usability. Topsoil can take decades or centuries to develop, and sand lacks both organic matter and the physical structure to hold water and nutrients. “These aren’t soils yet,” said Kulesza of what Helene left on Runion’s and other farmers’ land. “They are in their infancy now. The clock has been reset.”
Runion had cared for his soils, working to eliminate weeds, adding fertilizer to keep nutrient levels ideal, and lime to control pH. “They were our way of life,” Runion said. “They were our income.”
After the storm, from October to April, he removed debris, bulldozed sand off his fields to get closer to the topsoil, filled holes, and graded uneven land. Crews from the Federal Emergency Management Agency removed and shredded downed trees. He applied for government relief and received close to $1 million in state and federal aid. Runion said he could have easily used all of that money replacing equipment and paying for cleanup labor, fertilizer, and fuel, but he’s trying to stretch the money as much as possible.
By June, it was time to mow the fields that hadn’t flooded. He managed to put up enough bales of hay to feed his herd of 125 cattle, but not enough to sell. In a normal year, hay sales made up about a third of the farm’s income. With months of work behind him and his flooded land still too sandy and generally depleted, he realized the recovery would be a slog.
Runion returned to work on the campground, which he hoped would diversify the family’s earnings. The longer-term plan included a music venue and some hiking trails, and to host weddings and corporate events. After the storm, finishing it took on new urgency. He chose a new spot, about 450 feet upland from the river, and began clearing enough land for 45 camping sites.
One environmental soil specialist described the academic literature on flood-damaged soils as “thin.”
Runion also prepared a parcel of land for Walker, the extension soil specialist, to run tests that could guide his recovery. Last November, soon after the one-year anniversary of Helene, Walker showed me around Runion’s farm.
Working with students, Walker established four experiments over about 300 test plots. He’s looking at how different soil amendments—hay, wood chips, poultry litter, and a charcoal called biochar, to help the soil hold water and fertilizer; and Triple 19, a common plant food with equal parts nitrogen, phosphorous, and potassium—affect the growth of wheat and fescue grasses.
When I visited, some of the plots remained mostly bare while, in others, tufts of green had sprouted. “We actually got some stuff to grow,” Walker said.
He described the academic literature on flood-damaged soils as “thin.” While some research and case studies exist on how agricultural soil recovers after a flood, there are few systematic investigations like the one Walker is conducting—on what works, and what does not—particularly in Appalachia, where floods of this magnitude have been historically rare.
When so-called atmospheric rivers spawned devastating floods in the Pacific Northwest and southwestern British Columbia in 2021, Aimé Messiga, a Canadian soil research scientist at the Agassiz Research and Development Centre, found a similar “scarcity of data.” He conducted a detailed review of the existing research and concluded that there was limited long-term monitoring, little understanding of how floods affect nutrients and microorganism communities in the soil, and uncertainties about what the actual impacts of floods on agriculture and crops are. Complicating everything is the variability between different farms, soils, and crops.
“You need decades of accumulated data in order to be able to predict what will happen. We don’t have those data.”
“You need decades of accumulated data in order to be able to predict what will happen,” Messiga said. “We don’t have those data.”
Today, some researchers are attempting to replicate flood conditions in labs to better understand, but field work is rare, Messiga said. There’s little money for it—and in the U.S., the Trump administration has cut funding for climate-related research. In addition, “many among us still look at these events as random,” Messiga said. “They’re not random. They will keep occurring.”
Since 1980, 45 flooding events have caused damages over $1 billion each in the U.S., with more than half of those occurring in the past 15 years. In 2024, flooding in the upper Midwest drowned crops. Repeat events in central California damaged agricultural operations from winter 2022 to spring 2023. Flooding along the Mississippi River in 2019 reduced crop planting by millions of acres. There also have been numerous smaller or more localized floods. One study found nearly 75,000 flash floods in the contiguous U.S. from 1996 to 2017, with increasing frequency in the past 22 years. Flooding frequency and strength is predicted to rise in the years to come due to climate change—a warmer atmosphere holds more moisture and leads to stronger rain events—and poor land-use management.
Scientists are also starting to study a new type of event, called “weather whiplash,” when sudden changes occur from one extreme to another, amplifying the effects of the disaster. In Texas in 2025, a flood came after prolonged drought, causing widespread destruction.
For farmers, the effects of flooding on soil may linger for years after the disaster. In 2011, the Missouri River flooded states in the Upper Midwest, including thousands of acres of farmland. Fields were swamped for months with up to 20 feet of water. When the water finally receded, those fields were covered with anywhere from 2 to 20 feet of sand; other fields had washed out holes up to 70 feet deep. It looked like the surface of the moon, said John Wilson, a now-retired educator and agricultural expert who served Burt County, Nebraska, which was particularly hard-hit. “It was just bare soil,” he said. “There was no crop residue whatsoever.”
Wilson led teams that sampled the soil and helped farmers build back. He found that levels of nitrogen and organic matter were low in flooded soils, and fertility suffered when farmers planted their crops. Over about five years, fertility generally improved, but not everywhere. “If you went out today and did a yield map, you could still tell exactly where the erosion was because those areas are not as productive,” Wilson said.
Yield is money for farmers, who already navigate thin margins and, often, years without any profit at all. North Carolina’s strategic plan for agriculture recently enumerated just how thin: Of the state’s “42,500 farms, only 8,000 produce annual gross sales that exceed $100,000 annually. The overwhelming majority … some 23,400, gross less than $10,000 in sales, with only around 40 percent of the farms in the state having a positive net income in 2022.”
As floods increasingly wreck farmland, more researchers are starting to focus on understanding the effects of the floods and how to address them. Most of that work is happening in Asia, Messiga said. But a study in coastal North Carolina, where hurricanes regularly land, found that after a storm there was less organic matter in the soil, including carbon, and a disruption of microbial activity and nutrient cycling. The ground also absorbed water less readily.
Coastal flooding is also driving saltwater into the soil of farmland, making it more saline and unable to sustain crops. A North Carolina State University team has been developing test kits for farmers to sample the salinity of their soils, as well as a set of recommendations for keeping their soil viable. Such local work is important because soils vary greatly from place to place, and findings are not often easily transferable.
Nicole DelCogliano’s farm near Asheville, North Carolina, was wiped out almost entirely by floods from Hurricane Helene in 2024. Courtesy of Nicole DelCogliano via Grist
For now, in the wake of Helene, farmers are relying largely on trial and error to build back what was lost. Nicole DelCogliano has been farming vegetables, flowers, and livestock with her husband on 50 acres on the South Toe River, near Asheville, North Carolina, for 25 years. Helene washed away her barn, tractor, and other infrastructure. Of her 6 acres of vegetable fields, one was covered with several feet of sand, another got a foot, and a third field suffered extensive erosion.
“Our entire operation was wiped out, essentially,” she said.
“It’s not something that can be fixed overnight. This is a long process.”
With the help of some friends with tractors, DelCogliano cleared her main field and spread compost and lime on everything. “There was a mix of guidance about what you should do, like should you disturb the soil, should you not?” she said. “At an instinctual level, we just felt like we got to get the soil covered, we got to get something in the ground.” They sowed rye, a dependable cool season grass, as a cover crop, to protect the soil from erosion and add nutrients.
Karen Blaedow, an agricultural educator in Henderson County, North Carolina, said farmers should expect to put in at least three years of cover cropping before they see results in their soil. “It’s not something that can be fixed overnight,” she said. “This is a long process.”
In the spring following the flood, DelCogliano spread various amendments on her least-damaged field, including compost, lime, biochar, and blood and bone meal, which provide nitrogen and phosphorus, respectively. After all that, she and her husband seeded crops.
Their new vegetables came in about two weeks later than normal, but the season was more productive than ever, even though they grew on just 4 instead of 6 acres—“which is pretty amazing,” she said. “When we first started harvesting crops [after Helene], we didn’t yet have power at the farm. I had to dig one of our sinks out of a bank and bleach it and clean it and drag it up to the new barn—that we barely got a roof on—to wash and pack for that first [farmers] market.”
She doesn’t really know what made the year so productive. They planted more intensively to account for the smaller acreage and were able to harness their years of expertise to restart their operation basically from scratch. She also attributes the relative health of her soil to years of organic practices. “We’re dirt farmers,” she said. “Our primary job is to tend the dirt. Because that’s the basis of everything.”
Some farmers who’ve seen good harvests may have gotten a little lucky. Rather than sand, floods dumped silt. Even Runion got silt deposits in one section of his farm. Unlike the sand, the silty layers carry nutrients and create a positive growing environment. “We have a producer we work with and he said it’s the most fertile soil that he’s had in decades,” said Emine Fidan, a biosystems engineering and soil science researcher at the University of Tennessee, who’s also working on Runion’s farm. “And he said it grew the sweetest corn he’s ever had. It was growing just beautifully.”
Runion didn’t plant anything until this past fall. He prepared about 65 acres of the 220 that were underwater. It was slow going; he used a disking machine to till his land but had to stop often to clear sticks and trash and to grade out low spots. He mixed in mulch and planted oats, wheat, and fescue. Walker drove me past one of the fields and it still looked sandy, the grasses just a pale green shadow on the tan land. Runion said the greenery was “struggling to have any vigor about it.” He won’t know for sure how well or poorly the grasses do until spring, their peak growing season.
He considered planting more acreage but decided to wait and see what he learned from Walker’s trials. “It’s a process, and the knowledge we’re gaining there will help on the whole rest of it, too,” Runion said.
This spring, Walker’s team will measure the biomass in each plot as well as the quality of the crop, including how much protein it has and its digestibility. They’ll also be evaluating the soil itself, including its ability to hold water, to determine if any of the treatments improved the structure of the sandy dirt.
One farmer thinks the hay he’ll get in the coming years will be lower-yielding, lower-quality, and will cost more to produce due to the extra prep time, new seeds, and fertilizers.
Preliminary results suggest that, in plots where they put down mulch, the grasses are growing better than in plots with other amendments. The woody debris is reducing erosion and seeds are germinating well and standing up in the rough matrix. Spreading this kind of mulch isn’t an obvious solution, Walker said: Wood chips are a carbon-rich material, but as they break down in the soil they consume nitrogen, which can lead to a deficiency for the crops. But this mulch had sat in piles and started to decompose before it was applied to Runion’s fields, which made it less likely to cause these problems.
Runion had asked FEMA to leave the piles of wood chips on his farm rather than remove them like they normally would. Walker is looking for solutions to the soil problem that not only work but are also accessible. Have a mountain of mulch? Put it to work. Have nearby chicken houses? Maybe their nitrogen-rich manure can help revive flooded fields. His hope is that his team’s research can provide some guidance to farmers who find themselves in similar situations in the future. “I think it will have broad implications for a number of different crops,” including vegetables, Walker said.
Meanwhile, Runion is coming to terms with his situation. He thinks the hay he’ll get in the coming years will be lower-yielding, lower-quality, and will cost more to produce due to the extra prep time, new seeds, and fertilizers. He used to sell a lot of square bales, which tend to contain high-quality grasses and fetch a higher price, but he doesn’t expect to be doing that for a while. He’d initially hoped to have his land back in shape in a year or two. “Now it’s a four- to five-year [plan], I think,” Runion said. “It has been frustrating, and exhausting, too.”
He’s still optimistic, though. On my visit, I watched him grade out the new campground in a large dump truck. Freshly exposed red soil lay open to the sky. He thinks he can get the campground open by late summer or early fall. Over time, he hopes, it will be a more lucrative, and more sustainable, source of income. “The farm is really beautiful,” Runion said. “It still has a lot to offer.”
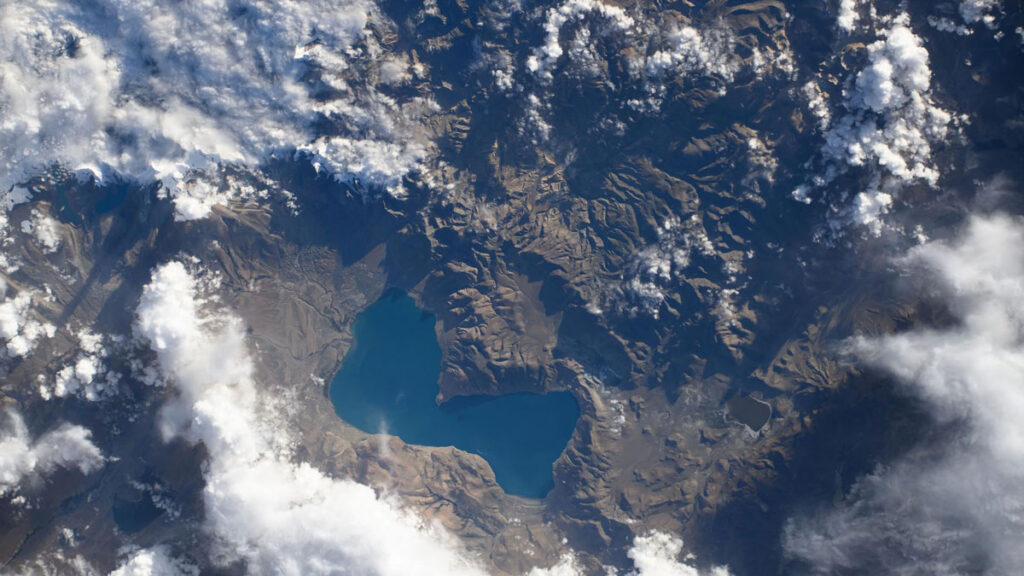
As the Indian and Eurasian continental plates collide, the Tibetan Plateau is slowly deforming. For decades, geoscientists debated how this deformation occurs: Is the plateau like a block of crumbly aged cheddar, deforming mostly at its faults, or is it more like French brie, moving like a very viscous liquid being pushed slowly to the east?
A new study published in Science shows that both theories are at work. The study’s findings provide the most comprehensive picture yet of the Tibetan Pl
As the Indian and Eurasian continental plates collide, the Tibetan Plateau is slowly deforming. For decades, geoscientists debated how this deformation occurs: Is the plateau like a block of crumbly aged cheddar, deforming mostly at its faults, or is it more like French brie, moving like a very viscous liquid being pushed slowly to the east?
A new study published in Science shows that both theories are at work. The study’s findings provide the most comprehensive picture yet of the Tibetan Plateau’s deformation and offer valuable information for earthquake hazard assessments in the region.
The new model that combines the two theories is a “significant advance,” said Eric Fielding, a geodesist who was not involved in the study. Fielding is a staff member at NASA’s Jet Propulsion Laboratory but did not speak on behalf of the agency. “It’s clearly the result of a very large amount of work,” he said.
A Deformation Investigation
For decades, scientists have held differing views on the Tibetan Plateau’s deformation. One camp modeled the plateau’s deformation with movement occurring mostly at its faults, while the other modeled the movement like a thick fluid deforming areas beyond faults.
“These two communities have carried on modeling deformation in different ways” and have never fully resolved the differences between their models, said Tim Wright, a geodesist at the University of Leeds in the United Kingdom and lead author of the new study.
It’s tricky to measure the plateau’s deformation, though, because it changes so slowly: One of the fastest faults on the plateau, the Kunlun Fault, moves at about just 10 millimeters per year. “These are rates that are less than your fingernails growing,” Wright said.
And because much of the Tibetan Plateau’s terrain is inaccessible, there’s a dearth of ground-based stations to track movement, meaning most geodetic data for the area must come from satellites.
“It’s a boon for science to have that consistent acquisition of the same kind of data for 10 years.”
Tracking such nearly imperceptible movement with satellites hundreds of kilometers above requires enormous amounts of data collected over many years. Wright and his colleagues finally had those data after 10 years of observations from the European Space Agency’s Sentinel-1 satellite mission, which launched in 2014.
“Because the signals are so small, you need to wait for some time before you accrue enough deformation that you can actually measure it,” Wright said. The 2014–2024 data they analyzed are “giving us a really clean signal,” he said.
“It’s a boon for science to have that consistent acquisition of the same kind of data for 10 years,” Fielding said.
Using tens of thousands of satellite images alongside ground-based satellite navigation system stations, Wright and the team constructed comprehensive velocity maps of the deformation of the plateau. Results showed that a mix of theories best describes the mechanism.
“We think what’s really happening is a combination of both,” Wright said.
Wright, who described himself as “formerly of the viscous deformation camp,” was surprised by the prominent role that faults played in the plateau’s deformation. Previously, he said, he would have described the faults as passive markers within the underlying flow of the landmass. But the data show that the faults influence a much broader area of the plateau: “The whole deformation of the plateau is influenced by those faults,” he said.
The study “shows clearly that these major fault systems are responsible for a large part of the strain within the plateau,” Fielding said.
Mapping Seismic Hazards
“We have very little information about the history of earthquakes on these faults in this area.”
Knowing how the plateau deforms can also help scientists create more accurate seismic hazard assessments for the millions of people who may be affected by earthquakes there, particularly at the edges of the plateau. “We have very little information about the history of earthquakes on these faults in this area,” Fielding said.
The research team is working with the Global Earthquake Model Foundation, a nonprofit earthquake research collaboration, and other organizations to incorporate their findings into hazard assessments.
Wright and the research team recently used a similar methodology to map the deformation field of the entire Alpine-Himalayan belt, which stretches from Spain to eastern China. The same methods could be used to map the deformation of the western United States, another area where both viscous and fault-related deformation may affect large population centers, Fielding said.
Citation: van Deelen, G. (2026), Weak faults play a strong role in the Tibetan Plateau’s deformation, Eos, 107, https://doi.org/10.1029/2026EO260162. Published on 22 May 2026.
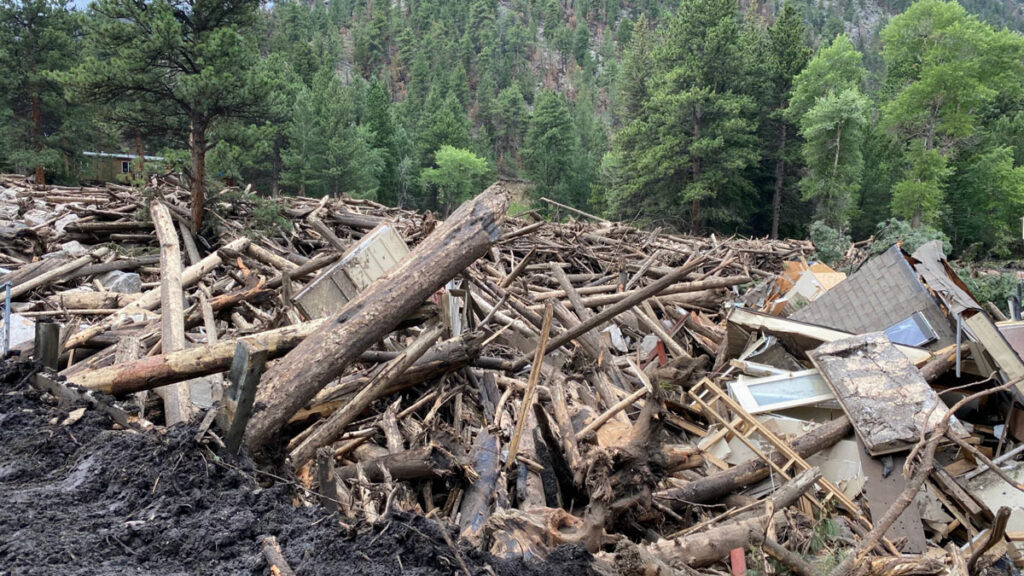
Months after wildfires eliminate vegetation that holds hillside sediment together, debris flows—destructive landslides that carry bulky material down once-stable slopes—can devastate infrastructure, taking out roads and buildings in their wake.
Though the U.S. Geological Survey (USGS) creates hazard predictions used to warn communities of the risk of these postfire debris flows, those predictions haven’t fully considered how recovering vegetation reduces risk over time—until now.
A new study published in Geosphere presents a new way to calculate postfire debris flow risk that takes vegetation recovery into account. The USGS will begin using the new method this wildfire season to create more accurate maps of debris flow hazard in the years after a fire.
“I’m so appreciative that the focus on how the debris flow hazard changes over time after fire is being addressed,” said Nancy Calhoun, a geologist and postwildfire debris flow program manager at the Washington Geological Survey who was not involved in the new study. Calhoun said she relies on the USGS hazard assessments for virtually everything her job requires.
“We’re glad to have a way that we can help our partners moderate those situations where the hazard has decreased,” said Andrew Graber, a geologist at the USGS Landslide Hazards Program and lead author of the new study.
Assessing Hazard, Again
After a wildfire, the USGS creates hazard maps that incorporate information about soil type, steepness, and burn severity (how much vegetation has been lost) to show where the risk of a debris flow may be elevated.
Then, the agency distributes this guidance to the National Weather Service, which uses it to set rainfall thresholds: levels of rainfall at which a debris flow becomes likely. State, county, and city agencies use those rainfall thresholds to issue warnings or take action when rainfall is imminent, for example, by closing highways or triggering evacuations.
“That left us with some uncertainty when we started to get further away in time from the fire.”
The methods used to create the USGS maps, however, historically relied on a snapshot of the burned area taken just after the fire, and the maps weren’t updated to reflect conditions as vegetation grew back and began holding soil in place again.
That led to situations where public safety decisions were made on the basis of outdated maps and rainfall thresholds. For example, concern over debris flows after the 2020 Grizzly Creek Fire in Colorado led to several closures of Interstate 70 in 2022, but the debris flows never happened.
“What [the original assessments] didn’t capture is how the vegetation came back,” Graber said. “That left us with some uncertainty when we started to get further away in time from the fire.”
Intense rainfall in July 2025 triggered a debris flow near Dayton, Wyo., in the 2024 Elk Fire burn area. Credit: USGS, Public Domain
To test an improved method for these hazard assessments, Graber and the research team incorporated satellite imagery of 12 burned areas that showed the degree of vegetation recovery right after the fire, 1 year after the fire, and 2 years after the fire. Then, they tested their new method by comparing its predictions to rainfall and debris flow data from the 12 burned areas.
The updated method better reflected what had actually happened after the fires, reducing the number of unnecessary warnings without missing real-world debris flows.
Risk Recalibration
The USGS plans to begin using their new workflow to create hazard maps for some higher-profile fires during the coming wildfire season.
“It’s a really important question: Are we still worried about this burn scar?”
That’s exciting for Calhoun. As part of her job, she’s in constant contact with emergency managers who periodically ask how worried they should be about debris flows in areas that burned years ago. “It’s a really important question: Are we still worried about this burn scar?” she said.
Right now, Calhoun has no data to point to in the years after a fire to give an updated answer to that question. Using the new method from Graber and the research team, she will.
“Because they’re using satellite [imagery] and repeatable quantitative methods to look at these burn scars over time, we’ll actually be able to say something useful and informed about vegetation recovery,” she said.
Having a deeper understanding of how debris flow risk evolves over time is especially important because debris flows themselves are becoming a greater risk to the public as a result of increasingly intense wildfires and rainstorms. In addition, more accurate assessments can reduce warning fatigue, which occurs when too many false alarms lead to people ignoring or opting out of alerts.
Graber hopes he and the USGS will continue to improve their methods for assessing debris flow hazards by collecting more debris flow data across the country and improving the underlying equation for hazard assessments so that it better reflects the unique conditions of different ecosystems in the United States. USGS researchers also published a new study in March presenting a method to generate maps of where debris flows might travel if they do occur.
“It’s a big year for USGS’s useful postfire products,” Calhoun said.
This news article is included in our ENGAGE resource for educators seeking science news for their classroom lessons. Browse all ENGAGE articles, and share with your fellow educators how you integrated the article into an activity in the comments section below.
Citation: van Deelen, G. (2026), A new approach can better predict debris flow hazards years after fires, Eos, 107, https://doi.org/10.1029/2026EO260160. Published on 19 May 2026.
Thirty years ago, the blockbuster movie Twister featured a group of academics putting themselves at risk by chasing tornadoes in the name of science. Although the Hollywood story entailed a surfeit of sensationalism, special effects, and unrealistic stereotypes, the movie got a few things right. Specifically, the scientists were trying to study tornadoes using a large number of spatially distributed, home-built, low-cost (and potentially sacrificial) sensors.
Today, we commonly refer to the
Thirty years ago, the blockbuster movie Twister featured a group of academics putting themselves at risk by chasing tornadoes in the name of science. Although the Hollywood story entailed a surfeit of sensationalism, special effects, and unrealistic stereotypes, the movie got a few things right. Specifically, the scientists were trying to study tornadoes using a large number of spatially distributed, home-built, low-cost (and potentially sacrificial) sensors.
Today, we commonly refer to the coordinated use of tens to hundreds of similar sensors that are spread out as “large-N” sensing. Such sensor distributions have led to important advances in seismology and infrasound science, where they have improved our understanding of seismic ground motion and helped shed light on volcanic eruption dynamics [e.g., Rosenblatt et al., 2022; Anderson et al., 2023].
The benefits of large-N networks and arrays include robust spatial sampling and signal extraction from noise. They are also advantageous for detecting small signals, sensing natural hazards in remote environments, and offering critical redundancies for sensors at risk from lava or debris flows, wildfire, weather, or even malicious mammals.
Since 2013, our research group in the Department of Geosciences at Boise State University (BSU) has worked to study infrasound from geophysical phenomena by capitalizing on the benefits of low-cost, large-N sensing technology [e.g., Slad and Merchant, 2021]. More than a decade on, this effort has yielded scientific successes from a variety of environments, and it is continuing to evolve.
Large-N Sensing for Infrasound
Many violent natural processes, including landslides, volcanic eruptions, earthquakes, avalanches, and meteors, produce infrasound.
Many violent natural processes, including landslides, volcanic eruptions, earthquakes, avalanches, and meteors, produce infrasound, defined as low-frequency sound below the threshold of human hearing (less than 20 Hertz). Such events may create audible sound as well, but the subaudible band is often much more energetic in terms of sound intensity, and it has long wavelengths that can propagate long distances with little attenuation. These characteristics make infrasound especially valuable for remote sensing of natural phenomena.
Our group at BSU grew more interested in developing our own inexpensive infrasound sensing solutions after costing out technology for commercial data logging systems, the compact electronic devices that record and store sensor data. These systems can be far more expensive than infrasound transducers—the sensors that actually detect sound—themselves.
The cost element became particularly relevant after we lost instrumentation deployed at the summit of Chile’s Villarrica volcano when it erupted a 2-kilometer-tall lava fountain on 3 March 2015 [Johnson et al., 2018]. In an instant, our hardware, including seismic and infrasonic sensors and their commercial multichannel data loggers, was entombed beneath falling lava. This financial loss incentivized our work to develop low-cost loggers that would match the technical specifications and fidelity of commercial systems.
The result was the customized Gem infrasound logger, which we created using the widely available and very economical Arduino open-source electronic prototyping platform and its low–power consumption microcontroller. The Gem is an all-in-one infrasound sensor and data logger with a high dynamic range (millipascals to 100 pascals), a 100-hertz sample rate appropriate for infrasound, and a built-in GPS for precise timing and synchronization [Anderson et al., 2018].
Although we initially conceived of the Gem as an alternative to commercial loggers to be deployed as single stations or in small arrays, we quickly realized its potential for use in high-density distributed sensing arrays that enabled new detection capabilities. In particular, its small package size (it has about the dimensions and weight of a paperback novel) and its ease of deployment—simply insert alkaline batteries, place it on the ground, and turn it on—have opened opportunities for rapid, large-N deployments in difficult-to-access environments.
Early Successes for the Gem
Volcán Villarrica, near Pucon, Chile, is seen in 2025 (left). The volcano regularly releases gas from a small lava lake recessed deep within the summit crater (right). Credit: Jeffrey B. Johnson
The Gem’s inaugural field mission came in January 2020 during a return to Villarrica, where activity had returned to normal following its 2015 paroxysmal eruption [Rosenblatt et al., 2022]. Typical activity in the volcano’s normal state includes open-vent degassing from a small lava lake recessed deep within the summit crater, which produces its famously powerful volcano infrasound [e.g., Johnson et al., 2012].
To capture Villarrica’s infrasound in detail, a four-person team from BSU climbed the 3,000-meter-tall glaciated volcano and quickly installed 16 sensors around the crater rim, as well as another 16 sensors along an 8-kilometer linear transect from the summit down the northern slope (Figure 1). This unique sensor distribution permitted us to capture the infrasound wavefield and how it interacts with topography in unprecedented detail.
Fig. 1. (a) Oblique and (b) plan views of Villarica’s summit region were created from structure-from-motion surveys in 2020. Red triangles and circles indicate locations of Gem sensing packages. (c) Also in 2020, Jake Anderson adjusts a cable suspended across the volcano’s crater that held a Gem sensor (circled). (d) In 2025, Jerry Mock unloads Gem systems at Villarica’s summit during another data collection campaign there. Click image for larger version. Credit: Jeffrey B. Johnson
Deploying such an array configuration using much heavier, larger, and power-intensive conventional instruments would have taken far more time and resources, as well as a bigger group. With the Gems, however, the installation was feasible for our small team, each member of which could easily carry eight instruments and the batteries needed to power them.
To monitor volcanoes with infrasound, it is necessary to understand the influence of atmospheric effects.
Once in place, these sensors collected continuous data during the 2-week study that were used to quantify the diffraction of sound coming out of the volcanic crater [Rosenblatt et al., 2022] and to measure the sound’s attenuation as it propagated away. Such studies are important for investigating time-varying atmospheric parameters such as changing temperatures and winds, which can affect infrasound transmission, diminishing its amplitude or even—in extreme cases—completely silencing it in an acoustic shadow zone [Johnson et al., 2012]. To monitor volcanoes with infrasound, it is necessary to understand the influence of atmospheric effects.
Months later, another opportunity arose to demonstrate the Gems’ capability for large-N infrasound sensing. During the early days of the COVID-19 pandemic, on 31 March 2020, a magnitude 6.5 earthquake occurred near Stanley, Idaho. The earthquake, the largest in the state since 1983, kicked off an energetic aftershock sequence, with more than 700 magnitude 3 or greater earthquakes occurring in 6 months. Most of these events produced significant local infrasound radiation, or “airquakes,” caused by ground-atmosphere coupling [e.g., Johnson et al., 2020].
Pandemic-related precautions inhibited a large team from venturing as a group into the field. However, a lone BSU researcher (coauthor Jacob Anderson), trudging through forest terrain and deep snow on skis, was able to deploy and activate 22 Gems in less than 4 hours in early April, thanks in part to the sensors’ compact size and ease of deployment.
This array captured hundreds of local infrasonic aftershocks within about 25 kilometers of their epicenters. It also recorded a far larger event 700 kilometers away, the 15 May magnitude 6.5 Monte Cristo earthquake in Nevada. The array detected the epicentral infrasound from the distant earthquake source, as well as infrasound from numerous secondary sources, including mountain ranges throughout the western United States that reradiated the ground motion as infrasound (Figure 2) [Anderson et al., 2023].
Fig. 2. This map shows source region(s) of infrasound associated with the May 2020 Monte Cristo earthquake in Nevada that was detected by an array of Gem infrasound sensors deployed at the PARK site near Stanley, Idaho. Click image for larger version. Credit: Adapted from Anderson et al. [2023], CC BY 4.0
Detecting all these distinct signals was possible because of the enhanced array processing capabilities provided by the large number of sensors. Anderson et al. [2023] showed that when the data were processed from 3-sensor subsets of the 20+-sensor array—instead of from the whole array—it was possible to detect only the most intense earthquake infrasound arrivals. In other words, the larger array had much greater fidelity and sensing capabilities than smaller distributions of sensors.
During its 2-month deployment, the Stanley array also detected sounds from other distant nonearthquake sources, including waterfalls 195 kilometers away and thunder more than 900 kilometers away [Scamfer and Anderson, 2023]. Such enhanced detections, facilitated by large-N sensing, demonstrate an improved capacity to monitor a range of Earth phenomena continuously over a wide range of distances.
Putting Sensors in Harm’s Way
Since those proof-of-concept deployments, Gems have been used to monitor snow avalanches, lahars, river flow discharge, stratospheric sounds (while mounted aboard a solar balloon), and numerous volcanoes during field experiments [e.g., Tatum et al., 2023; Bosa et al., 2024; Rosenblatt et al., 2022; Brissaud et al., 2021]. Given their ease of use, small size, and low replacement cost, they’ve also been tested in hazardous environments where the risk to more expensive hardware could be considered unreasonable.
The motivation to put sensors in harm’s way is to gain insight into geophysical phenomena by recording subtle signals close to the source that may not be detectable from farther away.
The motivation to put sensors in harm’s way is to gain insight into geophysical phenomena by recording subtle signals close to the source that may not be detectable from farther away. For example, at Villarrica, Rosenblatt et al. [2022] suspended a Gem on a cable 100 meters above a lava lake to collect infrasound data from a unique, bird’s-eye perspective over the crater (Figure 1c). (Stringing the cable across the crater proved far more challenging than deploying the sensor itself, which slid down the cable until finding its resting place at the bottom of the cable’s arc.)
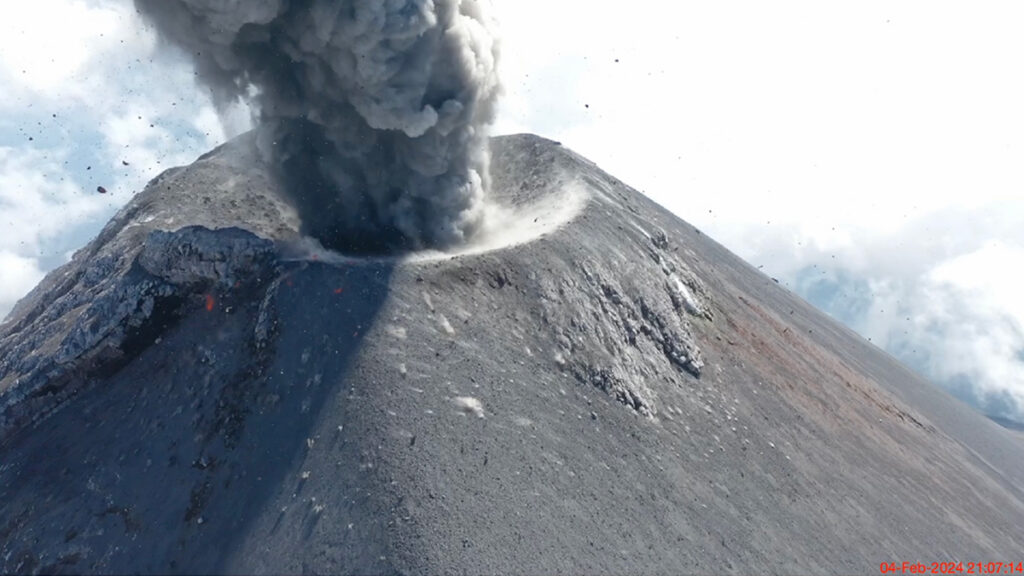
In another case, we landed a pair of Gems on the ground near a frequently exploding crater at Fuego volcano in Guatemala using a drone (see video below). We later retrieved one of the sensors from high on the volcano’s flanks. Another was lost because high winds initially posed too great a risk to fly the drone back for it. Then the following day after the wind subsided, we could not locate the stranded Gem, which was probably a casualty of a nighttime explosion.
Drone footage and infrasound recordings were collected during an explosion of Fuego volcano on 4 February 2024. Pa = pascals. Credit: video: Jerry C. Mock; animation and infrasound: Jeffrey B. Johnson
Our group at BSU also has nascent interest in using Gems to study fire in natural environments. Wildfires produce infrasound from a spatially extensive source region corresponding to actively burning areas. Because of the source complexity and the fact that fire infrasound is low amplitude and tremor-like [Johnson et al., 2025], enhancing signal-to-noise ratios in recorded infrasound is critical. This enhancement is enabled by using large-N monitoring networks, making infrasound wildfire surveillance a promising area of investigation.
Low-cost, rapid infrasound deployments could one day be used as an effective operational tool.
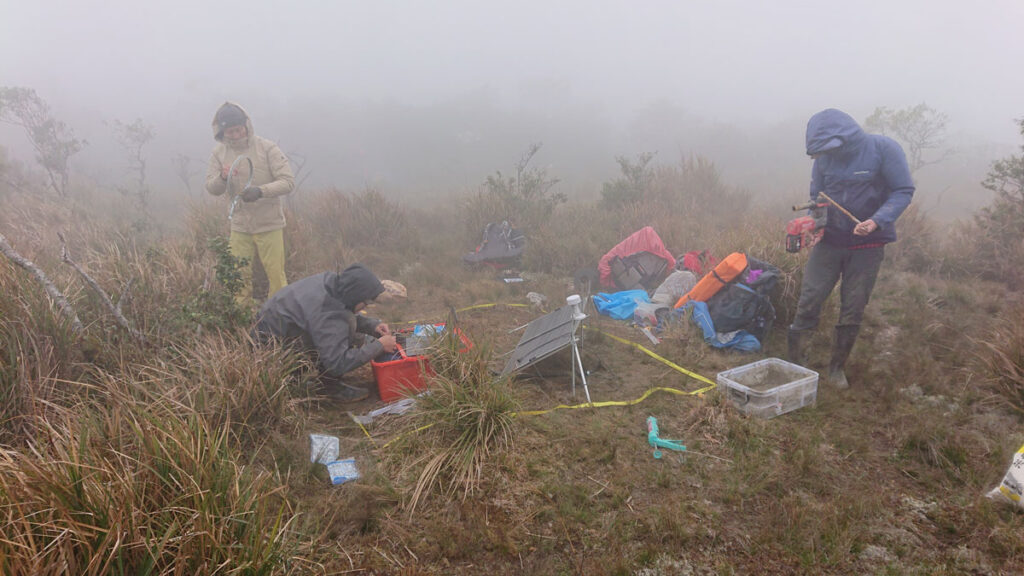
Toward this objective, our group installed 76 sensors ahead of a prescribed burn in Reynolds Creek, Idaho, in October 2023 to begin developing infrasound as a tool for monitoring and mapping wildfire. We have also deployed Gems for infrasound studies of naturally occurring wildfires, such as the Emigrant wildfire in Oregon in August and September 2025 (Figure 3). During that active wildfire response, a team safely and quickly installed tens of sensors within a matter of hours in an area facing dynamic hazards from the rapidly expanding fire, which eventually covered 33,000 acres (about 13,354 hectares). Luckily, no instruments were lost, and the data have shown the potential to track a wildfire as it advances.
Preliminary results suggest that low-cost, rapid infrasound deployments could one day be used as an effective operational tool. For example, in firefighting responses, infrasound might complement intermittent aerial observations, from aircraft or drones, because it provides a continuous record of fire activity. Infrasound surveillance might also be able to “hear” combustion sources within a burn area that is obscured to optical sensing because of clouds or nightfall.
Fig. 3. (a) The spread and severity of the 2025 Emigrant Fire in Oregon, as calculated from prefire (21 August) and postfire (18 October) Sentinel-2 satellite images, are shown. Inset maps show the distribution of 37 Gem sensors rapidly deployed in three arrays. (b) Smoke from the fire rises from the landscape on 31 August during deployment of the sensors. (c) Following the fire, one sensor that had been melted by the fire was recovered with its data card still intact (red circle). dNBR = differenced normalized burn ratio. Click image for larger version. Credit: (a) and (b): Madeline A. Hunt; (c): Jacob F. Anderson
The Evolution of Low-Cost Sensors
Five years ago, the single-sensor Gem was a cutting-edge infrasound logging solution. While it remains a powerful and economical tool for large-N arrays and for sensing in hostile environments, it is evolving.
Boise State University researchers (left to right) Madeline Hunt, Owen Walsh, Jerry Mock, and Jacob Anderson prepare to deploy Gem sensors in Idaho’s Sawtooth Mountains in January 2024. Credit: Jeffrey B. Johnson
We have now developed the Gem into an even more versatile version called the Aspen, which can log four independent sensors at a sample rate of 200 hertz, double that of the Gem. The Aspen retains the small size, low weight, low power consumption, and low cost of the Gem, but with the capability to record higher-resolution 24-bit, time-synchronized data from a triaxial seismic sensor and an infrasound transducer.
Recording synchronous seismoinfrasonic data on the same logging platform offers the advantage of sensing both ground shaking and infrasonic oscillations. The ability to measure waves propagating in the ground and in the air simultaneously could facilitate work in the growing field of environmental seismology, which focuses on geophysical sources at Earth’s surface like debris flows and volcanoes.
Although we have focused on seismoacoustic geophysical measurements in our work, the concept of gathering data with low-cost instrumentation in harm’s way or from coordinated arrays of numerous sensors holds promise across Earth and environmental sciences. Such approaches could be used, for example, with tiltmeters (which measure slope changes), gravity meters, or near-infrared thermometers (e.g., optical pyrometers), all of which would offer additional data streams complementing seismoacoustic observations in geophysical studies of volcanoes.
With the diversity of emerging uses, it’s clear that large-N sensing—infeasible or cost prohibitive in many cases until recently—could transform how we measure many facets of Earth, helping to reveal the inner workings of volatile volcanoes, twisting tornadoes, and more.
Acknowledgments
More information about low-cost infrasound sensing solutions can be found at https://sites.google.com/boisestate.edu/infravolc/home. Development of the Gem infrasound logging platform was supported by a grant from the National Science Foundation (EAR-2122188).
References
Anderson, J. F., et al. (2018), The Gem infrasound logger and custom‐built instrumentation, Seismol. Res. Lett., 89(1), 153–164, https://doi.org/10.1785/0220170067.
Anderson, J. F., et al. (2023), Remotely imaging seismic ground shaking via large-N infrasound beamforming, Commun. Earth Environ., 4(1), 399, https://doi.org/10.1038/s43247-023-01058-z.
Bosa, A. R., et al. (2024), Dynamics of rain-triggered lahars and destructive power inferred from seismo-acoustic arrays and time-lapse camera correlation at Volcán de Fuego, Guatemala, Nat. Hazards, 121, 3,431–3,472, https://doi.org/10.1007/s11069-024-06926-1.
Brissaud, Q., et al. (2021), The first detection of an earthquake from a balloon using its acoustic signature, Geophys. Res. Lett., 48, e2021GL093013, https://doi.org/10.1029/2021GL093013.
Johnson, J. B., et al. (2012), Probing local wind and temperature structure using infrasound from Volcan Villarrica (Chile), J. Geophys. Res., 117, D17107, https://doi.org/10.1029/2012JD017694.
Johnson, J. B., et al. (2018), Forecasting the eruption of an open-vent volcano using resonant infrasound tones, Geophys. Res. Lett., 45, 2,213–2,220, https://doi.org/10.1002/2017GL076506.
Johnson, J. B., et al. (2020), Mapping the sources of proximal earthquake infrasound, Geophys. Res. Lett., 47, e2020GL091421 , https://doi.org/10.1029/2020GL091421.
Rosenblatt, B. B., et al. (2022), Controls on the frequency content of near-source infrasound at open-vent volcanoes: A case study from Volcán Villarrica, Chile, Bull. Volcanol., 84(12), 103, https://doi.org/10.1007/s00445-022-01607-y.
Scamfer, L. T., and J. F. Anderson (2023), Exploring background noise with a large‐N infrasound array: Waterfalls, thunderstorms, and earthquakes, Geophys. Res. Lett., 50, e2023GL104635, https://doi.org/10.1029/2023GL104635.
Slad, G., and B. Merchant (2021), Evaluation of Low Cost Infrasound Sensor Packages, Sandia Rep. SAND2021-13632, Sandia Natl. Lab., Albuquerque, N.M., https://doi.org/10.2172/1829264.
Tatum, T., J. F. Anderson, and T. J. Ronan (2023), Whitewater sound dependence on discharge and wave configuration at an adjustable wave feature, Water Resour. Res., 59, e2023WR034554, https://doi.org/10.1029/2023WR034554.
Author Information
Jeffrey B. Johnson (jeffreybjohnson@boisestate.edu), Jacob F. Anderson, Madeline A. Hunt, Owen A. Walsh, and Jerry C. Mock, Department of Geosciences, Boise State University, Idaho
Citation: Johnson, J. B., J. F. Anderson, M. A. Hunt, O. A. Walsh, and J. C. Mock (2026), Sensing the sounds from Earth’s hazardous environments, Eos, 107, https://doi.org/10.1029/2026EO260142. Published on 8 May 2026.
In the early morning of 10 August 2025, a mountainside collapsed into the waters of Tracy Arm Fjord in southeastern Alaska.
This massive landslide produced a tsunami that reached 481 meters on the opposite side of the fjord—higher than all but the world’s 14 tallest buildings—and registered on seismic detectors around the globe. For days after the slope collapsed, the waters of the fjord churned with a standing wave known as a seiche.
This drone video shows a man paddling throu
This massive landslide produced a tsunami that reached 481 meters on the opposite side of the fjord—higher than all but the world’s 14 tallest buildings—and registered on seismic detectors around the globe. For days after the slope collapsed, the waters of the fjord churned with a standing wave known as a seiche.
This drone video shows a man paddling through the iceberg-filled Tracy arm fjord in the aftermath of a landslide. Credit: Bill Billmeier
This event was the second-largest tsunami ever recorded and the largest not linked to an earthquake. A new paper published in Science presented strong evidence that the Tracy Arm landslide was instead the result of the rapid retreat of South Sawyer Glacier, itself a consequence of global climate change.
“It’s like if you have a kid and they said they cleaned their room but really all they did was throw everything in the closet. As soon as you open that door, everything falls out.”
Nobody was harmed by the rockslide or tsunami, but cruise ships were scheduled to visit the fjord later that morning. If the collapse had happened just a few hours later, it could have been disastrous.
“While the [South Sawyer] Glacier is in the fjord, it’s supporting those valley walls, like the buttresses on a cathedral,” said Daniel Shugar, a geomorphologist at the University of Calgary who led the study. “As that glacier retreated over the last few decades, it retreated just past the spot that did fail. It’s like if you have a kid and they said they cleaned their room but really all they did was throw everything in the closet. As soon as you open that door, everything falls out.”
This animation shows an overhead view of the 10 August 2025 Tracy Arm landslide. Credit: Patrick Lynett, University of Southern California
In other words, the glacier that carved the fjord in the first place was also holding its slopes in place, and the ice’s retreat under warming temperatures exposed rock that became vulnerable to crumbling. The proximate cause of the landslide might have been something else—as Shugar noted, rainfall is plentiful in that part of Alaska, which could have weakened the fjord’s walls further—but it might also have been a combination of small, individually insignificant factors. In any case, the removal of that glacial “closet door” was what made the collapse and tsunami possible.
“We know that steep slopes are very sensitive to the things that climate [change] is exacerbating, whether it’s losing permafrost, glacier retreating, or more water in the soil,” said glaciologist Leigh Stearns of the University of Pennsylvania, who was not involved with the Tracy Arm study. “Often, we think of glacier retreat as a long and continuous thing, but [it] can trigger sudden catastrophic events.”
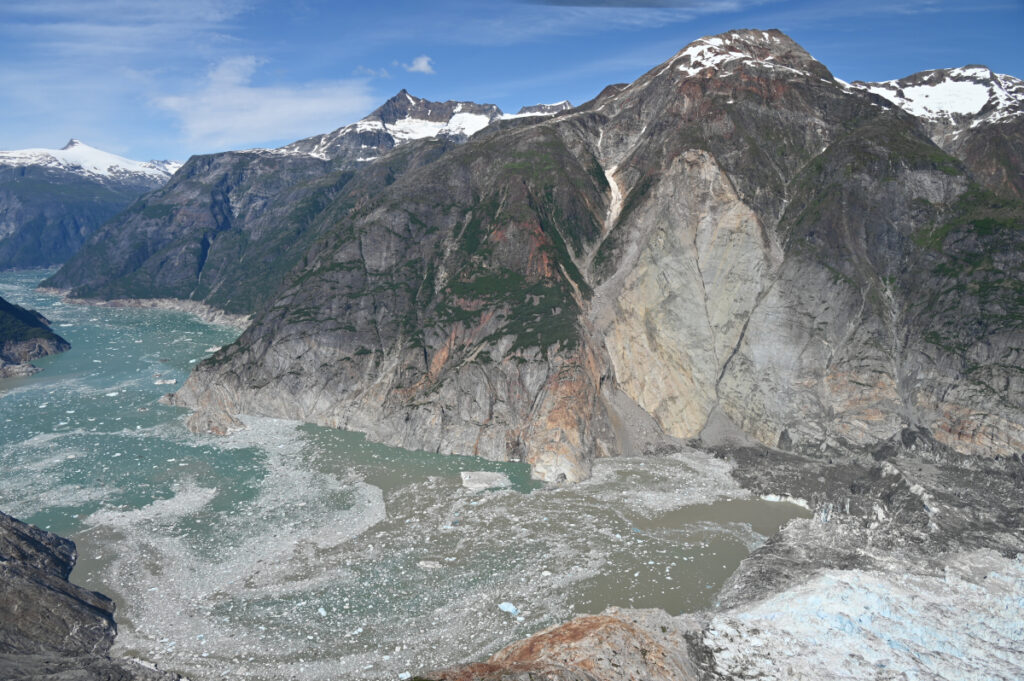
This aerial photo shows the highest run-up resulting from the 10 August 2025 landslide-triggered tsunami in Tracy Arm. It was captured during a U.S. Geological Survey field reconnaissance overflight on 13 August 2025. Credit: John Lyons/U.S. Geological Survey.
The Tracy Arm tsunami, like the record-setting Lituya Bay 524-meter megatsunami in 1958, was so dramatic in part because it happened in a fjord. The steep sides of the relatively narrow channel concentrated the energy generated by the rockfall into water.
A drone video shows the tsunami-affected part of the fjord, including the highest run-up area and the landslide itself. Credit: Bill Billmeier
Unlike Lituya Bay, which resulted from an earthquake, Tracy Arm provided very little seismic warning before the slope collapsed, requiring forensic work to determine what caused it.
Shugar noted that South Sawyer Glacier had retreated by roughly 500 meters in the spring of 2025 alone, on top of the general trend of shrinking and thinning over the decades. And it’s not alone: Interferometric synthetic aperture radar (InSAR) images taken by satellites indicate that many slopes in Alaska and beyond are in motion, pointing to potential future danger.
“Not every single one, but it seems like a huge majority of [shifting slopes] are above the lower parts of thinning glaciers,” Shugar said. He described this phenomenon as “debuttressing,” as in losing the glacial buttress holding a slope up. He added, “I think in the next 5 years or so, we’ll probably have a much better understanding of just how and how quickly slopes respond to that debuttressing.”
Threats, Hazards, and Climate Change
“We were unbelievably lucky that the [tsunami] occurred with the timing that it did, and not 5 hours later.”
Most tsunamis are set in motion by earthquakes and travel across the open ocean, wreaking their destruction when they reach shallower water near coasts; the word “tsunami” means “harbor wave” in Japanese. The Tracy Arm tsunami joined the ranks of other landslide-driven tsunamis, like the ones in Taan Fiord (Alaska) and Dixon Fjord (Greenland), in being linked to human-driven climate change. Beyond the immediate impact of the waves, this category of hazard requires rethinking potential risks from abrupt catastrophes like debuttressing as well as slower effects such as sea level rise.
“The risk to any particular cruise ship [from a tsunami] on any particular day is very low,” Shugar said. “We were unbelievably lucky that the [tsunami] occurred with the timing that it did, and not 5 hours later. The risk certainly still could be increasing as we build new settlements, new mining camps, or new oil and gas infrastructure.”
Both Shugar and Stearns highlighted the importance of learning lessons from Tracy Arm and related events.
“Climate is a threat multiplier, and the research is really forcing us to look at these cascading hazards,” Stearns said. Tracy Arm “is one example of this: Small slow changes can trigger big events. Hopefully, we don’t need so many disasters to spur some change.”
A drone video shows Sawyer Island in the Tracy Arm Fjord and evidence of the tsunami on the fjord walls. Credit: Bill Billmeier
This aerial photo shows the north side of Alaska’s Tracy Arm Fjord in the aftermath of the 2025 landslide and tsunami. The lighter-colored rock is the exposed surface, where the mountainside collapsed and fell into the water. The foot of South Sawyer Glacier is visible at lower right; in decades past, the ice extended much farther and was thick enough to hold the rock slopes in place. Credit: Cyrus Read/U.S. Geological Survey
Source: Geophysical Research Letters
As seismic waves travel through Earth, they gradually lose energy, a process called attenuation. That energy loss doesn’t happen uniformly—some features in the crust sap far more energy from seismic waves than others. Researchers can map underground features by watching where seismic waves lose more or less energy. The Southern Array for the Lithosphere and Uplift of Taiwan Experiment (SALUTE) is doing just that, providing information that could lead to i
As seismic waves travel through Earth, they gradually lose energy, a process called attenuation. That energy loss doesn’t happen uniformly—some features in the crust sap far more energy from seismic waves than others. Researchers can map underground features by watching where seismic waves lose more or less energy. The Southern Array for the Lithosphere and Uplift of Taiwan Experiment (SALUTE) is doing just that, providing information that could lead to improved seismic hazard planning in the country.
Lin et al. report attenuation results from SALUTE focused on the convergence between the Eurasian plate and the Luzon Arc, an understudied, geologically dynamic area where Earth’s crust is deforming. Using the overall attenuation rate and relative attenuation rates of P and S seismic waves, the authors imaged active faults, identified distinct lithologies, and better resolved the Luzon forearc block that sits just offshore of Taiwan.
The authors used data from the SALUTE high-density seismographic network, spanning December 2020 to December 2023, to construct both 2D and 3D attenuation models. They found clear changes in attenuation associated with major faults, as well as areas of high attenuation associated with fluid-rich, ductile zones in the lower crust that cause tectonic tremors. Their attenuation imaging additionally revealed that the Luzon forearc block, which had been poorly imaged in the past, dips northward and narrows as it nears the convergence zone.
The authors say their results agree well with previous velocity-based seismic imaging studies and show that attenuation can image features, such as transition zones, that were previously difficult to capture. Their data could also be useful for better understanding seismic hazard throughout the region, they note. (Geophysical Research Letters,https://doi.org/10.1029/2025GL121583, 2026)
Citation: Scharping, N. (2026), Seismic attenuation techniques reveal what lies beneath Taiwan, Eos, 107, https://doi.org/10.1029/2026EO260150. Published on 11 May 2026.