Mangroves May Be Losing Their Grip on Carbon Storage as Sea Levels Rise
Source: Earth’s Future
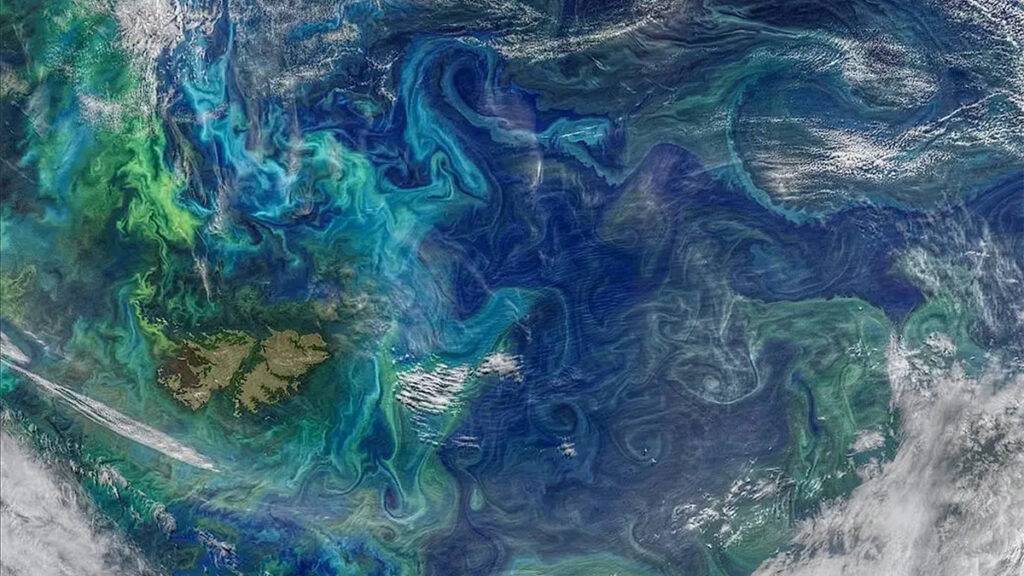
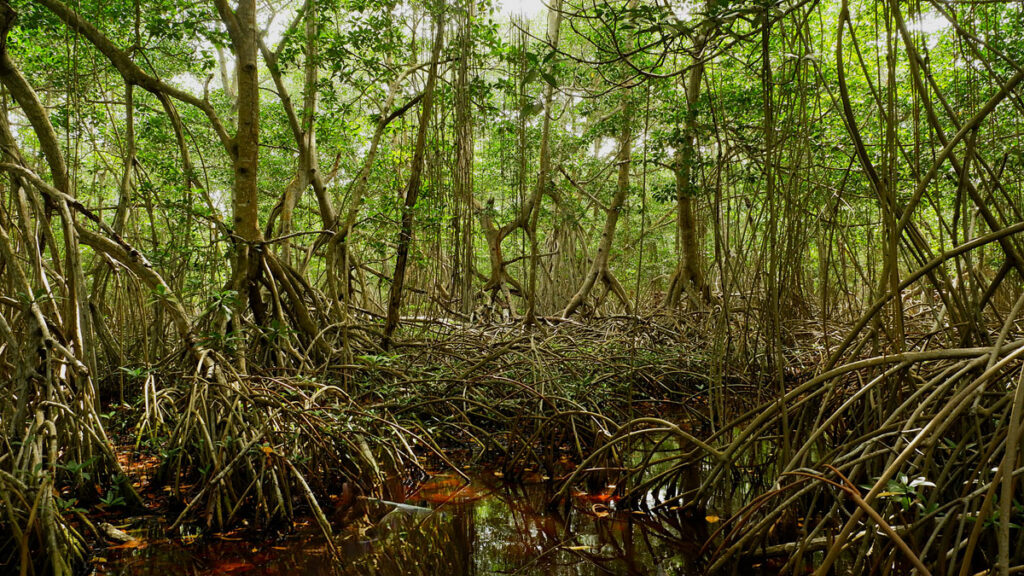
Mangrove forests straddle the edge of land and sea along some tropical and subtropical coastlines. These trees and shrubs have distinctive tangles of roots that trap sediment and produce organic matter, forming dense soils and efficiently storing carbon. Though mangroves cover only 1% of Earth’s surface, they store a whopping 15% of global ocean carbon in their trapped soils.
Their location along coastlines means mangroves are at the mercy of changing sea levels and sediment availability. Rising sea levels can drown mangroves or push them landward. At the same time, sediment supplies, belowground root growth, and organic matter accumulation can help build up mangrove soils, allowing forests to keep pace with sea level rise. So over time, will mangroves keep locking carbon into their soils, or will they start losing it?
Iwantoro et al. created a new model that examines the links between coastal processes to investigate vegetation growth and carbon accumulation in mangrove forests.
The researchers modeled a simplified tidal embayment to explore how different rates of sea level rise and sediment supplies would affect the mangroves. In these experiments, they found that carbon accumulation can increase at specific locations as waters rise because the increased water can lead to more mangrove growth—a result that matches existing data. However, when looking at landscape scales, they found sea level rise generally reduces total carbon sequestration through mangrove loss and soil erosion. The results showed that rising sea levels can alter mangroves from carbon storage sinks to carbon emitters.
The findings demonstrate that local trends in carbon sequestration may not be representative of larger-scale outcomes in mangrove forests. The study shows that understanding coastal landscapes as an interconnected system is crucial to understanding how mangroves can respond to climate and human-induced pressures, the researchers say. However, new assessments and approaches are needed to better understand future mangrove vulnerabilities. (Earth’s Future, https://doi.org/10.1029/2025EF006984, 2026)
—Sarah Derouin (@sarahderouin.com), Science Writer