Source: AGU Advances
As meltwater drains through and beneath a glacier, it can alter how the ice flows and whether it breaks apart. Meltwater can also cause feedbacks that lead to more ice loss. Understanding when and how glacial meltwater drains is therefore critical to predicting how fast glaciers will lose ice and how that loss will affect sea level.
Chudley et al. modeled how the rate of water flowing into a glacier relates to seasonal changes in the forces that squeeze and stretch ic
As meltwater drains through and beneath a glacier, it can alter how the ice flows and whether it breaks apart. Meltwater can also cause feedbacks that lead to more ice loss. Understanding when and how glacial meltwater drains is therefore critical to predicting how fast glaciers will lose ice and how that loss will affect sea level.
Chudleyet al. modeled how the rate of water flowing into a glacier relates to seasonal changes in the forces that squeeze and stretch ice—forces caused by gravity pulling the glacier downhill, by the ice sliding over subglacial water, and by how portions of the ice interact with the ocean.
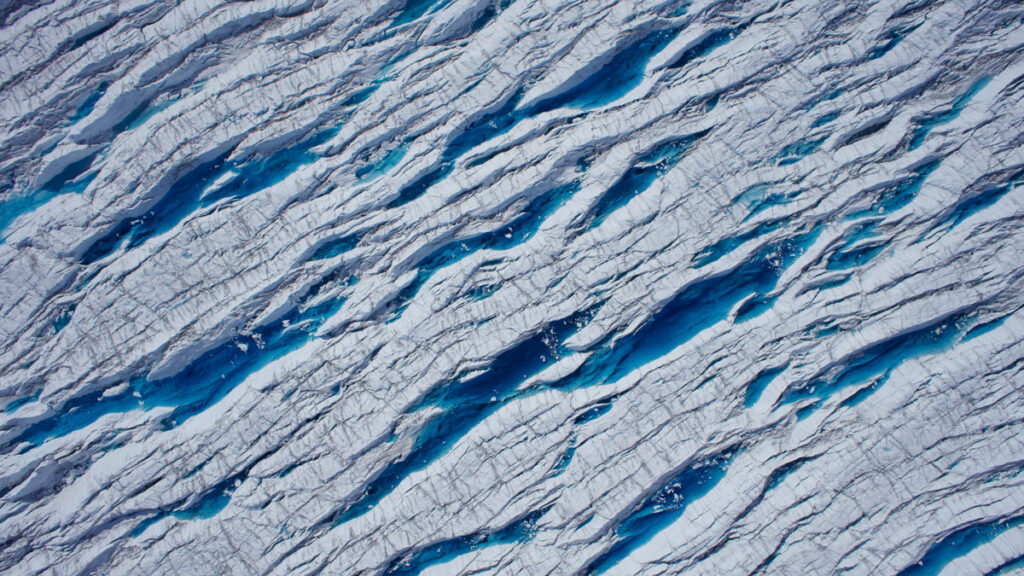
The researchers focused on the Sermeq Kujalleq glacier (also known as Store Gletsjer or Store Glacier) in Greenland. In spring, meltwater can fill cracks, or crevasses, that run through the surface of this glacier. These crevasses sometimes go on to drain as the year progresses.
The researchers used satellite imagery from the Sentinel-2 mission to see how much water was present in crevasses between 2016 and 2022, focusing especially on 2019, when the Sentinel-2 satellites provided the best coverage of the glacier. They fed those data into a convolutional neural network to map water cover through the season and looked for a relationship between the mechanical forces acting on the ice and the formation and drainage of crevasse ponds.
The researchers found that the mechanical forces acting on ice are the dominant factor in determining when crevasse meltwater drains into a glacier. When seasonal changes cause ice to stretch, crevasses can drain suddenly, releasing the water they held.
The Greenland Ice Sheet sheds trillions of gallons of water each year, and knowing when to expect that water to drain through the ice sheet is key to understanding processes such as how the glacier slides across the bed and when meltwater emerges in the ocean. The study’s results likely also shed light on dynamic processes in other glaciers and ice sheets, the authors say, and should help inform representations of ice behavior in numerical models. (AGU Advances, https://doi.org/10.1029/2025AV002150, 2026)
Citation: Sidik, S. M. (2026), Stretching and squeezing release glacial meltwater, Eos, 107, https://doi.org/10.1029/2026EO260152. Published on 26 May 2026.
Source: AGU Advances
Models of glacial flow and retreat rely on estimates of glacial ice viscosity, the measure of the ice’s resistance to flow.
Ice viscosity is dependent on the stress applied to the glacier. Most ice sheet models use a standard equation to model ice flow that includes the variable n, called the stress exponent. A larger value of n means ice viscosity is more sensitive to changes in stress. For decades, glaciologists have, almost exclusively, used an assumed n value of 3
Models of glacial flow and retreat rely on estimates of glacial ice viscosity, the measure of the ice’s resistance to flow.
Ice viscosity is dependent on the stress applied to the glacier. Most ice sheet models use a standard equation to model ice flow that includes the variable n, called the stress exponent. A larger value of n means ice viscosity is more sensitive to changes in stress. For decades, glaciologists have, almost exclusively, used an assumed n value of 3 in the models they use to predict ice flow.
However, through recent experiments and observations, researchers have found that an n value of 4 may actually better represent the conditions of Earth’s ice sheets and glaciers.
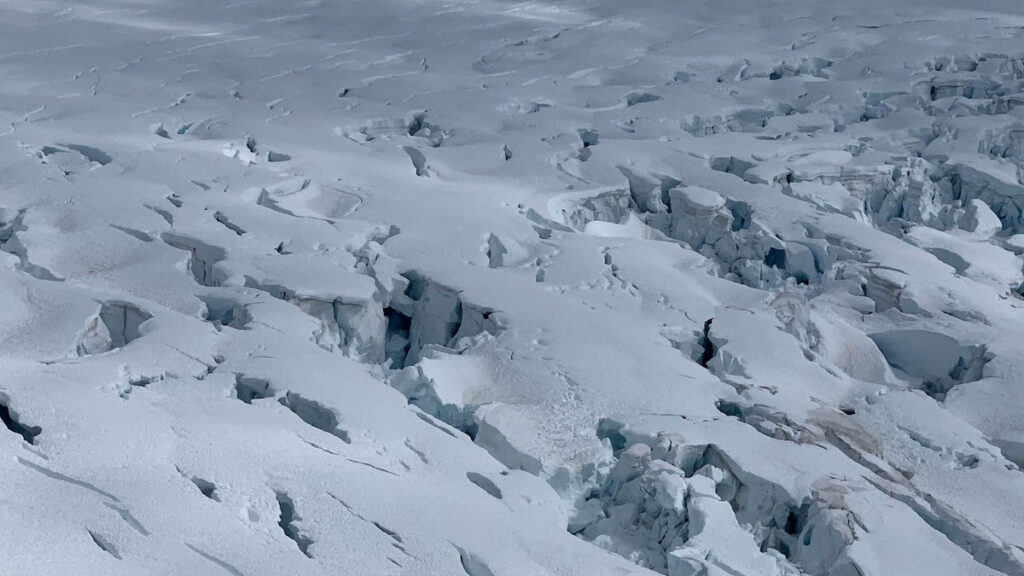
Martin et al. created a model representation of the fast-retreating Pine Island Glacier in West Antarctica. The ice sheet in their model had a true n value of 4, but they ran model projections using both n = 4 and n = 3. That allowed them to observe how their model would incorrectly predict glacial flow and resulting sea level change, given an incorrect n value.
The researchers modeled glacial retreat for 100 years under both equations with two different glacial melting scenarios. They then modeled glacial recovery for another 300 years. Under a moderate scenario, the n = 3 model underestimated glacial retreat by 18% and sea level change contributions by 21%. Under an extreme melting scenario, the model underestimated sea level contributions by 35%.
Notably, those disparities in glacial retreat and sea level change contribution predictions increased more than would be expected between the two scenarios, potentially increasing the level of uncertainty in current projections of sea level change. The researchers also suggest that incorrect n values may be mistakenly attributed to other physical processes in current ice sheet models.
The results could have far-reaching implications for predictions of future glacial melt and may prompt investigations into its effects on sea level, the authors say. (AGU Advances, https://doi.org/10.1029/2025AV001946, 2026)
—Madeline Reinsel, Science Writer
Citation: Reinsel, M. (2026), Glaciers may flow into the ocean more quickly than we think, Eos, 107, https://doi.org/10.1029/2026EO260107. Published on 14 April 2026.
Source: Earth’s Future
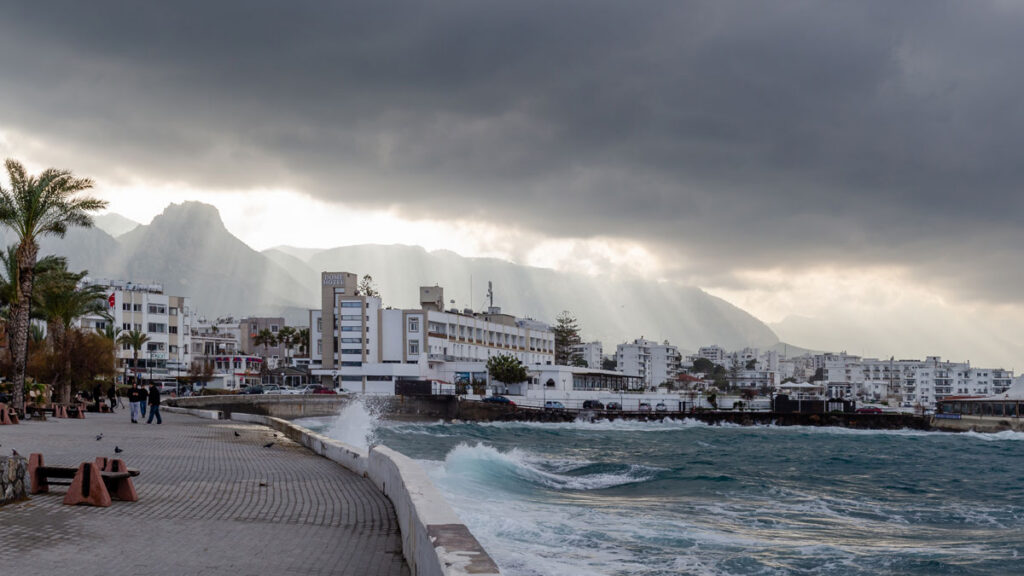
Coastal landscapes are constantly being reshaped by natural forces, and as climate change causes more frequent storms and sea level rise, that change will only intensify. Because these areas are densely populated with homes, tourist destinations, and industries, understanding how and where the coast will change is a pressing issue. However, reliable predictions that lead to actionable knowledge are rare.
Lentz et al. describe the state of knowledge regarding coastal
Coastal landscapes are constantly being reshaped by natural forces, and as climate change causes more frequent storms and sea level rise, that change will only intensify. Because these areas are densely populated with homes, tourist destinations, and industries, understanding how and where the coast will change is a pressing issue. However, reliable predictions that lead to actionable knowledge are rare.
Lentz et al. describe the state of knowledge regarding coastal evolution, highlight gaps in scientists’ understanding, and describe opportunities for integrating information from various models, data sources, and end users.
Current coastal evolution predictions are often focused on too specific a location and are therefore hard to generalize or analyze too large a region and therefore lack detail, the authors say. In addition, it’s challenging for researchers to link the effects of acute events, such as storms, with long-term trends like sea level rise.
Improving these simulations will likely require combining many different types of models, including physics-based numerical models, models based on empirical measurements, and statistical models that include machine learning. To fully understand potential changes, the authors note that it is also essential to consider both coastal processes and human actions.
The researchers recommend several ways to improve consistency and collaboration in the field of coastal change forecasting. First, standardizing approaches and outcomes would make it easier to produce national-scale predictions. Right now, the variety of tools used across different locations makes it difficult for scientists to compare results and communicate effectively. They also emphasize the need for using coordinated research approaches. Stronger transdisciplinary collaboration, accompanied by essential training and support, would also enable scientists to make better predictions, the researchers say.
Comparing predictions to real-world observations of coastal landscape change could also help untangle this multifaceted challenge. By studying how coastlines have already changed, researchers can validate models and choose those that are performing best. Such comparisons require datasets that adequately capture coastal landscape change across both time and space. Remote sensing data and the use of artificial intelligence (AI) for data processing may help provide these improved datasets, the researchers suggest.
Engaging end users during the project planning process is also helpful because only end users truly know what kind of information they need to adapt to landscape change. Knowing how to engage end users can be difficult for physical scientists, but various tools and specialized personnel exist who can help coordinate these interactions, the authors say. (Earth’s Future, https://doi.org/10.1029/2024EF005833, 2026)
The retreat of glaciers and ice sheets is expected to have widespread impacts on communities around the world because of its effect on sea levels. Already, the global average sea level is more than 10 centimeters higher than it was just 3 decades ago; and the rate of rise is increasing, contributing to increased storm surges and flooding, lost infrastructure and community lands, and more.
Recent reports on the instability of Antarctica’s Thwaites Glacier, for example, have focused attention
The retreat of glaciers and ice sheets is expected to have widespread impacts on communities around the world because of its effect on sea levels. Already, the global average sea level is more than 10 centimeters higher than it was just 3 decades ago; and the rate of rise is increasing, contributing to increased storm surges and flooding, lost infrastructure and community lands, and more.
Recent reports on the instability of Antarctica’s Thwaites Glacier, for example, have focused attention on how accelerating ice flow can lead to ice sheet collapse and rising sea levels.
Earth’s ice sheets accumulate ice through snowfall and lose mass through a mix of surface ablation, iceberg calving, and melting at their interface with the ocean. Glacial ice flows under its own weight, and the rate at which it flows to coastal areas is a primary control on ice sheet mass loss.
Flow rates depend on how much resistance an ice sheet encounters at its interface with the ground (e.g., whether it is frozen to its substrate) and on its effective viscosity, a measure of how strongly it resists deformation. The viscosity of ice, in turn, varies based on properties including temperature, crystal size and orientation, and impurity content.
Some properties within and beneath ice sheets that affect how they flow are anisotropic, meaning they vary by direction. For example, roughness in some directions at the ice bed can facilitate ice sliding more effectively than roughness in other directions, similar to the way a properly oriented corrugated metal roof allows snow to slide off. Several forms of anisotropy within ice also affect how ice flows from land to ocean (Figure 1).
Fig. 1. Anisotropy in glaciers and ice sheets has various sources, including from ice fabric and other properties within the ice (englacial) or at the ice-bed interface. Many forms of anisotropy in glacial ice can be measured with radar. Credit: Adapted from Hills et al., 2025, https://doi.org/10.1029/2024RG000842, CC BY 4.0
Measuring anisotropic properties is key to better understanding how quickly changes at the edges of the Greenland and Antarctic ice sheets will lead to sea level rise. Recent advances in ice-penetrating radar technology and in processing radar data are revolutionizing how we observe directionally varying ice sheet properties, paving the way for projections of mass changes that account for previously neglected processes.
Crystal Fabric: Memory and Modulator of Ice Flow
Fabric, the orientation of crystals composing ice, is the best studied and arguably most important of anisotropic ice sheet properties. As ice deforms, for example, by stretching horizontally as it flows toward the coast, its millimeter-scale crystals are reoriented (Figure 1).
Fabric thus contains a memory of past flow. Simultaneously, fabric influences flow because ice crystals are about 3 orders of magnitude easier to shear in some directions than others—similar to how stacked playing cards slide easily against each other when held along their edges but resist motion when pinched top to bottom.
Over the past 20 years, radar polarimetry has matured into a quicker and easier alternative means for inferring fabric.
The potential importance of fabric on large-scale ice flow has long been recognized, but a shortage of observations has made it difficult to quantify and validate its effect in ice sheet models. Until recently, fabric could be measured only directly in ice cores or inferred through seismic soundings. These methods provide highly detailed information about how fabric develops but are expensive, logistically taxing, and provide information only about sparse point locations.
Over the past 20 years, though, radar polarimetry has matured into a quicker and easier alternative means for inferring fabric, enabling observations at the scale of entire glaciers and providing new constraints on how fabric influences ice sheet flow.
How Radar Reveals Fabric
Ice-penetrating radar instruments emit electromagnetic energy as radio frequency waves. These waves reflect off interfaces within and beneath glacial ice, including transitions in ice chemistry and the contact surface between the ice sheet and the ground or water below. The properties of the reflected waves are then measured when they return to the radar. Just as fabric leads to anisotropic ice deformation, it also introduces directional dependence in the measured electrical properties.
The speed of a radar wave through an ice crystal is approximately 1% faster if the wave is polarized across the crystal’s principal (c) axis rather than aligned with it. Though small, this difference can compound enough that it causes measurable changes in returned radar signals.
In a typical radar survey over anisotropic ice, waves with different polarizations travel at slightly different speeds (Figure 2). The times that return signals arrive back at the receiver thus vary directionally, a difference that can be identified using polarimetric radars that transmit and receive radio waves at multiple orientations.
Fig. 2. Propagation of polarized radio waves through anisotropic ice reveals structural variations with depth because waves aligned across the prevailing ice fabric (represented by the ball, in which darker shading indicates a greater concentration of c axes) travel faster than waves aligned with the fabric. The phase delay increases as the effect of the anisotropy accumulates with depth. Credit: Adapted from Hills et al., 2025, https://doi.org/10.1029/2024RG000842, CC BY 4.0
Fabric’s effect on radar signal travel times accumulates through an ice column, so it is more prominent in thicker ice with stronger horizontal fabric (i.e., the ice crystals are more consistently aligned). In such cases, differences in travel times between polarizations can be measured even by standard radars.
When fabric is weaker or ice is thinner, the offset is smaller and detectable only by systems that can identify the phases of radar returns—that is, the exact positions of the returned waves in their oscillation cycle. Even small wave speed differences from weak fabrics accumulate into measurable phase shifts between polarizations, which can be used to determine the consistency of crystal alignment and the predominant crystal orientation.
Small differences in fabric through an ice column can also change the strength, or amplitude, of returned signals. This amplitude difference offers an independent way to identify fabric orientation and its depth variation.
Polarimetric radar has been widely applied in cryospheric science in recent years largely due to the advent of low-cost systems that can measure signal phases. For example, the popular Autonomous phase-sensitive Radio Echo Sounder (ApRES) is a lightweight, ground-based system that can be used to infer ice fabric at single points down to 2 kilometers deep. In the past decade, polarimetric ApRES systems have revealed ice flow histories, including changes in flow directions, of key glaciers over the past few millennia. These measurements offer windows into how ice sheets responded to previous climate variations.
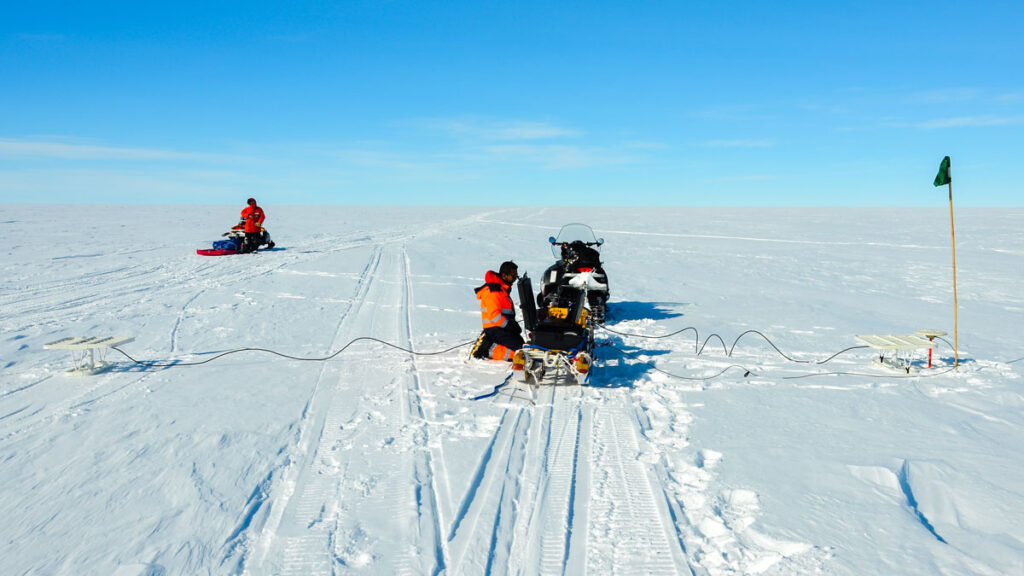
A mobile, quad-polarimetric radar is dragged by snowmobile over the surface of Müller Ice Cap on Axel Heiberg Island in Nunavut, Canada, in May 2023. Credit: David Lilien
The next generation of polarimetric radars go beyond one-point-at-a-time stationary soundings, offering full polarimetry capabilities on moving platforms. These systems may soon allow scientists to map directional ice properties at the scale of entire ice sheets.
Insights into Fast-Flowing Ice Fabric
The growing number of radar studies conducted near sites where ice cores have been collected, which allow fabric to be investigated up close, has provided validation and bolstered confidence that fabric can be inferred accurately from its effects on radar. Researchers now infer fabric from radar in more dynamic areas, such as Thwaites Glacier, Whillans Ice Stream, and the Northeast Greenland Ice Stream (NEGIS), where ice fabrics change over short spatial scales and where drilling ice cores is logistically difficult. Airborne radar surveys are particularly effective in these settings because they can efficiently map fabric variations across large, fast-moving areas.
Observations of strong fabrics in fast-flowing regions suggest that fabric is an important control on ice viscosity, although its implications for ice flow are just beginning to be explored. For example, at Rutford Ice Stream in Antarctica, ApRES data indicate that fabric causes sharp changes in viscosity in different directions with depth, a complexity not captured by current ice flow models.
A combination of airborne and ground-based radar shows that the fabric of the NEGIS varies substantially across the ice stream, which facilitates horizontal shear that allows faster and more cohesive flow in the middle of the ice stream while simultaneously stiffening this ice against along-flow stretching. These viscosity variations may alter how quickly coastal changes, such as increased melt due to climate warming, influence inland ice flow.
Scientists have studied ice sheet mass balance at glacier-mounted stations along the renowned “K-transect” near Kangerlussuaq in southwestern Greenland since the early 1990s. This image shows a view up the transect in April 2025. Polarimetric radar offers another tool with which to study ice flow here and at other locations on the ice sheets. Credit: Tamara Gerber
The emerging consensus from radar observations and recent progress in fabric modeling is that ice fabric can soften ice stream shear margins by a factor of 10. In other words, the fabric tends to develop in a way that greatly reduces the ice’s effective viscosity at lateral boundaries between fast-flowing and slower-flowing ice, which enables the ice to deform more easily at the margins. The agreement between observations and process-scale modeling highlights fabric as a major, but largely ignored, control on ice flow that may affect estimates of how ice dynamics will contribute to future sea level rise.
Beyond Fabric
Most polarimetric radar studies so far have focused on fabric, but other ice characteristics can cause directional effects too. For instance, bubbles trapped in ice have dramatically different properties than ice itself. Ice deformation can bring bubbles into alignment, such that they affect radar waves differently in different directions.
Likewise, ice at its melting point can contain liquid water along boundaries between crystals, and if those pockets of water are aligned in one direction, they can also affect radar returns. Each of these properties has important influences on ice flow, but their implications are yet to be explored.
Another source of anisotropy is the bottom boundary of the ice sheet. This interface can be rougher in some directions than others, though the roughness is typically aligned with the prevailing ice flow direction or the direction of meltwater trapped within the ice.
Polarimetric radar can measure directionally dependent properties of ice sheet bases at a finer scale than radar profiling can. Such work is leading to new insights into glacier geomorphology, interactions of ice shelf bottoms with the underlying ocean, and how ice slides over substrate surfaces. Rates and extents of sub-ice-shelf melt and basal sliding are widely recognized as key controls on the future of the ice sheets.
Expanding Horizons: Large-Scale and Planetary Applications
Radar polarimetry has already transformed our understanding of ice fabric, revealing much about how crystal alignment modulates the flow of Earth’s ice sheets and filling critical gaps between the handful of direct measurements from ice cores. As polarimetric techniques mature, their applications are expanding.
Researchers are moving from studying isolated profiles of ice fabric to mapping it across whole basins, a key shift for validating bespoke models of fabric and its effects on flow. These models are also rapidly developing to include additional physical processes (e.g., migration recrystallization) and key simplifications (e.g., reducing directionally varying viscosity to a single number) that allow them to interface more easily with—and be incorporated into—large-scale models used for projecting sea level rise.
Techniques pioneered for measuring ice on Earth may also prove useful elsewhere in the solar system.
Techniques pioneered for measuring ice on Earth may also prove useful elsewhere in the solar system. Orbital radar sounders have already probed Mars’s ice masses, and the icy shell of Jupiter’s moon Europa will soon be surveyed by single-polarization radars aboard NASA’s Europa Clipper and the European Space Agency’s Jupiter Icy Moons Explorer (JUICE). These radars might be useful for polarimetry at some locations on Europa, which could reveal past and present motion of ice features and answer fundamental questions about the moon. Whether Europa’s shell flows, for example, may be key to whether its subsurface ocean can harbor life.
As polarimetric radar systems become routine tools for glaciologists and as similar instruments begin operating on spacecraft exploring icy worlds, a technique once limited to a few isolated core sites on Earth could be poised to transform our understanding of ice across the solar system.
Author Information
David Lilien (dlilien@iu.edu), Indiana University Bloomington; T. J. Young, University of St Andrews, Fife, Scotland; Benjamin Hills, Colorado School of Mines, Golden; Tamara Gerber, Université de Lausanne, Lausanne, Switzerland; and Matthew Siegfried, Colorado School of Mines, Golden
Citation: Lilien, D., T. J. Young, B. Hills, T. Gerber, and M. Siegfried (2026), New directions in mapping ice sheet fabrics and flow, Eos, 107, https://doi.org/10.1029/2026EO260154. Published on 14 May 2026.
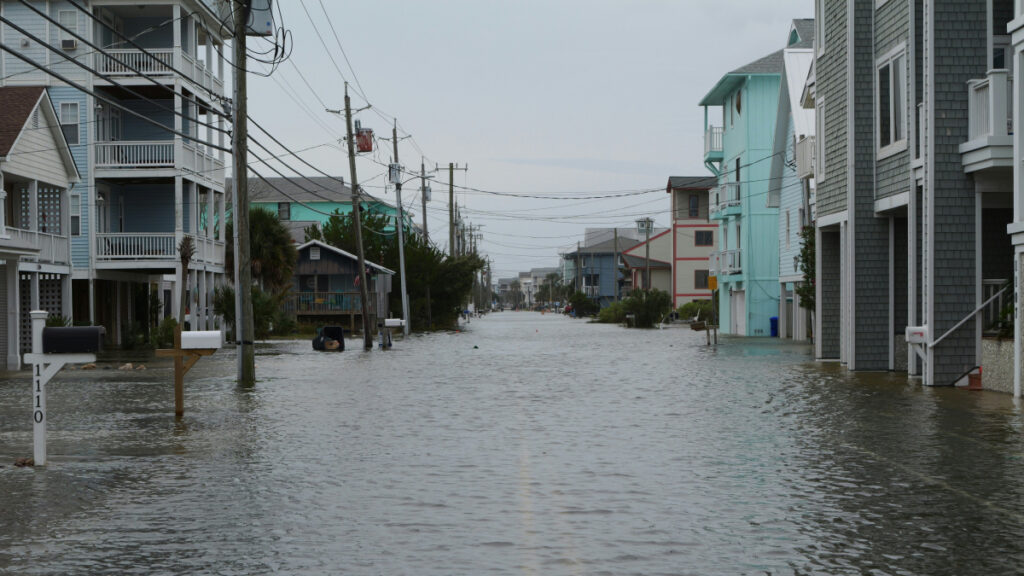
Since the beginning of the 20th century, global sea level has risen by about 20 centimeters (roughly 8 inches) [Fox-Kemper et al., 2021]. As a result, coastal and island communities around the world are experiencing more frequent high-tide flooding, worsening storm surges, and increasing damage to homes and infrastructure. In the United States, for example, human-caused sea level rise alone increased damages from 2012’s Hurricane Sandy by about $8 billion [Strauss et al., 2021].
The United S
Since the beginning of the 20th century, global sea level has risen by about 20 centimeters (roughly 8 inches) [Fox-Kemper et al., 2021]. As a result, coastal and island communities around the world are experiencing more frequent high-tide flooding, worsening storm surges, and increasing damage to homes and infrastructure. In the United States, for example, human-caused sea level rise alone increased damages from 2012’s Hurricane Sandy by about $8 billion [Strauss et al., 2021].
The United States has long been a key member of the global climate research community. However, that role is now threatened.
Scientific understanding of the magnitudes and rates of sea level rise, of how they vary around the planet, and of why the ocean is rising is based on a body of rigorous research that, for decades, has tracked past and present sea levels and projected future rise.
The United States has long been a key member of the global climate research community, including in producing the wealth of sea level research that has informed countries, states, and communities of what lies ahead for their shorelines. However, that role is now threatened by the Trump administration’s attacks on the country’s scientific research enterprise broadly and on climate research especially.
Analysis of the evolution of sea level rise projection science [Garner et al., 2018] underscores both the country’s prominent past role in the field and how the ongoing attacks may undermine progress in our understanding of sea level change. It also points to the urgency of acting across multiple fronts to preserve scientific knowledge and prevent further harm to the capacity to measure and project how much and how fast rising seas will affect global coastlines.
Four Decades of Advancing Sea Level Science
By the late 1970s, scientists around the world had begun to recognize the growing threat that climate change posed to the Greenland and Antarctic ice sheets and the danger their melting presented to coastal regions [Mercer, 1978]. The first global mean sea level (GMSL) projections were published in 1982 [Gornitz et al., 1982], and the first planning-oriented sea level scenarios were published just a few years later [e.g., National Research Council, 1987].
Since 1982, 103 studies have produced GMSL projections [Garner et al., 2018]. About one third of the studies (33 in total), including the first five, were published by teams led by scientists at U.S. institutions (Figure 1). Thirty-three studies (some, but not all, of which were also led by U.S.-based scientists) have also benefited from U.S. federal funding, sometimes from multiple agencies (Figure 2), including the National Science Foundation (NSF; 16 studies), NASA (10 studies), NOAA (8 studies), the U.S. Department of Energy (DOE; 6 studies), the U.S. Department of Defense (3 studies), the U.S. Geological Survey (2 studies), and the EPA (2 studies).
Fig. 1. This time series shows the total number of sea level rise projection studies published each year from 1982 to 2025 (gray bars) and the number of studies each year that were led by scientists based at U.S. institutions (purple bars). The text at top left tabulates the total number of studies led by authors in each country or region listed.Fig. 2. The total number of sea level rise projection studies published each year from 1982 to 2025 is shown again here (gray bars), this time beside the number of studies each year that were supported by funding from various U.S. federal science agencies (stacked colored bars). Note that some studies were supported by more than one U.S. federal agency.
U.S. scientists have further played critical roles in developing GMSL projections for Intergovernmental Panel on Climate Change (IPCC) assessments. For example, chapters producing sea level projections for the IPCC Fifth Assessment Report [Church et al., 2013], the IPCC Special Report on the Ocean and Cryosphere in a Changing Climate [Oppenheimer et al., 2019], and the IPCC Sixth Assessment Report (AR6) [Fox-Kemper et al., 2021] were all coled by U.S.-based scientists.
Meanwhile, U.S. funding has been essential to the IPCC, constituting more than 25% of the nearly $207 million invested globally in the organization from 1989 to 2024 [IPCC, 2025]. NASA also played a key role in making IPCC AR6 sea level projections more accessible and usable through the NASA/IPCC Sea Level Projection Tool [Kopp et al., 2023; Fox-Kemper et al., 2021; Garner et al., 2021], which supports local assessments of sea level change around the world and has about 400,000 users annually.
U.S. institutions have been vital in developing, hosting, and maintaining critical sea level datasets.
Beyond direct contributions of U.S. scientists and federal funding to the global scientific community’s sea level projection research, U.S. institutions have been vital in developing, hosting, and maintaining critical sea level datasets. For example, the University of Hawai‘i Sea Level Center is a crucial part of the Global Sea Level Observing System, operating a network of more than 90 tide gauge stations and supporting global real-time oceanographic operations and long-term climate studies. NASA satellite missions, including TOPEX/Poseidon and the Gravity Recovery and Climate Experiment (GRACE and GRACE-FO), have been instrumental in helping to measure changes in GMSL and ice sheets, providing new ways to assess the accuracy of global sea level projections [Törnqvist et al., 2025]. And the Sea Level Research Group at the University of Colorado has consistently processed such datasets, providing critical data access for the broader research community.
Efforts to apply climate science in U.S. policy have been hindered not only by political polarization and proposed funding cuts but also by deliberate suppression of data and research.
Efforts to apply climate science in U.S. policy have been hindered not only by political polarization and proposed funding cuts but also by deliberate suppression of data and research. Broadly, the current U.S. administration has removed more than 2,000 datasets from federal platforms, and more specifically, it has systematically scrubbed climate-related content from agency websites. Such erasures disrupt public access to critical information and undermine scientific transparency.
Furthermore, the DOE published a report that without conducting any statistical analysis, denied the scientific evidence for sea level acceleration. It similarly claimed, without any analysis of the numerous sea level projection studies documented here, that sea level is “rising at a lower rate than predicted.” The EPA went further, falsely claiming that “aggregate sea level rise has been minimal.” In fact, the most recent IPCC sea level projections are in good agreement with observations [Törnqvist et al., 2025; Dessler and Kopp, 2025].
The U.S. scientific community now stands at a precipice. Efforts to dismantle federal scientific agencies and diminish research are eroding the United States’ foundational contributions to our knowledge of global change and sea level rise.
The Path to Preserving Critical Science
As we plummet toward a loss of data, expertise, and innovation, we face a future that would not only further damage the United States’ reputation for scientific excellence and transparency but also cripple the global sea level research community at a time when the risks from sea level rise are rapidly increasing [Fox-Kemper et al., 2021].
While some U.S.-based sea level scientists could move to countries more committed to climate science, there are not enough positions in the world nor enough mobility for the vast majority to relocate. Grassroots archiving efforts have helped preserve some critical datasets, but this is a temporary and often insufficient stopgap. An urgent need remains for resilient and transparent scientific infrastructure, so that U.S. taxpayer–funded research findings and datasets are, and remain, publicly accessible.
Historically, federally funded scientific initiatives have enjoyed strong support across the political spectrum in the United States.
Historically, federally funded scientific initiatives have enjoyed strong support across the political spectrum in the United States. However, the unprecedented hostility facing science in the country today has revealed that new institutional safeguards and legal protections to prevent political interference are critically needed.
Expanding collaborations between U.S. universities and private foundations and donors provides one potential route to providing some protection and improving long-term stability for sea level science data and initiatives. Climate Central’s Surging Seas project offers one model to emulate. However, philanthropic efforts are far from sufficient to preserve the U.S. scientific enterprise.
Another avenue to protect federally funded science from political pressure is through bipartisan legislation. Bills such as the Scientific Integrity Act (which aims to ensure that scientific findings are not influenced or altered by political pressure) and the Protect America’s Workforce Act (which aims to restore collective bargaining rights for unionized federal employees) represent such opportunities.
Yet the effectiveness of such legislative efforts hinges on the critical caveat that the people holding authority in government recognize and abide by enacted legislation. Under an executive who does not abide by the rule of law, such legislative efforts, even if they are passed successfully, will offer little actual protection. The path to preserving U.S. climate and sea level science, therefore, cannot be separated from the path to restoring the rule of law within the U.S. government.
Progressing on this front requires the scientific community to advocate for its priorities more vocally and to build coalitions that include both academics and the stakeholders who benefit from scientific climate projections. It also requires making use of tools and levers that many scientists are unaccustomed to, such as the court system. AGU and other institutions have modeled this approach over the past year, joining legal efforts to protect federal workers, for example, and speaking up against the dismantling of valued science agencies.
Restoring the rule of law also requires electoral organizing to reestablish Congress as an independent and coequal branch of government that wields, rather than abdicates, lawful oversight of administration officials and federal agencies.
Scientific understanding of sea level processes and projections of future changes inform local, national, and international decisionmaking and provide a pathway to resilience against the risks of rising coastal waters. Safeguarding the long-standing leadership, integrity, and continuity of U.S. climate and sea level science is both a national and global imperative—one that many scientists are already stepping up to support. Now we need the rest of the scientific community—and its allies in academia, philanthropy, industry, and the public—to join in.
Acknowledgments
The authors thank Amy Appollina and Jessica Slotter for their assistance in curating a database of global sea level rise projections.
References
Church, J. A., et al. (2013), Sea level change, in Climate Change 2013: The Physical Science Basis. Contribution of Working Group I to the Fifth Assessment Report of the Intergovernmental Panel on Climate Change, edited by T. F. Stocker et al., pp. 1,137–1,216, Cambridge Univ. Press, Cambridge, U.K., https://doi.org/10.1017/CBO9781107415324.026.
Fox-Kemper, B., et al. (2021), Ocean, cryosphere and sea level change, in Climate Change 2021: The Physical Science Basis. Contribution of Working Group I to the Sixth Assessment Report of the Intergovernmental Panel on Climate Change, edited by V. Masson-Delmotte et al., pp. 1,211–1,362, Cambridge Univ. Press, Cambridge, U.K., https://doi.org/10.1017/9781009157896.011.
Garner, A. J., et al. (2018), Evolution of 21st century sea level rise projections, Earth’s Future, 6, 1,603–1,615, https://doi.org/10.1029/2018EF000991.
Garner, G. G., et al. (2021), IPCC AR6 Sea Level Projection Tool, NASA Sea Level Change Portal, sealevel.nasa.gov/data_tools/17.
Kopp, R. E., et al. (2023), The Framework for Assessing Changes To Sea-level (FACTS) v1.0: A platform for characterizing parametric and structural uncertainty in future global, relative, and extreme sea-level change, Geosci. Model Dev., 16, 7,461–7,489, https://doi.org/10.5194/gmd-16-7461-2023.
Mercer, J. (1978), West Antarctic ice sheet and CO2 greenhouse effect: A threat of disaster, Nature, 271, 321–325, https://doi.org/10.1038/271321a0.
National Research Council (1987), Responding to Changes in Sea Level: Engineering Implications, Natl. Acad. Press, Washington, D.C.
Oppenheimer, M., et al. (2019), Sea level rise and implications for low-lying islands, coasts and communities, in IPCC Special Report on the Ocean and Cryosphere in a Changing Climate, edited by H.-O. Pörtner et al., pp. 321–445, Cambridge Univ. Press, Cambridge, U.K., https://doi.org/10.1017/9781009157964.006.
Strauss, B. H., et al. (2021), Economic damages from Hurricane Sandy attributable to sea level rise caused by anthropogenic climate change, Nat. Commun., 12, 2720, https://doi.org/10.1038/s41467-021-22838-1.
Törnqvist, T. E., et al. (2025), Evaluating IPCC projections of global sea-level change from the pre-satellite era, Earth’s Future, 13, e2025EF006533, https://doi.org/10.1029/2025EF006533.
Author Information
Andra J. Garner (garnera@rowan.edu), Department of Environmental Science, Rowan University, Glassboro, N.J.; Robert E. Kopp, Department of Earth and Planetary Sciences and Rutgers Climate and Energy Institute, Rutgers University, New Brunswick, N.J.; Gregory G. Garner, Glassboro, N.J.; Aimée B. A. Slangen, Department of Estuarine and Delta Systems, Royal Netherlands Institute for Sea Research, Yerseke; and Benjamin P. Horton, School of Energy and Environment, City University of Hong Kong
Citation: Garner, A. J., R. E. Kopp, G. G. Garner, A. B. A. Slangen, and B. P. Horton (2026), The global impact of losing U.S. sea level science, Eos, 107, https://doi.org/10.1029/2026EO260156. Published on 15 May 2026.
This article does not represent the opinion of AGU, Eos, or any of its affiliates. It is solely the opinion of the author(s).
Source: Earth’s Future
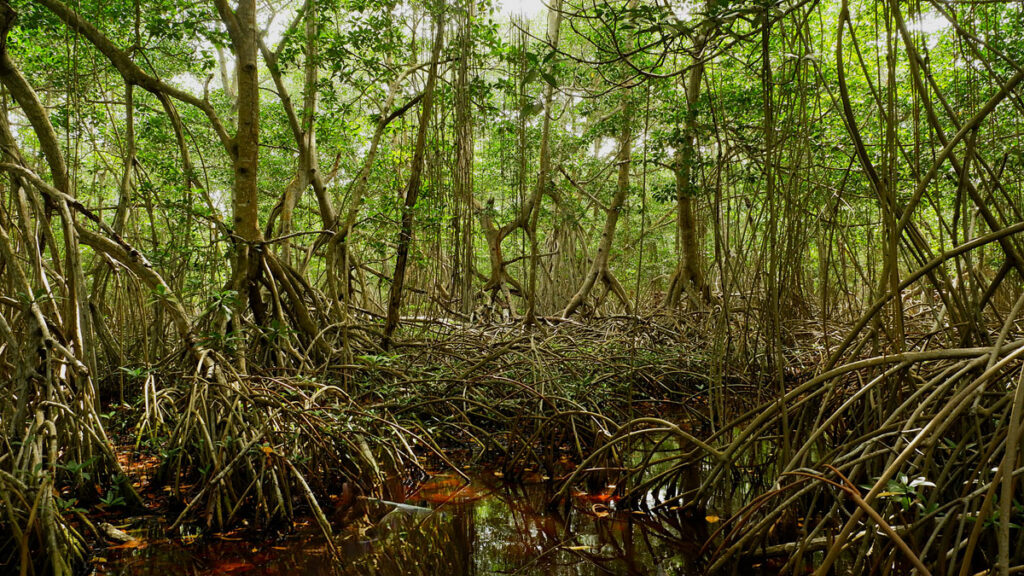
Mangrove forests straddle the edge of land and sea along some tropical and subtropical coastlines. These trees and shrubs have distinctive tangles of roots that trap sediment and produce organic matter, forming dense soils and efficiently storing carbon. Though mangroves cover only 1% of Earth’s surface, they store a whopping 15% of global ocean carbon in their trapped soils.
Their location along coastlines means mangroves are at the mercy of changing sea levels and
Mangrove forests straddle the edge of land and sea along some tropical and subtropical coastlines. These trees and shrubs have distinctive tangles of roots that trap sediment and produce organic matter, forming dense soils and efficiently storing carbon. Though mangroves cover only 1% of Earth’s surface, they store a whopping 15% of global ocean carbon in their trapped soils.
Their location along coastlines means mangroves are at the mercy of changing sea levels and sediment availability. Rising sea levels can drown mangroves or push them landward. At the same time, sediment supplies, belowground root growth, and organic matter accumulation can help build up mangrove soils, allowing forests to keep pace with sea level rise. So over time, will mangroves keep locking carbon into their soils, or will they start losing it?
Iwantoro et al. created a new model that examines the links between coastal processes to investigate vegetation growth and carbon accumulation in mangrove forests.
The researchers modeled a simplified tidal embayment to explore how different rates of sea level rise and sediment supplies would affect the mangroves. In these experiments, they found that carbon accumulation can increase at specific locations as waters rise because the increased water can lead to more mangrove growth—a result that matches existing data. However, when looking at landscape scales, they found sea level rise generally reduces total carbon sequestration through mangrove loss and soil erosion. The results showed that rising sea levels can alter mangroves from carbon storage sinks to carbon emitters.
The findings demonstrate that local trends in carbon sequestration may not be representative of larger-scale outcomes in mangrove forests. The study shows that understanding coastal landscapes as an interconnected system is crucial to understanding how mangroves can respond to climate and human-induced pressures, the researchers say. However, new assessments and approaches are needed to better understand future mangrove vulnerabilities. (Earth’s Future, https://doi.org/10.1029/2025EF006984, 2026)
Citation: Derouin, S. (2026), Mangroves may be losing their grip on carbon storage as sea levels rise, Eos, 107, https://doi.org/10.1029/2026EO260144. Published on 5 June 2026.
Research & Developments is a blog for brief updates that provide context for the flurry of news that impacts science and scientists today.
The key word here is could. Experts including Ken Graham, the director of NOAA’s National Weather Service, all emphasize that no two El Niños are alike.
“Each one is unique with its own imprint on our weather,” Graham said in a NOAA press release. However, scientists have learned a few things from watching the ways that this warm phase of a nat
Research & Developments is a blog for brief updates that provide context for the flurry of news that impacts science and scientists today.
The key word here is could. Experts including Ken Graham, the director of NOAA’s National Weather Service, all emphasize that no two El Niños are alike.
“Each one is unique with its own imprint on our weather,” Graham said in a NOAA press release. However, scientists have learned a few things from watching the ways that this warm phase of a natural climate cycle over the tropical Pacific has affected our weather patterns in the past.
“Advanced monitoring and an improved understanding of El Niño patterns allow the NWS to better predict and better prepare the public and our core partners for what is to come,” Graham said.
This morning, NOAA released an El Niño Advisory, announcing that the climate phenomenon (the warm phase of the El Niño–Southern Oscillation) has officially arrived in the tropical Pacific. The agency forecasts a 63% chance of a “very strong” El Niño from November 2026 to January 2027 that “would rank among the largest El Niño events in the historical record.”
NOAA defines a “very strong” El Niño as when the Pacific’s surface waters are more than 2°C warmer than average. The agency doesn’t use the phrase “Super El Niño,” but there have only been three such “super” or “very strong” El Niño events since 1980. The last one was in 2015.
What does this mean for climate, for humans, and marine species? Here’s a roundup of some potential forecasted effects—some good, some bad—of the weather pattern that’s been making headlines over the past few months.
1. More rain and snow in the southern U.S.
In a typical year, a warm pool of water in the equatorial Pacific would be transported westward—away from the western coast of the Americas—by trade winds. But during an El Niño event, those trade winds weaken, and the warm pool of water extends east, explained Ariel Cohen, the meteorologist in charge of the National Weather Service’s Los Angeles and Oxnard Office in a press briefing at the Aquarium of the Pacific in Long Beach, Calif.
This warm water “causes jet energy in the atmosphere to bring disturbed weather southward across the southern United States, which can bring wetter than normal conditions to our area with drier conditions farther to the north,” Cohen said.
The southward shift of the storm track could also lead to drier conditions over the northern Rockies and as far east as the Ohio and Tennessee Valleys.
2. More shark and whale sightings off the Southern California coast
In the past, strong El Niños have led to decreased amounts of plankton in the Pacific, particularly the open ocean, forcing species that rely on plankton (and the species that rely on the species that rely on plankton, and so forth) to widen their net when searching for food.
“[Plankton] is important because that’s the base of the food web,” explained Andrew Leising, a research oceanographer at NOAA, at the Aquarium of the Pacific. “Marine mammals and other migratory species end up being closer to shore, because they’re going to where their food is.”
Whales in particular rely on the upwelling of cold water to bring them krill to eat. As they are driven nearer to the coast in search of food, they also grow more likely to become entangled in fishing nets.
3. A milder Atlantic hurricane season
Warm water is a key ingredient in a hurricane, so it might seem, at first thought, that the Pacific’s unusually warm waters might augur a more extreme hurricane season. But another effect of El Niño is that it strengthens vertical wind shear over the Atlantic. When winds are too strong, they can tear a storm apart before it picks up the momentum to become a hurricane.
“Wind shear is good for us, bad for the hurricanes,” Phil Klotzbach, a hurricane forecaster at Colorado State University and lead author of the university’s 2026 Atlantic Hurricane Forecast, told Eos.
NOAA’s 2026 Atlantic Hurricane Forecast suggests that the 2026 season has a 55% chance of being below normal, and will likely include 8 to 14 named storms with winds of at least 39 miles per hour.
4. Fewer squid along the California coast
Past El Niño events have shown that warmer Pacific waters can increase the likelihood of harmful algal blooms. Among other effects, these blooms can lead to a lower abundance, and a northward shift, of market squid. Market squid and Dungeness crab bring the most volume and value to California’s commercial fisheries.
In 2014, a large mass of hot water in the Pacific known as the Blob was followed up by an El Niño event. That year, “we had several closures of crab and shellfish fisheries due to harmful algal blooms,” Leising said.
However, Leising also explained that the warm patch of water in the Pacific this year is much smaller and farther from shore than the Blob was in 2014. So, though we may see effect similar those in 2014, they’re likely to be less extreme.
In addition, the same conditions driving sharks and whales toward the coast could also drive tuna toward the coast, leading to increased opportunities for that fishery.
5. More high-tide flooding on U.S. coasts
With El Niño shifting the Pacific jet stream south of its usual position, sea levels along the U.S. West Coast may rise, exacerbating the existing sea level rise linked to climate change. On the East Coast, the jet stream shift can lead to more storm surges, which combine with higher-than-typical precipitation levels.
“It usually ends up being a double whammy,” said NOAA oceanographer and high tide flooding expert William Sweet, in a NOAA news story. “The first punch is decades of sea level rise, which has waters close to the brim in many coastal communities. And now with this second punch—a strong El Niño—coastal communities face more frequent, deeper and widespread high tide flooding along both the West and East Coasts.”
6. A bad year for sea lions
El Niño events can have harmful effects on sea lions. Algal blooms can lead to severe illness, or even death, for the pinnipeds. Algal blooms can also kill off fish and cephalopod species (such as market squid) that sea lions rely on for food. During past El Niño events, California sea lions have also experienced lower rates of reproduction and produced smaller pups, Leising said.
“California sea lions are indicator species, meaning they will be one of the first species which may show signs of domoic acid toxicity, respond to changes in their ecosystem, and signal to the public how our oceans and ecosystem are doing,” said Brett Long, vice president of animal care at the Aquarium of the Pacific.
These updates are made possible through information from the scientific community. Do you have a story about science or scientists? Send us a tip at eos@agu.org.
Research & Developments is a blog for brief updates that provide context for the flurry of news that impacts science and scientists today.
Human-driven climate change is driving the rise of sea levels, worsening flood conditions and threatening coastal communities around the world. Not only is sea level rising, but it’s rising faster every year. Understanding the degree to which different processes contribute to sea level, known as the sea level budget, can help scientists better pre
Research & Developments is a blog for brief updates that provide context for the flurry of news that impacts science and scientists today.
Human-driven climate change is driving the rise of sea levels, worsening flood conditions and threatening coastal communities around the world. Not only is sea level rising, but it’s rising faster every year. Understanding the degree to which different processes contribute to sea level, known as the sea level budget, can help scientists better predict where and how quickly sea level will rise under potential climate futures.
But for several decades there has been a “budget gap” between measurements of sea level change and the total estimated contributions from glaciers, polar ice, land storage, and oceans expanding as they heat up (thermospheric expansion). Research published today in Science Advances has helped close that budget gap by incorporating more recent sea level observations, reconciling measurements taken by different instruments, and including recent community estimates of sea level rise and its components.
The new analysis breaks down the drivers of sea level rise from 1960 to 2023. The team found that the largest contributor is heat-driven expansion of seawater, responsible for 43% of sea level rise since 1960. Melting ice contributed the next largest amount of sea level rise: 27% came from mountain glaciers, while 15% came from the Greenland Ice Sheet and 12% from the Antarctic Ice Sheet. Lastly, sea level rose 3% as land reduced its capacity to store water.
Since 1960, 43% of global sea level rise can be attributed to thermal expansion of water, just 3% to a reduction in land water storage, and the remainder from melting ice and glaciers. Credit: Zheng et al., Science Advances (2026)
“For years, there has been a frustrating gap between how much the oceans were observed to be rising and how much we could explain from the individual causes,” John Abraham, an engineer at the University of St. Thomas in St Paul, Minn., and a coauthor on the new research, said in a press release. “This work shows that, with better instruments, processes, and smarter analysis, this knowledge gap can be closed. We can explain sea level rise with greater confidence.”
The researchers also calculated the rate at which sea level has risen since 1960 and how each component factored in. They found that the rate of sea level rise has recently doubled: It was 2 millimeters per year averaged over 1960–2023 and 4 millimeters per year averaged over just 2005–2023. The strongest driver of that doubling is ocean warming, responsible for 41% of the accelerating rate of sea level rise, followed by reduced land water storage (21%).
In the past, glacial melt was the largest contributor to sea level rise before it was overtaken by thermospheric ocean expansion overtook (left). The rate of sea level rise has been speeding up since about 1980, also driven by thermospheric ocean expansion (right). Credit: Zheng et al., Science Advances (2026)
This research demonstrates the importance of maintaining detailed records of sea level rise, collecting new measurements, and not backing away from global change research. With better data on which processes contribute to sea level rise and its acceleration, policymakers and local communities can create informed mitigation strategies that account for future rise.
These updates are made possible through information from the scientific community. Do you have a story about science or scientists? Send us a tip at eos@agu.org.