Normal view

  • ✇Vox
  • Climate change’s worst-case scenario is officially canceled Bryan Walsh
    You’ve probably never heard of the term “RCP 8.5” — the highest-emission scenario used by climate scientists to project the planet’s future. But if you’ve read about climate change, you’ve seen the numbers and nightmarish outcomes it produced: 4°C of warming by 2100, sometimes 5°C, sea level rising multiple feet, parts of the planet too hot for humans. Those numbers shaped a decade and a half of climate journalism, including a lot of my own when I covered climate change at Time magazin
     

Climate change’s worst-case scenario is officially canceled

23 May 2026 at 12:00
Solar farm

You’ve probably never heard of the term “RCP 8.5” — the highest-emission scenario used by climate scientists to project the planet’s future. But if you’ve read about climate change, you’ve seen the numbers and nightmarish outcomes it produced: 4°C of warming by 2100, sometimes 5°C, sea level rising multiple feet, parts of the planet too hot for humans.

Those numbers shaped a decade and a half of climate journalism, including a lot of my own when I covered climate change at Time magazine. I didn’t always know — and didn’t always communicate — that the scenario behind the most apocalyptic, attention-getting findings was largely an attempt to imagine how bad things could get, not a true forecast. But I wasn’t alone. RCP 8.5 was a frequent background presence in climate journalism.

Last month, though, the scientists who built that scenario formally retired it. In a paper published in Geoscientific Model Development, Detlef van Vuuren and more than 40 co-authors eliminated RCP 8.5 from the scenarios that will feed into the Intergovernmental Panel on Climate Change’s (IPCC) Seventh Assessment Report, which is due in 2029. Based on falling clean-energy costs, climate policy, and recent emissions trends, the highest-emissions pathway had become, in their words, “implausible.”

I can understand if your eyes began glazing over as soon as you read “seventh assessment report,” but this shift represents real progress and hope. It means that the apocalyptic climate change future that we’ve been describing for 15 years is officially no longer on the table. Instead, a merely bad climate future — about 2.8°C by 2100 — is now the central scientific estimate. Given how hopeless our climate future has appeared at times, that really does qualify as good news.  

Counting to 8.5

Climate models can’t tell you the future on their own, because how much the planet will warm depends in large part on what humans do. So scientists build scenarios: structured guesses about how the next century might unfold under different assumptions about energy use, growth, and climate policy.

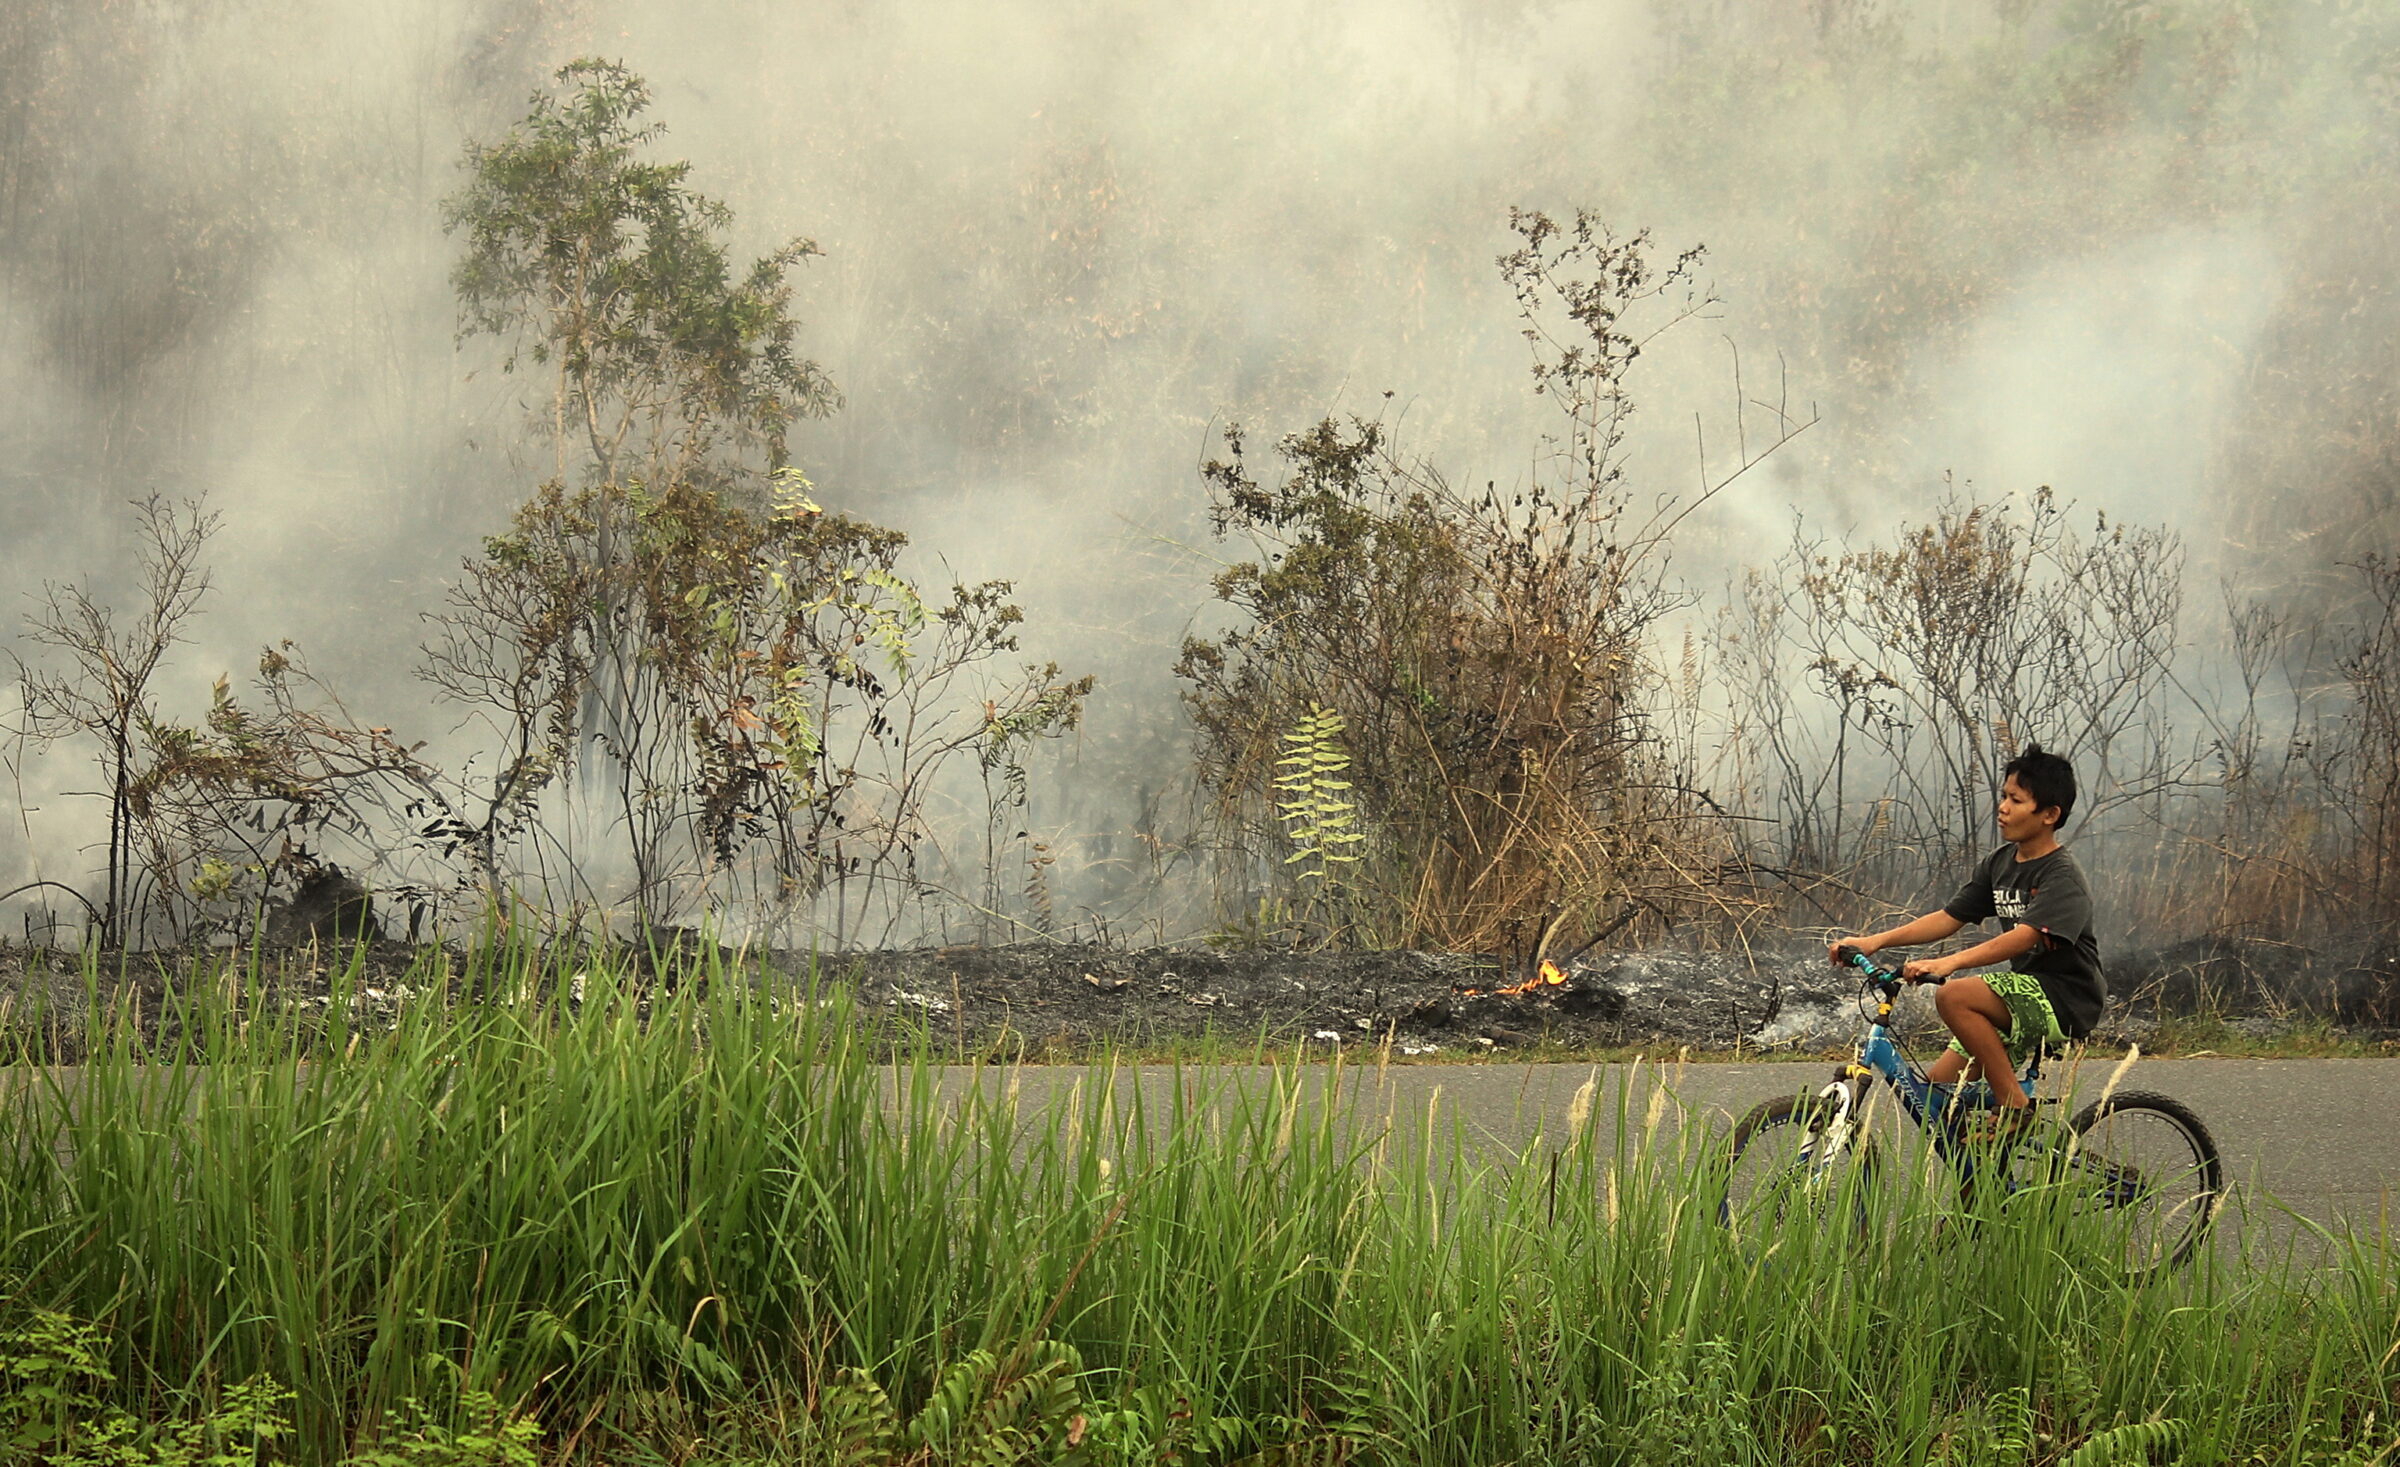
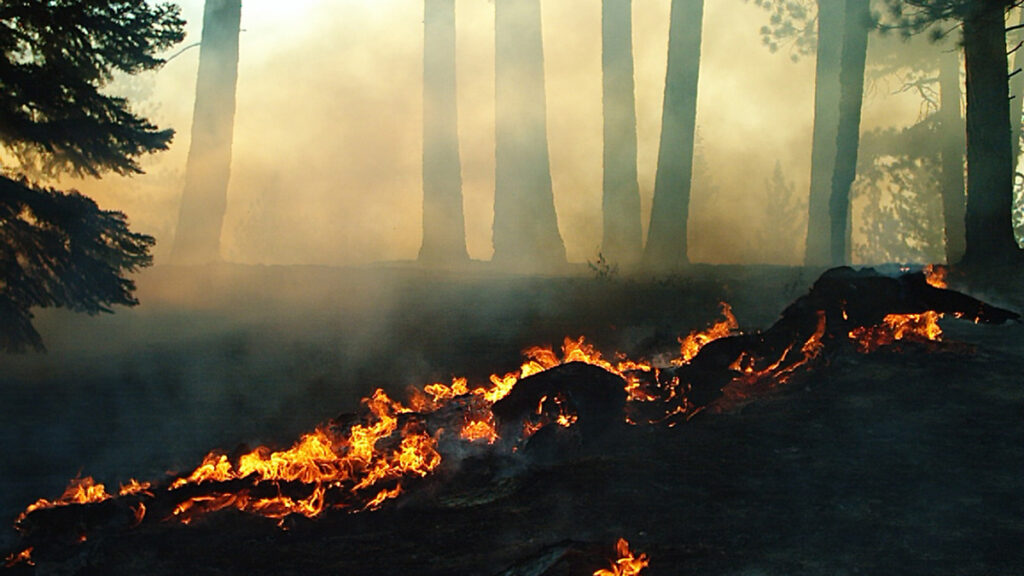
Four such scenarios were introduced in 2011 as the standard set for the IPCC, the international body of scientists that periodically takes stock of global climate research and translates it into reports for governments worldwide. Three of the four were called “mitigation” pathways — futures where the world worked to reduce greenhouse gas emissions. One, the infamous and now obsolete RCP 8.5, was the “no-policy” baseline, a future with continued fossil fuel expansion, coal use roughly five times higher by 2100, and a global population pushing 12 billion. Think of it like Dickens’s Ghost of Christmas Future, a vision of just how bad things could get if we did nothing to change our ways. 

And just like any dystopia, RCP 8.5 guaranteed attention. Between 2011 and 2020, more than 2,000 climate impact studies used RCP 8.5 as their default future. Almost every dramatic projection of crop failure, mass displacement, killing heat, and coastline retreat that any general reader ever encountered in climate change coverage depended on it.

All of those projections were plausible enough under the numbers set by RCP 8.5, but by the mid-2010s, researchers, journalists, and even official government reports were routinely calling the scenario “business as usual,” a phrase that transformed a stress test into something that sounded like a forecast. It wasn’t, and it was never meant to be. Somewhere along the way, though, that distinction got lost.

How the worst case got walked back

The world that RCP 8.5 assumed will never arrive. Global coal use isn’t on a path to quintuple; consumption has largely plateaued after decades of growth. Instead of the global population ballooning to 12 billion people, the UN’s current median forecast projects about 10.2 billion by 2100, with other reputable forecasts putting the number even lower. (All things being equal, fewer people means less emissions.)  

At the same time, the clean energy transition moved faster than almost anyone in 2011 anticipated. The cost of solar power has fallen by about 85 percent since the RCPs were published, and annual global investment in the energy transition is now over $2 trillion. Actual global emissions have tracked far more closely to what you’d expect from a world trying to reduce them than from one doing nothing at all. By 2026, Climate Action Tracker estimated that current policies put the world on course for about 2.6 degrees of warming by 2100 — still serious, but a long way from 4 or 5.

Was RCP 8.5 ever realistic? One camp of experts, led by climate scientist Zeke Hausfather and energy modeler Glen Peters, argues that RCP 8.5 was plausible in 2011, but was taken off the table by genuine policy and technology progress. The other camp, led by Roger Pielke Jr., argues that the rate of global decarbonization has been roughly linear for decades. That would mean we didn’t actively avoid RCP 8.5; it was just never realistic to begin with. Both camps agree on what counts, though: RCP 8.5 should be gone, and the planet is still on track to warm between 2.5° and 3° by 2100. 

RCP 8.5 was as much a climate journalism story as it was a climate science one. In 2017, the writer David Wallace-Wells published “The Uninhabitable Earth” in New York magazine. It was probably the most widely read piece of climate journalism of the last decade, and it was built almost entirely on RCP 8.5 projections. 

Wallace-Wells revised his view in 2022, though there has been relatively little coverage of this year’s retirement of RCP 8.5. And researchers need to catch up: Pielke Jr. estimated that as late as early 2026, 30 new RCP 8.5 studies were coming out each day on average, generating more grist for the climate ultra-doom narrative. We’ll see whether last month’s announcement finally puts it to rest.

The future is in our hands 

But even if we’ve averted doom, there is a lot of work to do to secure a safer future.

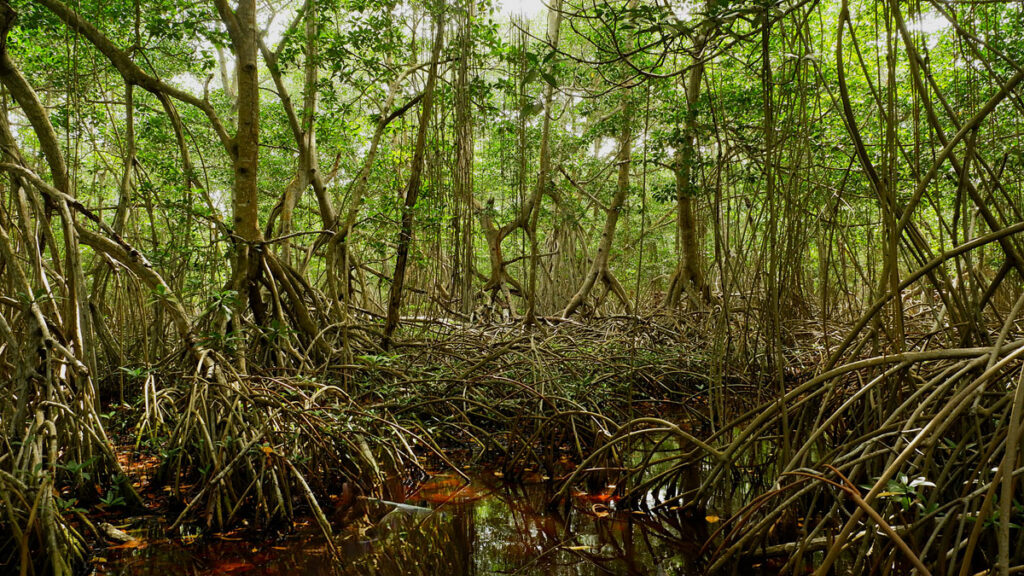
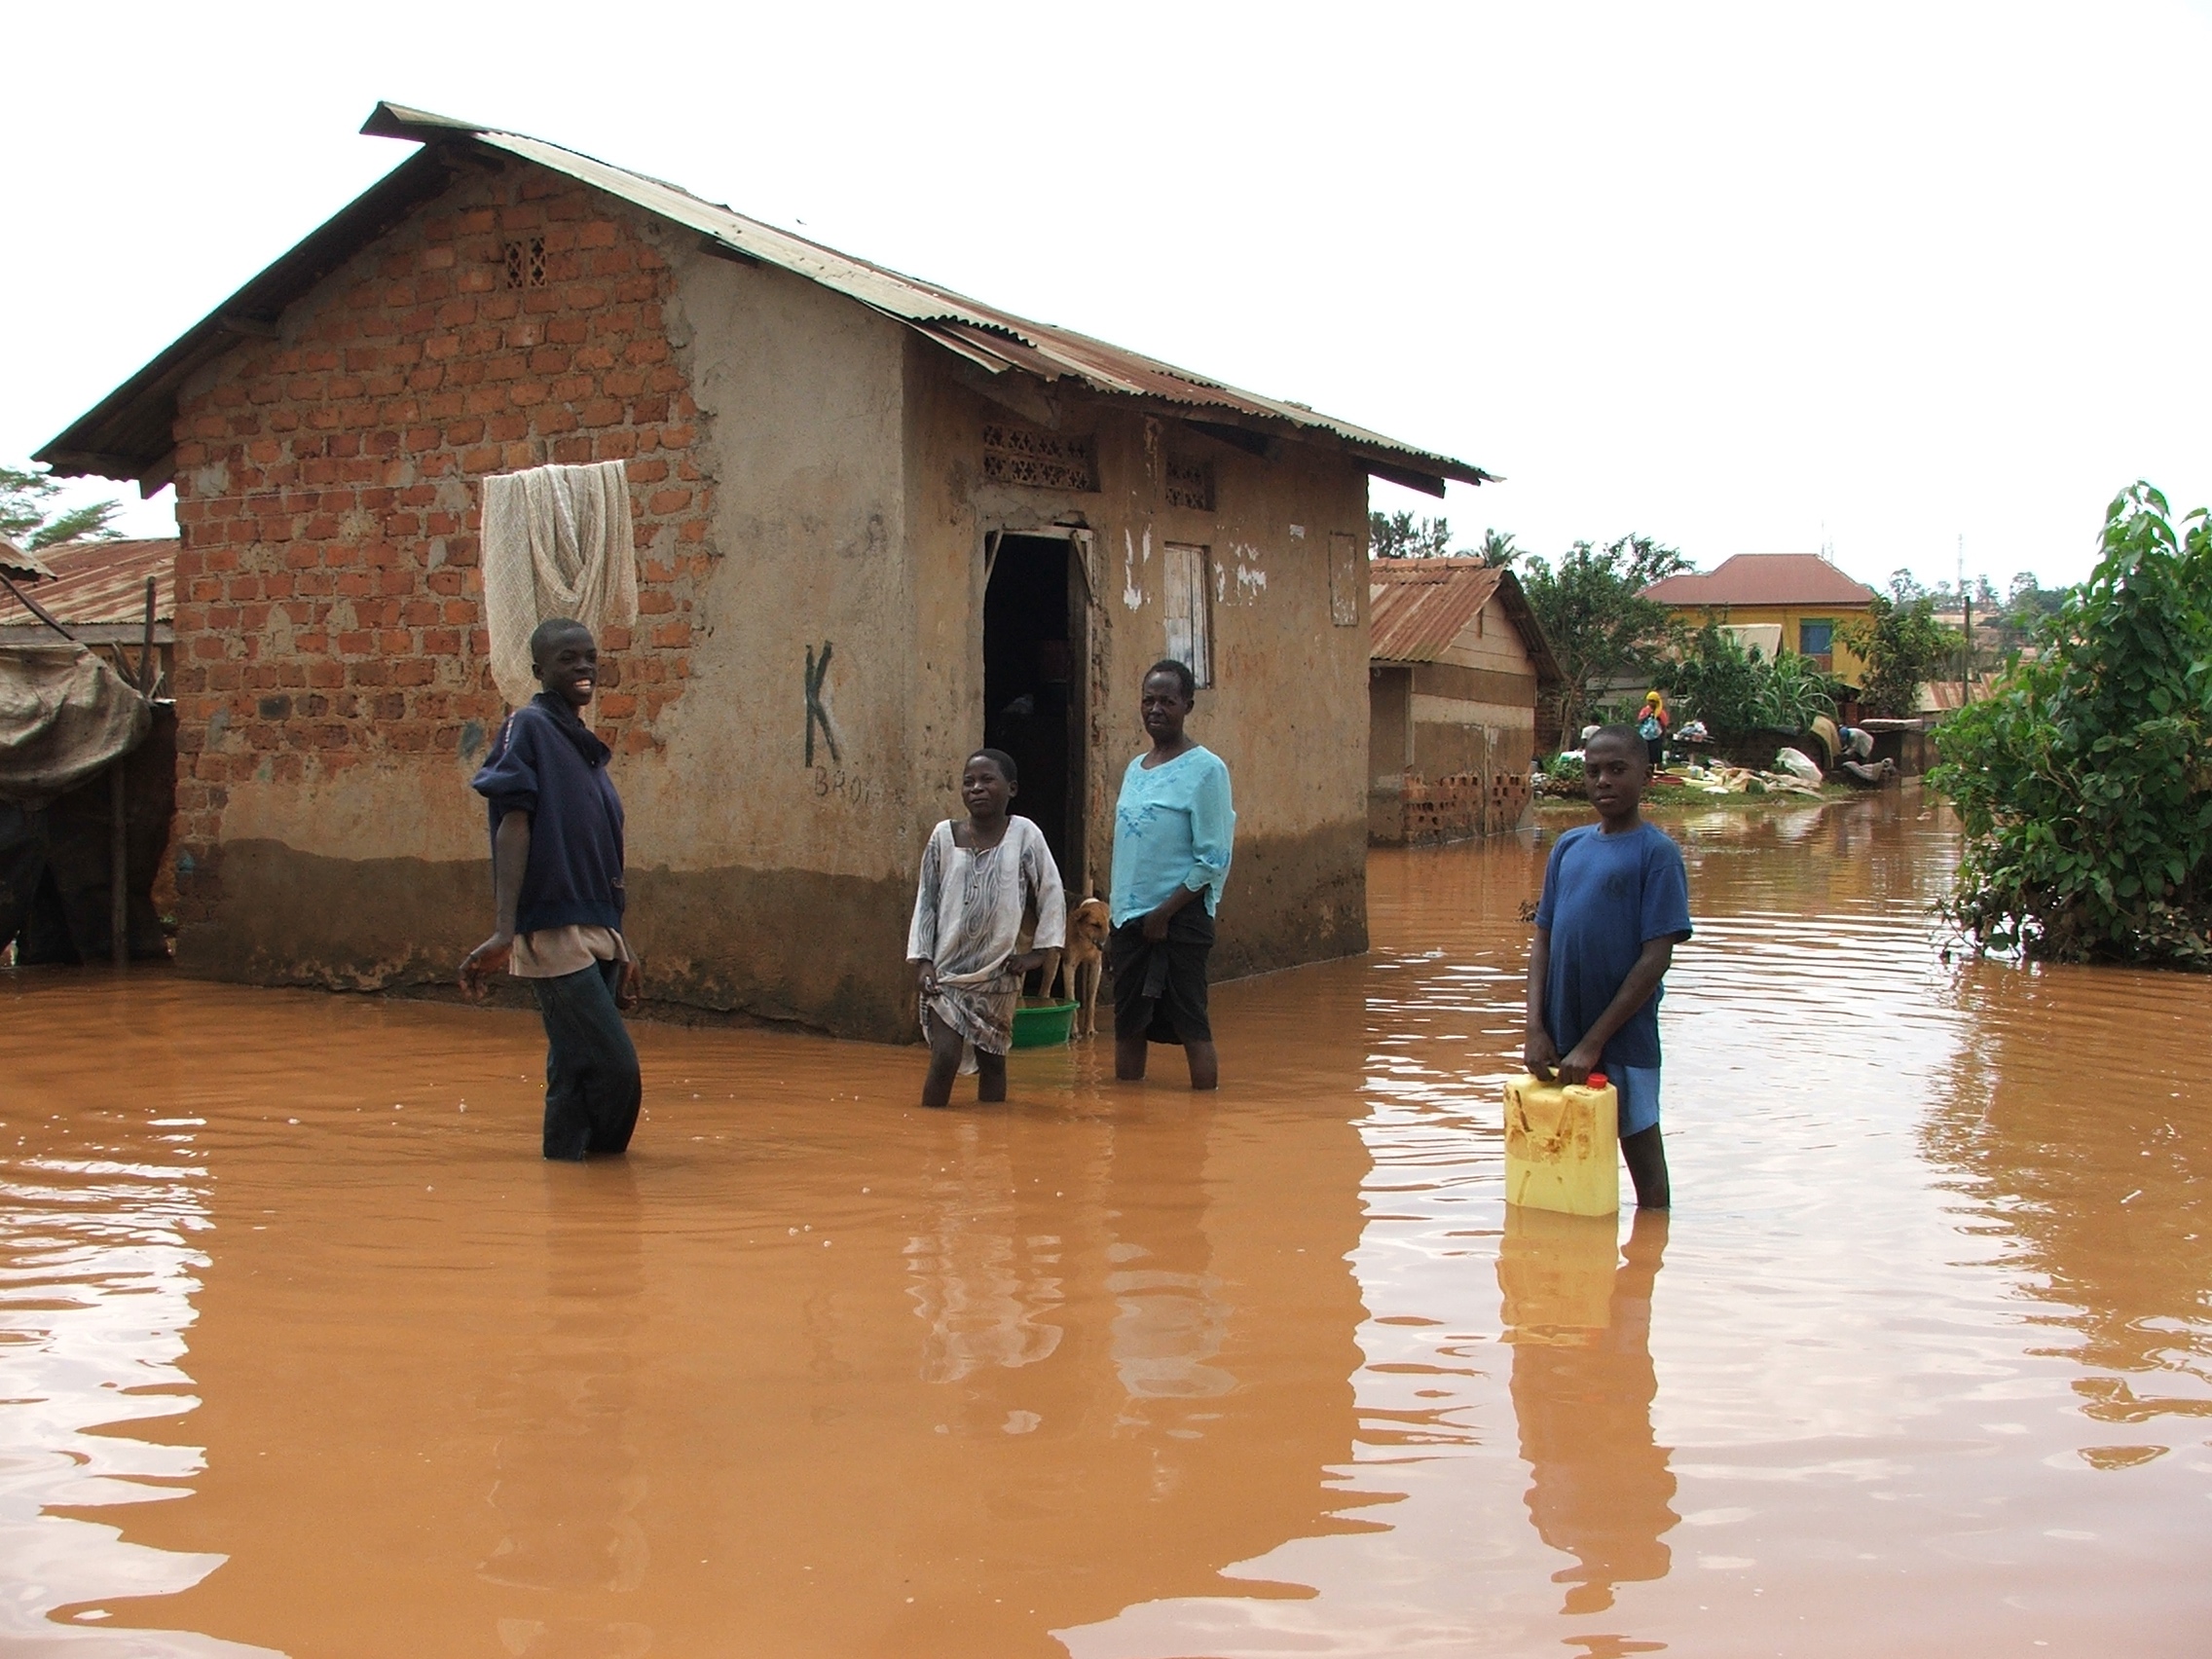
The new “medium” climate pathway — the one that reflects current policies — estimates 2.8°C of warming on average by 2100, with the likely range running from 2.1°C to 3.7°C. That would still mean drastic declines in coral reefs and accelerated species extinction, worsening water scarcity, and further sea level rise. And while we’ve taken the worst of the worst-case scenarios off the table, we’ve run out of time to keep warming below 1.5°C, and 2°C — the upper limit that the 2015 Paris Accords sought to prevent. 

And as with anything to do with climate change, this scientific shift was quickly politicized. The day before Hausfather and his co-authors published their analysis of RCP 8.5’s retirement, President Donald Trump posted on Truth Social: “GOOD RIDDANCE!”, and described the change as proof that climate science was “WRONG! WRONG! WRONG!.” Not surprisingly, Trump is the one who is wrong here, as Carbon Brief explained in detail, but his mistake shows how easy it is to take the wrong lesson from the end of RCP 8.5. We shouldn’t fall for it.

The entire point of climate scenarios like RCP 8.5 was that there was no one certain future for climate change — only multiple possible futures. Whether or not RCP 8.5 was ever possible, the enormous advances in clean energy over the past 15 years are what made its retirement certain. Now we have new futures before us, waiting for what we do next.  

A version of this story originally appeared in the Good News newsletter. Sign up here!

  • ✇Eos
  • Tree Lines Are Migrating. Some Up, Some Down. Emily Gardner
    As the climate warms, tree lines are generally understood to move up, because regions that were previously too cold for trees to survive now have higher, more tree friendly temperatures. A tree line is clearly visible in the Swiss National Park, in Graubünden, Switzerland. Credit: Sabine Rumpf, University of Basel This migration can be seen in these images of Canada’s Waterton Lakes National Park… Rising tree lines are visible in Canada’s Waterton Lakes National Park,
     

Tree Lines Are Migrating. Some Up, Some Down.

12 May 2026 at 13:08
A clear tree line is visible on a mountain range.

As the climate warms, tree lines are generally understood to move up, because regions that were previously too cold for trees to survive now have higher, more tree friendly temperatures.

A tree line is clearly visible in the Swiss National Park, in Graubünden, Switzerland. Credit: Sabine Rumpf, University of Basel

This migration can be seen in these images of Canada’s Waterton Lakes National Park…

Rising tree lines are visible in Canada’s Waterton Lakes National Park, seen here in 1913 (left) and 2007 (right). Credit: Mountain Legacy Project

…and of Jackson Glacier in Montana’s Glacier National Park, for example.

A black-and-white image shows a glacier in a mountain pass.
Jackson Glacier, in Montana’s Glacier National Park, is seen here in 1912 and 2009. As the climate has warmed, the glacier has receded significantly, and tree lines have risen. Credit: MJ Elrod, U of M Library–9/3/2009, L McKeon, USGS

But new research, published in the International Journal of Applied Earth Observation and Geoinformation, paints a more complicated picture: Between 2000 and 2020, 42% of tree lines shifted up, true. But 25% of them actually moved downhill.

Sabine Rumpf, an ecologist at the University of Basel in Switzerland, said many studies of tree line shifts tend to be concentrated in limited geographic areas. A preponderance are based primarily on data from North America, Europe, and the Himalayas, where researchers are more likely to have funding to head to the field to take measurements themselves.

“But that also means that a large proportion of the surface of our planet is so understudied,” Rumpf said. “And [to remedy] that, remote sensing data [are] really amazing because you can get a truly global picture, even though there’s nobody, or too few people, observing things in the field.”

Tree Lines Aren’t Living up to Their Potential

So the team set out to take a more global look. They used a world mountain map, developed in 2018, with a 250-meter resolution. They did exclude some regions from their analysis: cells with less than 10% high-mountain coverage (which have so few trees that they don’t have much of a tree line) and cells more than 95% covered with trees (which have so many trees that they don’t have much of a tree line). For their purposes, the team defined the “observed tree line” as the upper limit of trees that stand 3 meters or taller.

Then, said Rumpf, they used a model to calculate the potential tree lines for each area, because, thanks to human effects on the environment, “where these trees could be surviving is almost always higher than where the trees are currently.” The model looked at the growing season length and mean growing season temperature for each cell in the map’s grid. The researchers determined that if a cell had a growing season length of 94 days or longer, and an average growing season temperature of 6.4°C or higher, it could potentially host trees. Cells that didn’t meet both criteria were considered unable to be covered in forest, and thus above the potential tree line.

With this model, “you can calculate based on climatic data where trees could potentially occur or not occur, even though they might not be there in the field,” Rumpf said. “It’s actually super simple. And that’s the beauty of it.”

Credit: Sabine Rumpf, University of Basel

Jordon Tourville, a terrestrial ecologist with the Appalachian Mountain Club, said the overall findings are not surprising, because other studies have shown seemingly “paradoxical downslope shifts in some cases.” But he noted that whereas this study estimated potential tree lines based on temperature constraints, some scientists have suggested that factors such as nutrient availability and wind exposure are also important in determining tree line position.

Unsurprising, on Second Thought

In areas with more human disturbance, the upward spread of trees is suppressed, or even reversed.

Armed with this information about observed versus potential tree lines, the researchers hypothesized that areas with the smallest deviation between the two were mostly responding to climatic factors. In contrast, they speculated, areas with a greater difference between observed and potential tree lines were likely experiencing more anthropogenic disturbance, such as logging, agriculture, and infrastructure development.

Their hypothesis held up. In areas with less human disturbance, tree lines were moving upward more quickly (the researchers noted, though, that the upward migration of tree lines lagged behind the rate of climate change). In areas with more human disturbance, the upward spread of trees is suppressed, or even reversed.

Fire played a big role in tree line shifts as well: The researchers found that 38% of the downslope shifts were linked to fire events. Wildfires played a particularly big role in western North America and Alaska.

Wildfires played a particularly large role in the downward shift of tree lines in western North America. Here, a tree line is visible in California’s Little Lakes Valley. Credit: mlhradio/Flickr, CC BY-NC 2.0
Blue circle with white text reading "Visit Teach the Earth for classroom activities to pair with this ENGAGE article." "Teach the Earth" is a logo with lines and triangles depicting mountains above the words and a shape denoting waves below them.

Rumpf and several of her colleagues are located in the Alps, where glaciers are retreating, tree lines are climbing, and towns are generally more threatened by mudslides than by wildfires.

Some of the study’s findings, like a quarter of tree lines shifting down, or such a clear signal from wildfires in some areas, were at first unexpected. But after some reflection, Rumpf realized the diversity of data was a perfect example of why global-scale research is important.

“A lot of scientific funding is based in North America and Europe,” Rumpf said, which means many studies return similar results. “Then we do something global and we are surprised that things are different somewhere else on the globe?… I mean, well, duh.”

—Emily Gardner (@emfurd.bsky.social), Associate Editor

This news article is included in our ENGAGE resource for educators seeking science news for their classroom lessons. Browse all ENGAGE articles, and share with your fellow educators how you integrated the article into an activity in the comments section below.

Citation: Gardner, E. (2026), Tree lines are migrating. Some up, some down., Eos, 107, https://doi.org/10.1029/2026EO260146. Published on 12 May 2026.
Text © 2026. The authors. CC BY-NC-ND 3.0
Except where otherwise noted, images are subject to copyright. Any reuse without express permission from the copyright owner is prohibited.

Why Climate Work Is Community Work

By: Guest
23 April 2026 at 17:07
At a recent Climate School event, speaker Memphis Washington discussed the Waterfront Alliance's climate resilience and environmental justice efforts in Coney Island.

  • ✇Eos
  • Mangroves May Be Losing Their Grip on Carbon Storage as Sea Levels Rise Sarah Derouin
    Source: Earth’s Future Mangrove forests straddle the edge of land and sea along some tropical and subtropical coastlines. These trees and shrubs have distinctive tangles of roots that trap sediment and produce organic matter, forming dense soils and efficiently storing carbon. Though mangroves cover only 1% of Earth’s surface, they store a whopping 15% of global ocean carbon in their trapped soils. Their location along coastlines means mangroves are at the mercy of changing sea levels and
     

Mangroves May Be Losing Their Grip on Carbon Storage as Sea Levels Rise

5 June 2026 at 12:04
Sunlight streams through the canopy of a mangrove forest.
Source: Earth’s Future

Mangrove forests straddle the edge of land and sea along some tropical and subtropical coastlines. These trees and shrubs have distinctive tangles of roots that trap sediment and produce organic matter, forming dense soils and efficiently storing carbon. Though mangroves cover only 1% of Earth’s surface, they store a whopping 15% of global ocean carbon in their trapped soils.

Their location along coastlines means mangroves are at the mercy of changing sea levels and sediment availability. Rising sea levels can drown mangroves or push them landward. At the same time, sediment supplies, belowground root growth, and organic matter accumulation can help build up mangrove soils, allowing forests to keep pace with sea level rise. So over time, will mangroves keep locking carbon into their soils, or will they start losing it?

Iwantoro et al. created a new model that examines the links between coastal processes to investigate vegetation growth and carbon accumulation in mangrove forests.

The researchers modeled a simplified tidal embayment to explore how different rates of sea level rise and sediment supplies would affect the mangroves. In these experiments, they found that carbon accumulation can increase at specific locations as waters rise because the increased water can lead to more mangrove growth—a result that matches existing data. However, when looking at landscape scales, they found sea level rise generally reduces total carbon sequestration through mangrove loss and soil erosion. The results showed that rising sea levels can alter mangroves from carbon storage sinks to carbon emitters.

The findings demonstrate that local trends in carbon sequestration may not be representative of larger-scale outcomes in mangrove forests. The study shows that understanding coastal landscapes as an interconnected system is crucial to understanding how mangroves can respond to climate and human-induced pressures, the researchers say. However, new assessments and approaches are needed to better understand future mangrove vulnerabilities. (Earth’s Future, https://doi.org/10.1029/2025EF006984, 2026)

—Sarah Derouin (@sarahderouin.com), Science Writer

The logo for the United Nations Sustainable Development Goal 14 is at left. To its right is the following text: The research reported here supports Sustainable Development Goal 14. AGU is committed to supporting the United Nations 2030 Agenda for Sustainable Development, which provides a shared blueprint for peace and prosperity for people and the planet, now and into the future.
A photo of a telescope array appears in a circle over a field of blue along with the Eos logo and the following text: Support Eos’s mission to broadly share science news and research. Below the text is a darker blue button that reads “donate today.”
Citation: Derouin, S. (2026), Mangroves may be losing their grip on carbon storage as sea levels rise, Eos, 107, https://doi.org/10.1029/2026EO260144. Published on 5 June 2026.
Text © 2026. AGU. CC BY-NC-ND 3.0
Except where otherwise noted, images are subject to copyright. Any reuse without express permission from the copyright owner is prohibited.

The most underrated sites at our national parks — according to a guy who’s seen them all

25 May 2026 at 11:30
Painted Hills Overlook Trail Sign
John Day Fossil Beds | Bernard Friel/UCG/Universal Images Group via Getty Images

Before Transportation Secretary Sean Duffy took his great big American road trip, Mikah Meyer did it first. 

Meyer is a travel writer and blogger. In 2019, he became the first person to visit all of the National Park Service sites in a single journey — over 400 in total. The full list includes national monuments, battlefields, and rivers — and the 63 national parks that most of us think of when we plan our summer trips. 

Now, with ultra-high gas prices, park staffing shortages, and funding cuts to the NPS, Meyer has some guidance for how to enjoy the outdoors responsibly this summer. He told Today, Explained that Americans should start with exploring their own backyard this summer — and think outside the box. 

Meyer talked with Today, Explained co-host Sean Rameswaram about the hidden outdoor gems in each region of the US and what his number one spot in the country is. Hint: It’s not one of the heavy hitters. 

Below are some of Meyer’s favorites, divided by region and edited for length and clarity. There’s much more in the full podcast, so listen to Today, Explained wherever you get podcasts, including Apple Podcasts, Pandora, and Spotify.

The Northwest

One of my favorites in the northwest is the John Day Fossil Beds National Monument [in Oregon]. There’s a unit called the Painted Hills Unit, which has these incredible red stripes that cut through the earth. And whether you live in Seattle or Portland, you can access it within a day’s drive and you’re not going to have any of the crowds that you’ll experience at Mount Rainier or at Olympic [National Park]. It’s just one of the most otherworldly places I’ve seen up there.

The Southwest

For the Southwest, I would not go to Saguaro National Park. If you go a few more hours away to Organ Pipe Cactus National Monument, the cactuses are way cooler looking.

There are way more epic hikes. There are way more epic vistas and views. It’s on the border with Mexico. If it’s between just Saguaro or Organ Pipe, I would go to Organ Pipe.

The Southeast

If you are in the Southeast, I would skip the crowds of the Everglades and hop a short flight over to the Virgin Islands, where there is an island off the island of St. Croix, which is called Buck Island Reef National Monument

It’s a natural turtle nesting ground that you can actually snorkel underwater down a trail that the Park Service has made. It’s incredible. It’s not going to be crowded because most people, when they go to the Virgin Islands, go to Virgin Islands National Park, which is the majority of the island of St. John. And so St. Croix is like the forgotten kid, [which] is amazing. You just have to take a little boat over there.

The Midwest

Through the Twin Cities of Minneapolis and St. Paul, there is a 72-mile river corridor called the Mississippi National River and Recreation Area, and it is a federally protected riverfront that is full of places to fish and hike and run and see amazing wildlife. And it’s one that I actually go to on a daily run every day. 

The Northeast

Acadia is a really popular one, but really close to there and far from the crowds is the end of the Appalachian National Scenic Trail, which starts in Georgia and runs all the way up to the center of Maine. You don’t have to do the whole thing, but in just one day you could go hike the final few miles to the center of Maine and you can actually see people finishing their months-long trek. 

It’s this super cool experience just as a day tripper to get to meet these folks, to talk to them. You get to the top of this mountain, and you get to witness people complete a historic National Park Service trail and feel just a little bit of that for yourself. 

His all-time favorite

My favorite National Park Service site in the whole system is in Utah. And when I wrote a blog ranking all of Utah’s Park Service sites, I got a lot of flack because my number one was not Zion, it was not Bryce, it was not Arches. It was Dinosaur National Monument

Because it’s a national monument and not a national park, most people haven’t heard of this site. If tomorrow Congress upgraded it to Dinosaur National Park, it would get millions of visitors. But that’s just because most people think America’s park system is only the 63 parks. They don’t realize that it’s over 400 sites. 

Dinosaur National Monument only gets 7 percent as many visitors as nearby Rocky Mountain National Park or Zion National Park, but I think it’s the best that the entire National Park Service system has to offer, all in one less-visited site where you, for example, can touch a dinosaur bone if you would like.

From Classrooms to Climate Impact: Two Careers Flourish in Singapore

By: Guest
30 March 2026 at 17:30
M.A. in Climate and Society alums Amanda Chen and Anuka Upadhye tackle climate change from halfway around the world.

  • ✇Eos
  • How Much Will Western Wildfires Worsen Under Warming? Rebecca Owen
    Source: AGU Advances Across the western United States, wildfires are increasing in size and intensity. As the climate continues to warm, more extreme wildfires will reshape landscapes and pose a growing risk to human health and natural ecosystems throughout the West. Climate models, used to predict other effects of climate change, are unable to directly simulate wildfires. Instead, researchers link previously burned areas to climate variables such as temperature, precipitation, drought, a
     

How Much Will Western Wildfires Worsen Under Warming?

15 May 2026 at 13:29
The West Kern Fire and thick smoke move through trees near the boundary of California’s Sequoia National Park.
Source: AGU Advances

Across the western United States, wildfires are increasing in size and intensity. As the climate continues to warm, more extreme wildfires will reshape landscapes and pose a growing risk to human health and natural ecosystems throughout the West.

Climate models, used to predict other effects of climate change, are unable to directly simulate wildfires. Instead, researchers link previously burned areas to climate variables such as temperature, precipitation, drought, and evaporation, then apply those relationships to future climate projections.

Many recent studies have connected higher vapor pressure deficit (VPD)—a measure of atmospheric dryness—to more area burned in previous fires. VPD increases as the temperature rises, so models that rely on it generally predict an increase in wildfire activity as the climate warms.

Cheng et al. raise questions about the role VPD plays in modeling wildfire, suggesting that VPD is a poor measure of fuel dryness at larger scales and overestimates potential burned areas under significant warming conditions. Instead, researchers suggest soil moisture could be a more reliable indicator of fuel dryness and lead to more moderate projections of wildfire increases.

The researchers looked at five forested ecoregions in the western states. Using the Western US MTBS-Interagency wildfire dataset from 1984 to 2020 combined with climate data (temperature, VPD, and soil moisture), the researchers analyzed drivers of the area burned from May through October. They connected this information with output from climate models to look at future burn potential.

VPD-based wildfire predictions increase sharply under warming conditions. These predictions showed that under 3°C of average global warming, 16 times as much land would burn by the end of the century, compared to historical levels. Under 4°C of warming, up to 66 times more land would burn by the end of the century. This “truly massive” increase, the authors say, would mean fires consuming vegetation almost as soon as it regrows.

Soil moisture, on the other hand, provides a more moderate, though still concerning, picture. Under the same warming scenarios, soil moisture changes would lead to an increase in burned area of only 2–3 times that of the historical period. The researchers argue that projections relying on VPD severely exaggerate wildfire risk. (AGU Advances, https://doi.org/10.1029/2026AV002350, 2026)

—Rebecca Owen (@beccapox.bsky.social), Science Writer

A photo of a telescope array appears in a circle over a field of blue along with the Eos logo and the following text: Support Eos’s mission to broadly share science news and research. Below the text is a darker blue button that reads “donate today.”
Citation: Owen, R. (2026), How much will western wildfires worsen under warming?, Eos, 107, https://doi.org/10.1029/2026EO260147. Published on 15 May 2026.
Text © 2026. AGU. CC BY-NC-ND 3.0
Except where otherwise noted, images are subject to copyright. Any reuse without express permission from the copyright owner is prohibited.

Translating Climate Awareness Into Action at New York High Schools

By: Guest
28 May 2026 at 21:17
The student-led Youth Climate Action Alliance Interscholastic Conference brought together high school students from across the boroughs to learn about and collaborate on climate action initiatives.

“Near-miss” Tsunami in Alaskan Cruise Area Offers Lessons for Steep Landscapes Near Glaciers

As glaciers retreat in warming regions, the risk of related hazards can increase, and improved monitoring may help reduce some of those dangers, according to a new study.

❌
Subscriptions