How Space Plasma Can Bend the Laser of Gravitational Wave Detectors
Editors’ Highlights are summaries of recent papers by AGU’s journal editors.
Source: Space Weather
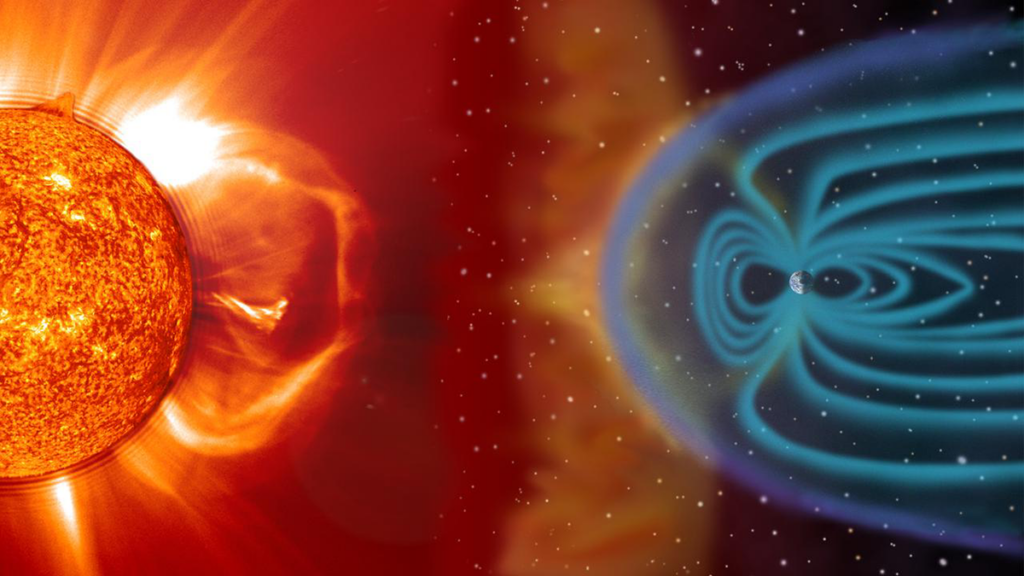
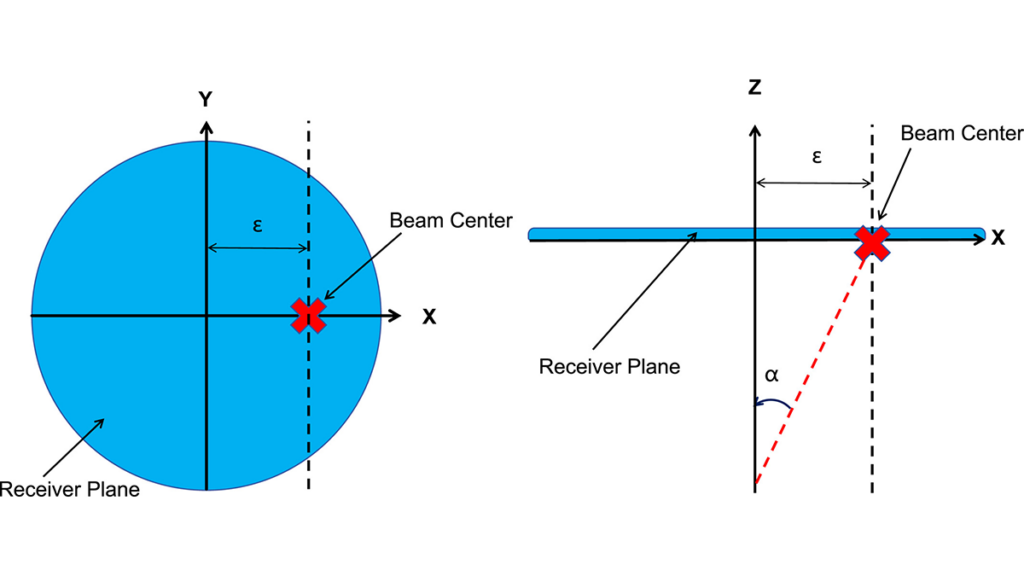
TianQin is a geocentric space-borne gravitational wave detector, which is proposed to detect the gravitational wave by measuring tiny displacements using inter-satellite laser interferometry. However, the space surrounding the orbit and laser links of TianQin is not a vacuum—but filled with plasma, which can bend the laser links and induce pointing accuracy noise in the gravitational wave detection.
Based on a global magnetohydrodynamic model, Zhou et al. [2026] use a ray-tracing method to obtain the laser deflection caused by laser propagation through plasma, and to evaluate the pointing accuracy noise. The result shows that the laser deflection effect caused by large-scale space plasma distribution under quiet to moderate space weather conditions does not represent a fundamental risk to the TianQin mission. However, during severe space weather events, the laser propagation effect could become a considerable noise in the gravitational wave detection.
This work establishes a connection between space weather and gravitational wave detection. Furthermore, this work raises awareness of the impact of space weather on other high-precision electromagnetic wave measurements in space.
Citation: Zhou, S. W, Su, W., Zhou, S. Y., Li, C. F., & Zhang, J. X. (2026). The pointing error due to laser propagation in space plasma for TianQin gravitational wave detection. Space Weather, 24, e2025SW004784. https://doi.org/10.1029/2025SW004784
—Jiuhou Lei, Editor, Space Weather