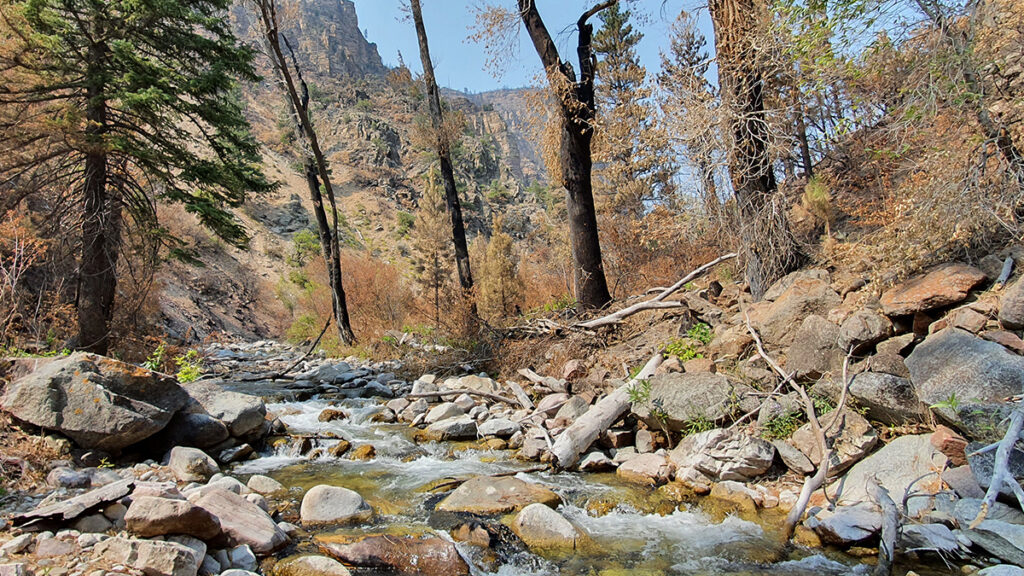
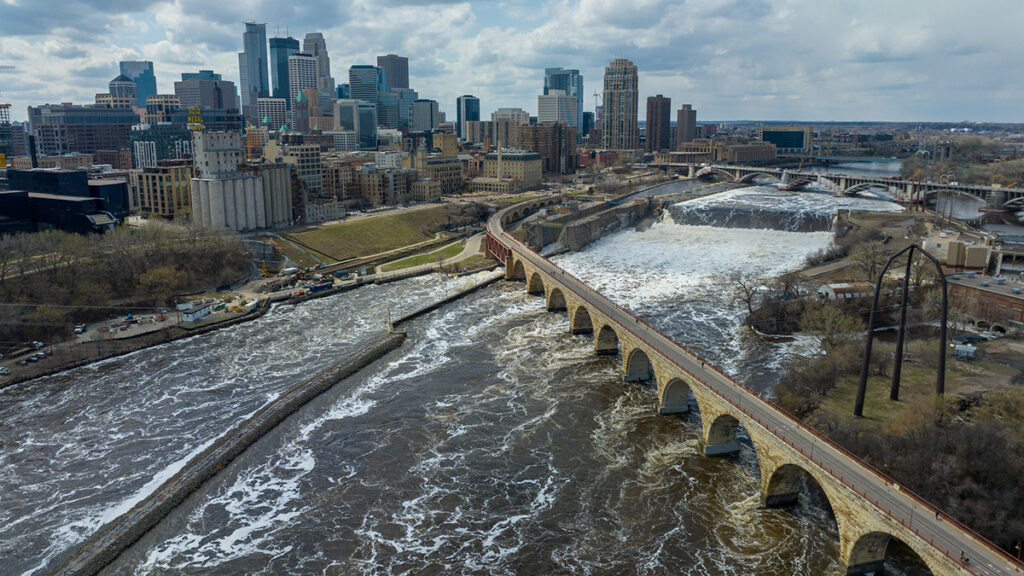
Wildfires can increase flooding risks in and downstream of burned areas by removing vegetation and disturbing hydrologic processes. As the climate changes, the severity of both wildfires and heavy rainfall events is increasing, meaning flooding is likely to become more severe in the near future. Better understanding how, and by how much, wildfires change flood risk is important for disaster and infrastructure planning for communities around the country.
To make the most of the limited data on flooding in the years following wildfires, the researchers created a paired-storms framework: They identified postfire peak flows (PFPFs), defined as the five highest peak flows within 3 years of a wildfire across seven watersheds. Then, for each precipitation event causing a PFPF, they looked for storms with similar characteristics (or paired storms) that occurred before the wildfire. Storm characteristics used for pairing included the season in which the storm occurred, recent precipitation, and precipitation depth, duration, and peak intensity.
The researchers found significantly elevated peak flows after wildfires in many cases, underlining the risks to communities following wildfires and validating their approach for use elsewhere.
Altogether, the authors found 26 PFPF events, including 20 with paired storms occurring before wildfires. For 75% of the postfire storms, their peak flows were 2 or more times greater than prefire peak flows. PFPFs were most likely to happen in the first year after a wildfire and typically occurred following storms that were centered upstream of the watershed centroid, were uniform in shape, and fully covered the watershed and burned area, the authors reported. They also found some evidence that the first storm in the year immediately following a fire has a higher-than-expected chance of producing a PFPF.
Future work could look more deeply at the characteristics of storms occurring over burned areas, such as storm direction and watershed recovery, and could apply the automated methods to more burned watersheds and storm events to enhance the robustness of the work, the authors say. (Water Resources Research, https://doi.org/10.1029/2025WR040693, 2026)
A wonderful new paper on the huge Tracy Arm landslide and tsunami will have profound but challenging implications for the management of risk in an age of increased tourism and rapid climate change.
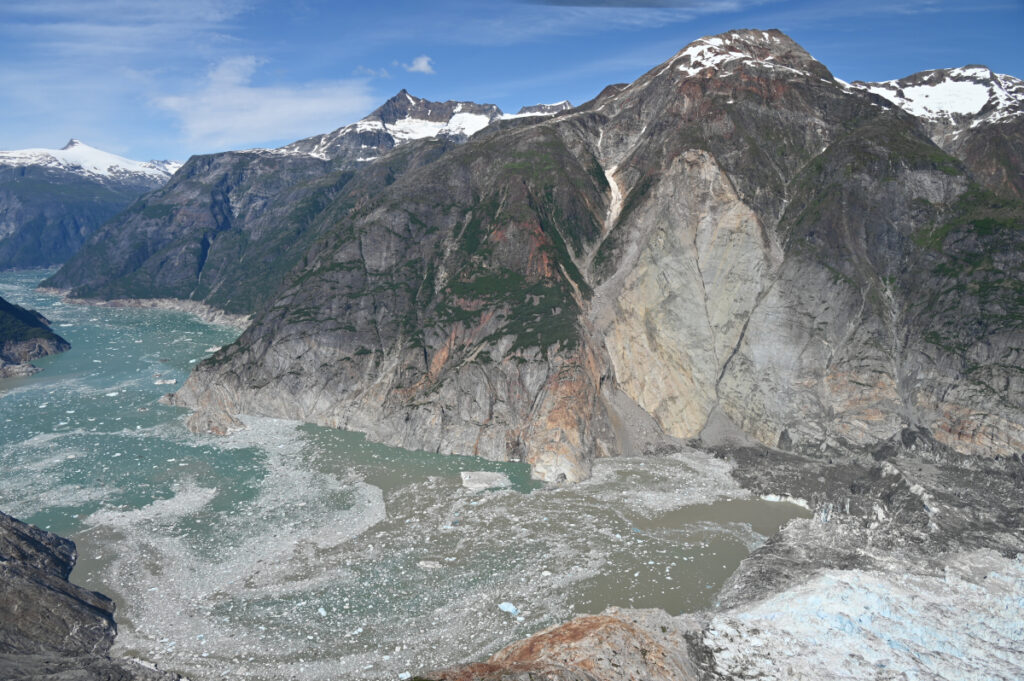
The journal Science has published an excellent new paper (Shugar et al. 2026) that examines the extraordinary 10 August 2025 landslide and tsunami at Tracy Arm fjord in Alaska. The paper is open access, so you can read it for yourself (it is very accessible), and there has been a plethora of media coverage (quite rightly).
That large landslides occur in fjords is not a surprise, and that they can generate enormous displacement waves is also not news. We know that landslide occurrence in these environments in general is increasing, and specifically so in Alaska. However, this paper is the most comprehensive and systematic analysis of such an event, and it has shown the remarkable threat that these events can generate. The tsunami created by this landslide had a 481 metre run-up; it is remarkable that there were no fatalities. If a large cruise ship had been in the area, with passengers being ferried ashore on small boats and exploring the shoreline, the consequences would have been catastrophic. It is unsurprising then that cruise companies are now amending their itineraries.
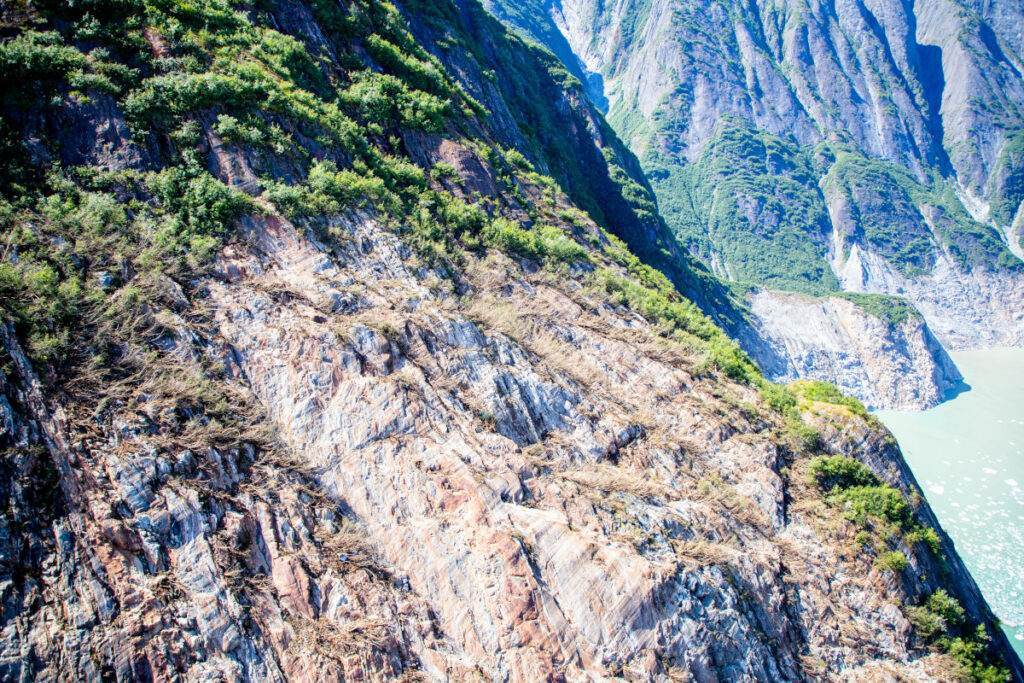
The USGS released the image below of the aftermath of the landslide and tsunami – scale is hard to understand in such images, but the crown of the landslide is over 1,000 metres above the level of the fjord, and the landslide had a subaerial volume of over 63 million cubic metres.
This aerial photo shows the north side of Alaska’s Tracy Arm Fjord in the aftermath of the 2025 landslide and tsunami. The lighter-colored rock is the exposed surface, where the mountainside collapsed and fell into the water. The foot of South Sawyer Glacier is visible at lower right; in decades past, the ice extended much farther and was thick enough to hold the rock slopes in place. Credit: Cyrus Read/U.S. Geological Survey
Shugar et al. (2026) has a brief section that examines the implications of this event, and of the understanding that it provides of the hazards posed by very large landslides in fjord settings. These are locations with extensive human activity – local communities, trade, fishing and tourism. There is some evidence that these landsldies are more likely to occur in the spring and summer months, when human occupation is higher. Our resilience to a tsunami wave that starts off being hundreds of metres high is low.
A case in point lies in Milford Sound in New Zealand, where (for example) an earthquake on the Alpine Fault has the potential to trigger a large landslide that could result in a major tsunami. Milford Sound is an extremely popular tourism location. Should such an event occur, and mass fatalities result, there is no doubt that the public inquiry would find that the societal risk was known and that it was probably unacceptable. However, to ban tourism, including cruise ships, in this area would carry heavy risks in its own right – it would profoundly impact the vital tourist economy of the area, on which many livelihoods depend. This is a substantial risk in its own right, and of course politics plays a major part too. Balancing these risks is a major challenge for any society.
Some hope is offered by the fact that this landslide showed substantial precursory seismic activity, which might represent a route to providing a warning for at least some of these rock slope failures. But research in this area is immature at the moment, and of course there will be no warning for a landslide triggered by a major earthquake.
So, the landslide at Tracy Arm fjord presents us with a host of major challenges, but it also represents a big step forward in our understanding of these events. Well done to Dan and his colleagues for another brilliant paper. I shall watch the debate with great interest.
GENEVA, June 13 — Switzerland has offered to host the possible signing of a peace agreement between the United States and Iran, the Swiss foreign ministry told AFP on Friday.
“Switzerland is fully engaged. We are in close contact with the United States and Iran,” the ministry said in a brief message sent to AFP.
A senior official in President Donald Trump’s administration said Friday that the United States was “80 to 85 per cent” confident of inking an accord with Tehran to end the war in the coming days.
The Swiss foreign ministry said it was playing an active role “to support efforts toward a Memorandum of Understanding intended to consolidate the truce and pave the way for de-escalation in the context of the conflict between Iran and the USA”.
In addition, the ministry said it “has proposed Switzerland as the venue for a possible signing, should the parties agree to it”.
Prime Minister Shehbaz Sharif of Pakistan – which has acted as mediator in efforts to end the war – said on Friday that an agreement on the text of a peace deal had been reached. — AFP
Brazilian President Luiz Inácio Lula da Silva on Tuesday rejected the US government's argument that Brazil engages in “unreasonable” practices in the bilateral relationship, arguing that it is Washington that runs a trade surplus with his country. If anyone should impose tariffs, he said, it would be Brazil.º
United States federal prosecutors announced today that they had indicted Raúl Castro, the former President of Cuba and brother of Cuban revolutionary leader Fidel Castro, over the downing of two civilian planes in 1996.
The U.S. Justice Department has accused Castro, who was defense minister at the time of the incident, of ordering the Cuban Air Force to shoot down the planes.
The move ramps up pressure on the island, which Washington has subjected to a near-total oil blockade since January, and raises concerns that the U.S. is preparing an operation similar to the one that removed Nicolás Maduro from Venezuela earlier this year.
Today’s charges relate to the killing of four members of the Miami-based Cuban dissident group Hermanos Al Rescate (Brothers to the Rescue), who were operating the planes when they were shot down on February 24, 1996. Three were American citizens and one was a U.S. resident.
According to acting U.S. Attorney-General Todd Blance, Castro has been formally charged with conspiring to kill U.S. nationals.
The issue of whether or not the planes were shot down in Cuban or international airspace is still a matter of debate.
Florida’s Attorney-General had announced in March that a state investigation into Raúl Castro’s involvement would be reopened, a move which was endorsed by many Republican politicians, including Florida Senator Rick Scott.
Tensions between the U.S. and Cuba have been rising precipitously, as the North American superpower has enforced a near-total oil blockade on the island, ratcheted up punitive sanctions targeting Cuban officials and demanded in ongoing negotiations between the two countries that the current Cuban President Miguel Díaz-Canel step down.
Some have likened the charges brought against Castro to those directed at former Venezuelan President Nicolás Maduro before his capture earlier this year. Maduro was charged with drug trafficking in the U.S. in 2020, an accusation which served as justification for his forced removal from power by the U.S. military.
It remains to be seen whether the charges against Castro will result in a similar U.S. operation in Cuba.
A warm, dry spring has set the stage for above-average significant wildland fire risk across much of the southern and western United States this summer, and no part of the United States will have below-average fire potential through the end of August.
“It’s not necessarily a foregone conclusion that we’re going to have a really busy season, but everything is pointing that way.”
These predictions are part of a 4-month outlook produced monthly by the National Interagency Fire Center (NIFC), a group of wildland fire experts from eight federal agencies that coordinates wildland fire resources across the country.
The most recent outlook, published 1 May, projects the likelihood of significant fires (defined as those that require an NIFC response) from May to August using long-term forecasts from NOAA’s Climate Prediction Center, current precipitation and drought conditions, and an assessment of the fuels available in different regions (like grasses, brush, and timber).
This year, 1,848,210 acres across the country have already burned—nearly twice the annual average over the past 10 years.
“It’s not necessarily a foregone conclusion that we’re going to have a really busy season, but everything is pointing that way,” said Jim Wallmann, a meteorologist for the U.S. Forest Service at the NIFC and one of the outlook’s authors.
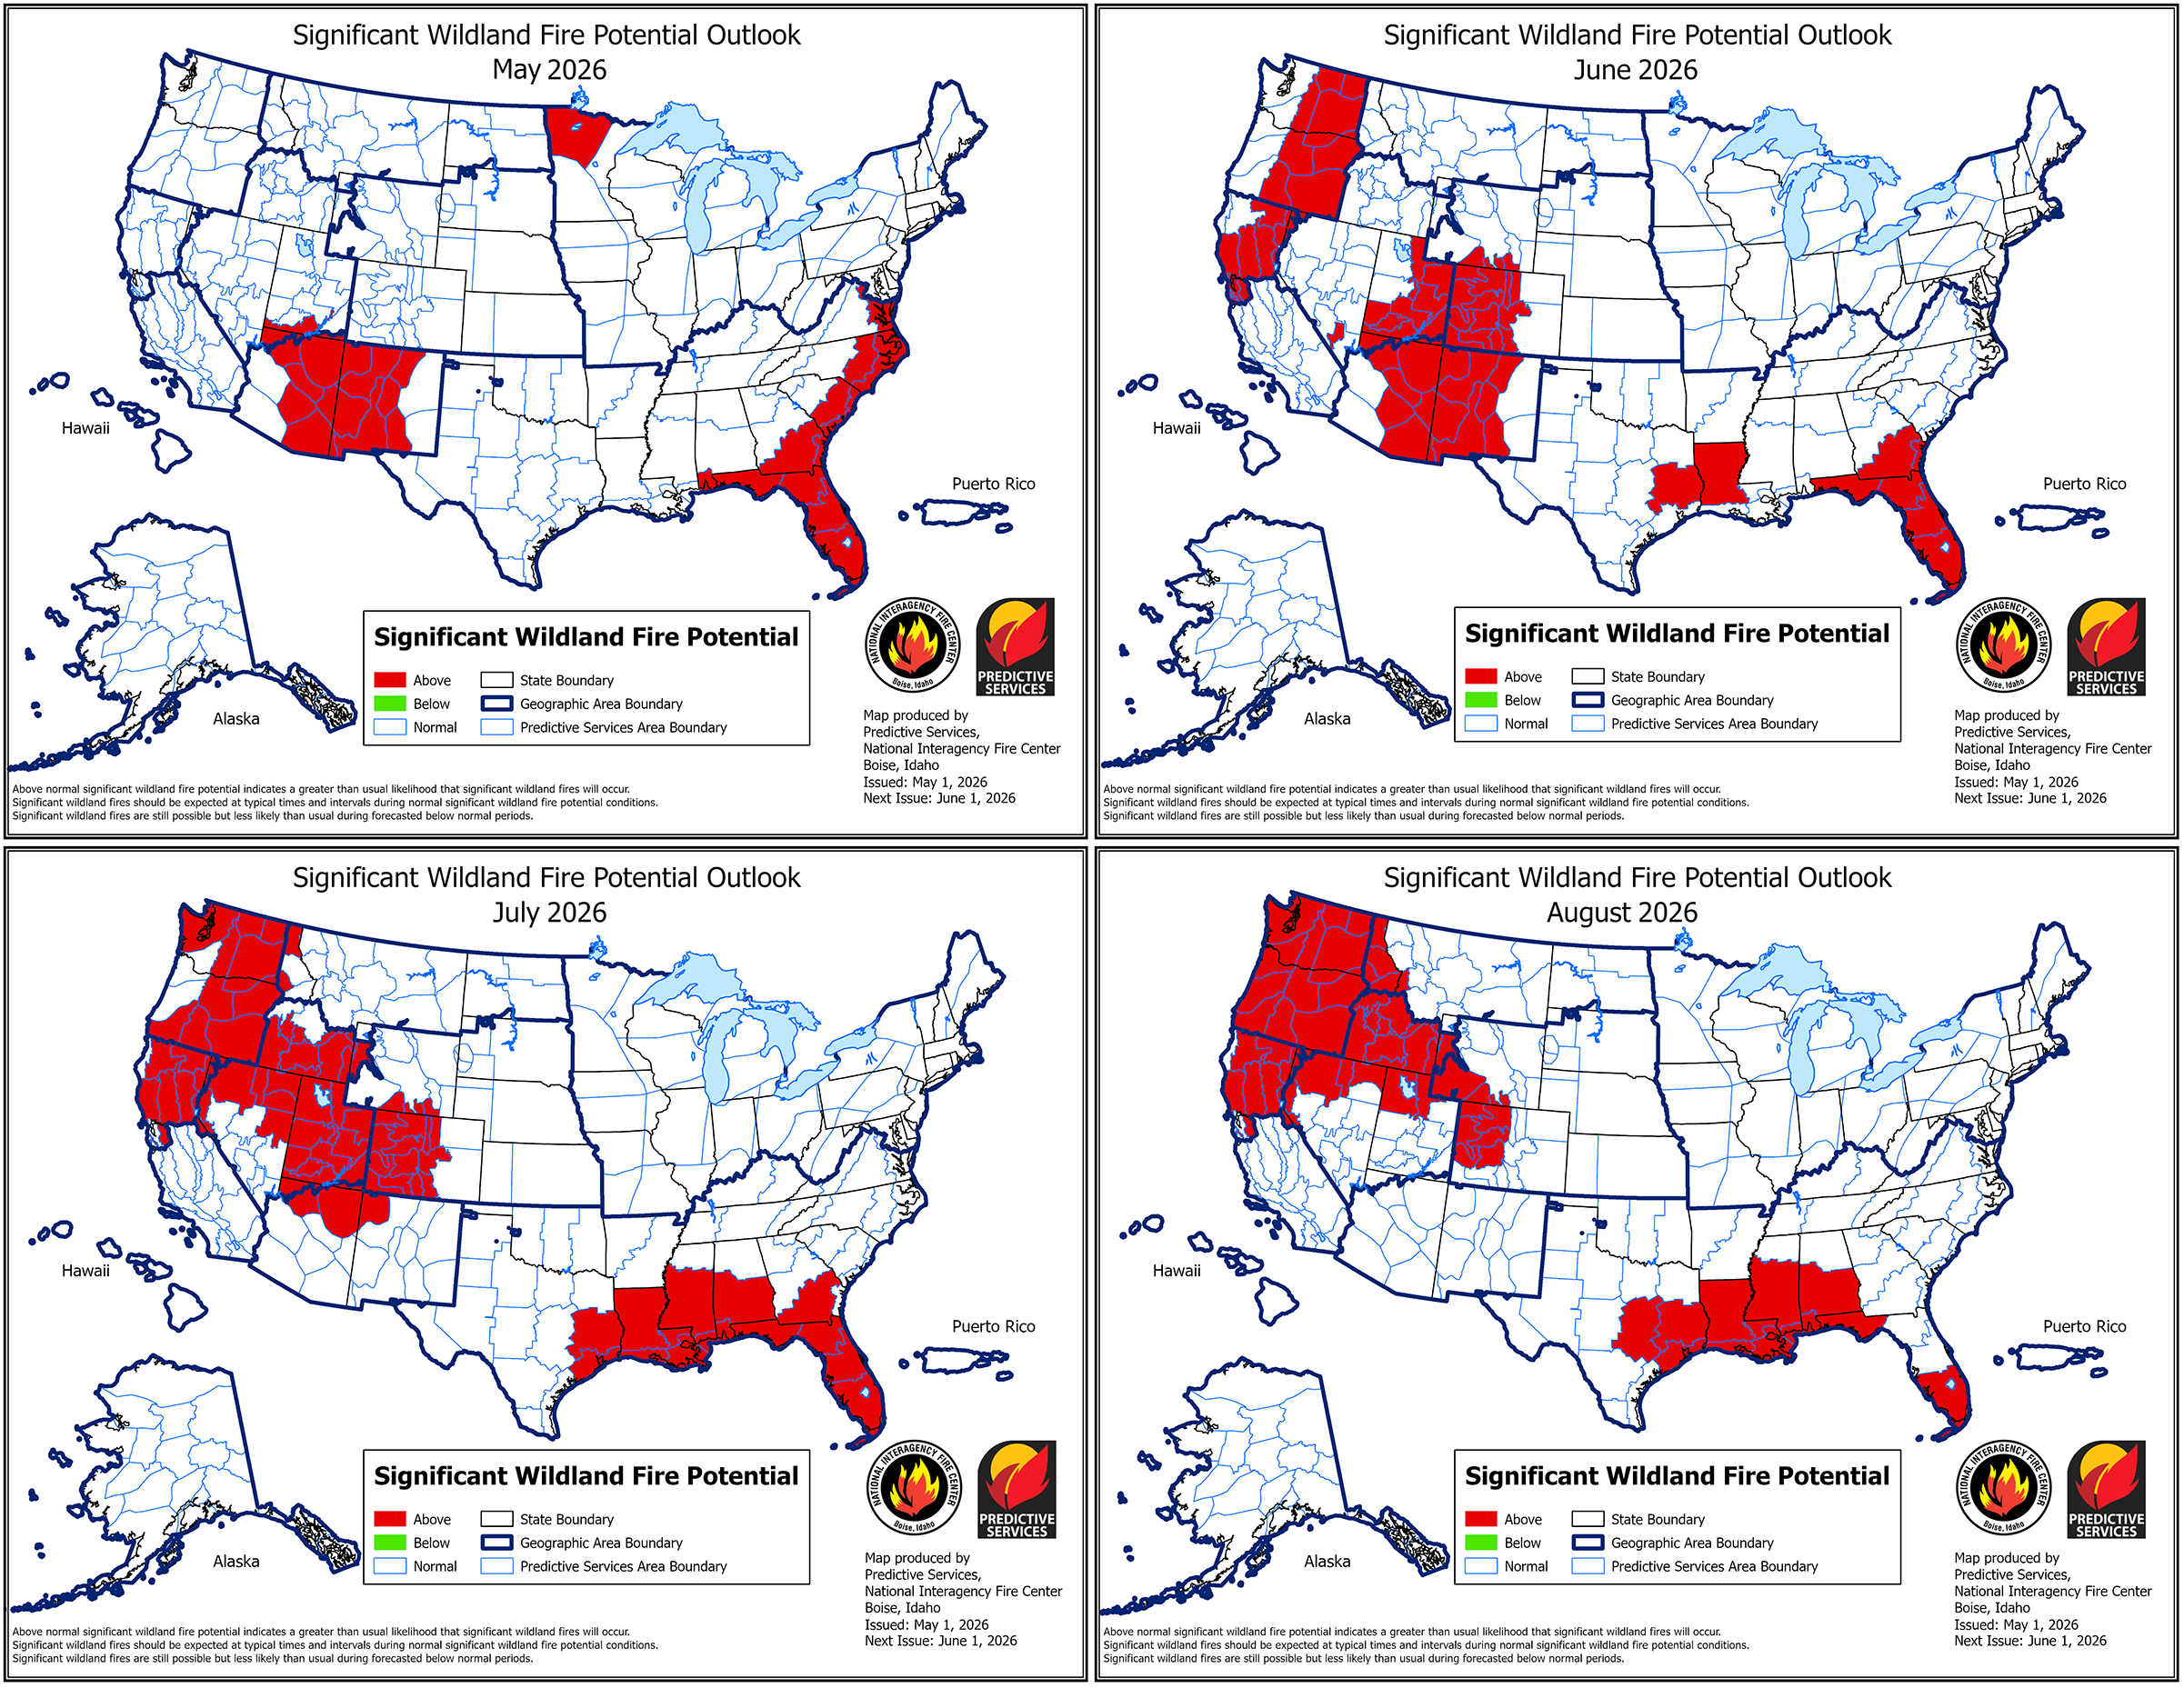
Significant wildland fire potential will be elevated across much of the West and Southeast this summer. Click image for larger version. Credit: National Interagency Coordination Center, Public Domain
Drought in the West
In the West, wildfire season typically peaks in late summer. This most recent outlook predicts an above-average significant fire potential for much of the West as the season peaks.
In May, the above-average risk is concentrated in eastern Arizona and western New Mexico, though that risk fades to normal by August as the Southwest’s monsoon season begins. In June, the above-average risk extends to western Colorado and parts of the Pacific Northwest. In July and August, that risk covers much of the Northwest, including Utah, Idaho, Oregon, Washington, and Northern California.
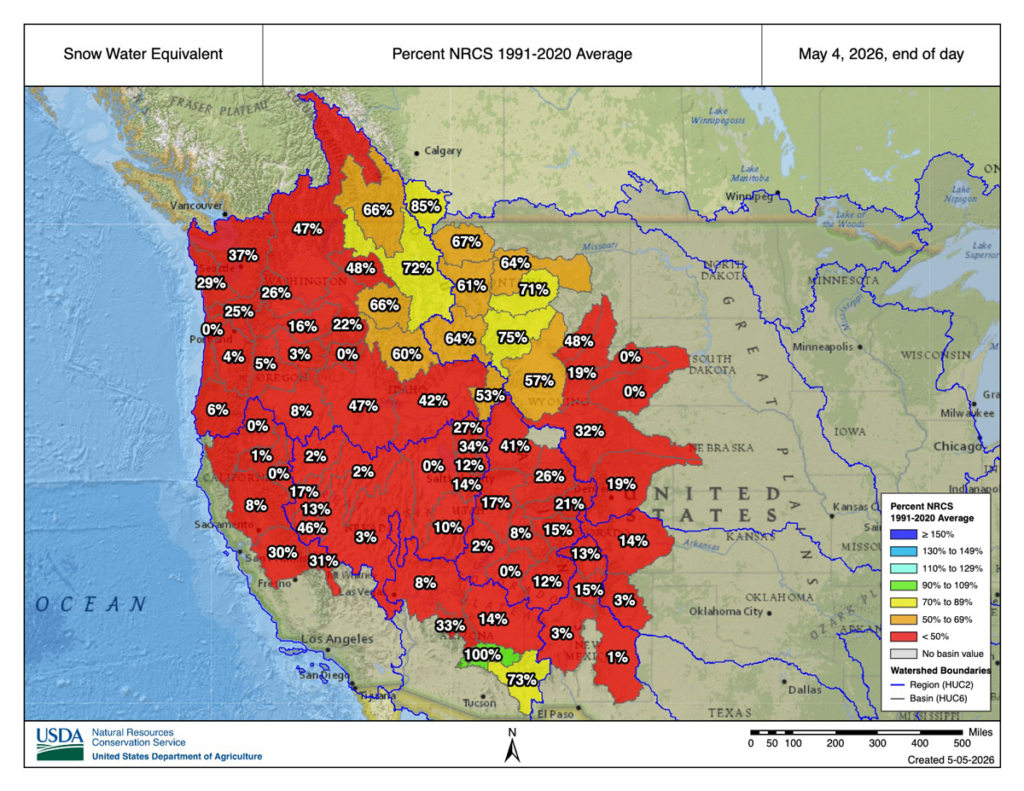
Above-average spring temperatures and a far-below-normal snowpack across the West are contributing to the elevated risk in Washington, Oregon, Idaho, and Northern California, in particular. Many river basins across the West contain less than 20% of their normal amount of snow, and some are already snow-free at all observed locations due to melting caused by warm temperatures in March.
As of May, many river basins in the West have a snow water equivalent—the amount of water held in their current snowpack—that is less than 50% (in red) of the 1991–2020 average level. Credit: USDA Natural Resources Conservation Service, Public Domain
“The snowpack being lower this time of year, and melting out, affects the soil moisture throughout the rest of the summer, which then affects the fuel moistures,” said Craig Clements, a meteorologist at San Jose State University’s Fire Weather Research Laboratory who was not involved in the outlook. Early snowmelt also uncovers fuels, like pine needles and leaf litter, that would typically be under snow, exposing them to the air to dry and catch fire.
Southern California and the Sierra Nevada mountain range, though, remain at an average significant fire risk throughout the summer, as a result of higher-than-average precipitation earlier in the year.
The Southeast and Beyond
Fire risk will also be elevated in the Southeast this summer. Florida, for example, remains at an above-average significant fire potential through the end of August. Southern Georgia, Mississippi, Louisiana, Arkansas, and the eastern halves of Virginia, North Carolina, and South Carolina will also have above-average significant fire potential.
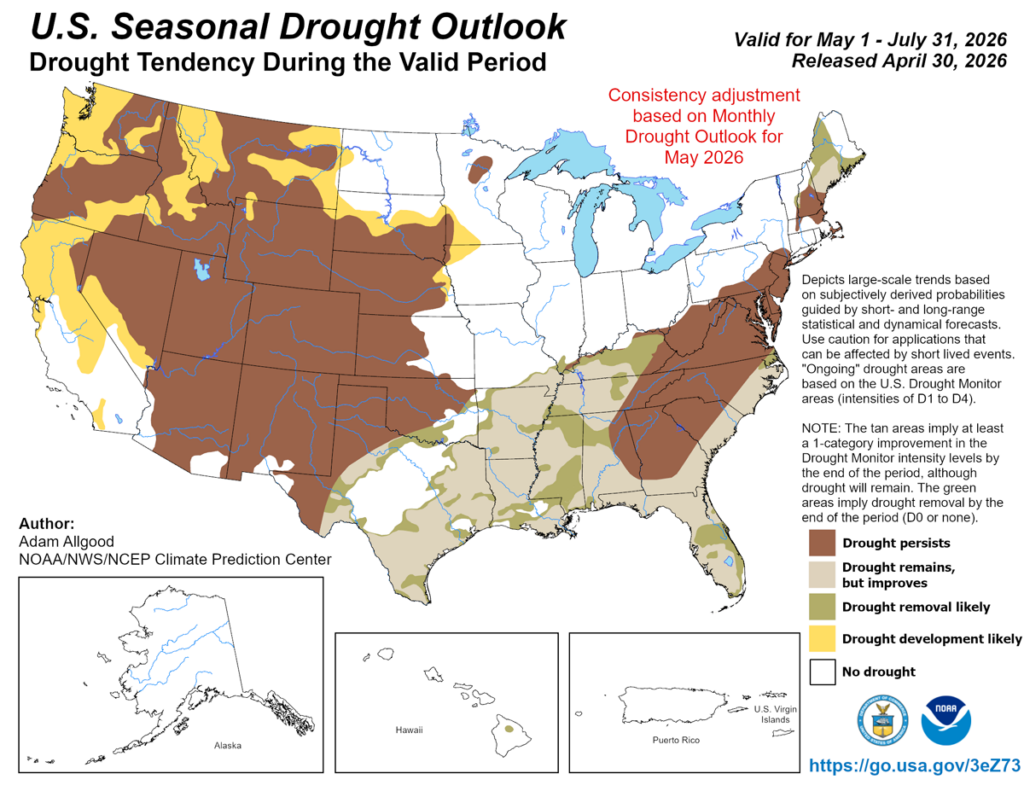
The above-average risk is fueled, in part, by a worsening drought affecting the Southeast alongside the drought in the West. As of 1 May, nearly 63% of the country was experiencing drought, and 19% of the country was experiencing extreme or exceptional drought, according to the U.S. Drought Monitor.
The Midwest and the Northeast will remain at an average significant fire potential from May to August, though northwestern Minnesota faces an above-average potential in May.
No place in the United States is projected to have a below-average significant fire potential through the end of August.
Preparing Amid Uncertainty
A developing El Niño—a climate phenomenon that affects heat storage in the ocean—could alter the fire risk projections. Scientists expect that a strong El Niño could lead to a below-normal hurricane season, worsening drought in the Southeast. In the Pacific, a strong El Niño could intensify the hurricane season, which may lower wildfire risk.
However, a stronger El Niño could drive more lightning strikes in the Sierra Nevada, which could increase fire risk there, Clements said. In 2020, for example—a strong El Niño year—Hurricane Elida in the Pacific contributed to a lightning outbreak that supercharged wildfires in the West.
“We’re still not sure exactly how [El Niño] is going to impact the season.”
“We’re still not sure exactly how [El Niño] is going to impact the season,” Wallmann said. As late summer approaches, meteorologists will better understand how El Niño will develop and affect wildfire risk.
Weather patterns can change, and day-to-day conditions still play a role in fire occurrence. “If the weather shifts, or we get a really big heat wave, it can modify [the forecast]. Or if it remains relatively moderate, that might lessen the fire danger,” Clements said. “We’ll just have to see how the weather plays out.”
Wallmann and Clements emphasized that those living in areas with elevated fire risk should be aware of their surroundings and think ahead about where they might go for safety should a wildfire occur. “Having that situational awareness ahead of time can help you make better decisions,” Wallmann said.
Citation: van Deelen, G. (2026), Most of the U.S. West will face above-normal wildfire risk this summer, Eos, 107, https://doi.org/10.1029/2026EO260145. Published on 11 May 2026.
Research & Developments is a blog for brief updates that provide context for the flurry of news that impacts science and scientists today.
In the contiguous United States, crop irrigation, municipal water supplies, and thermoelectric power generation use more than 224 billion gallons of fresh water every day. Conducting water research or making decisions about water use, until now, often required referencing datasets across various agencies. The U.S. Geological Survey (USGS) National Water Availability Assessment Data Companion (NWDC), announced this week, aims to streamline this process. In part, the tool is designed to help decisionmakers better understand the balance between how high demand and limited supply affect water availability in their communities.
“While the United States has abundant water nationally, regional imbalances between supply and demand may create water challenges affecting millions of Americans,” said lead scientist Shirley Leung in a USGSpress release. “What once required significant resources and time can now be done in minutes, giving communities of all sizes the same foundation for water planning.”
The lower 48 states are home to about 80,000 sub-watersheds, from those in the arid southwest to the Great Lakes Basin, where about 84% of North America’s surface fresh water is located. According to the USGS, the NWDC is the first tool that integrates information about water availability in individual watersheds at a national scale.
The tool is designed to complement Water Data for the Nation (WDFN), another USGS product that consolidates observational data from the agency’s thousands of local monitoring stations gathering data on streams, lakes, reservoirs, precipitation, water quality, and groundwater. The new tool uses modeling to fill in spatial and temporal gaps between the observations made at these stations.
Water managers, researchers, agricultural experts, and others can use the NWDC to compare watershed conditions, identify seasonal patterns in water use, or to create data visualizations of statewide water use, for example. Though the tool currently covers only the contiguous United States, it will soon be extended to Alaska, Hawaii, and Puerto Rico, according to the USGS.
David Tarboton, a professor of civil engineering at the Utah Water Research Laboratory, said he was “intrigued” by the new tool, and is interested in examining the data its model produces.
While Tarboton was disappointed that the tool’s most recent available data are from 2020, “having a sort of integrated, wall-to-wall dataset that’s consistently produced is very valuable,” he said. He works, in part, in the areas of hydroinformatics and data sharing, and noted that the modern methods the agency is using to share the data could be useful in developing automated tools.
These updates are made possible through information from the scientific community. Do you have a story about science or scientists? Send us a tip at eos@agu.org.
Annual inflation in Brazil accelerated to 4.14% in March, pushed higher by rising fuel and food prices, the Brazilian Institute of Geography and Statistics (IBGE) reported on Friday. The figure reverses the slowdown recorded in February, when the index had eased to 3.81%.
Brazilian financial markets posted one of their best sessions of the year on Monday after President Donald Trump announced a five-day postponement of strikes against Iran's energy infrastructure, citing “productive conversations” with Tehran.
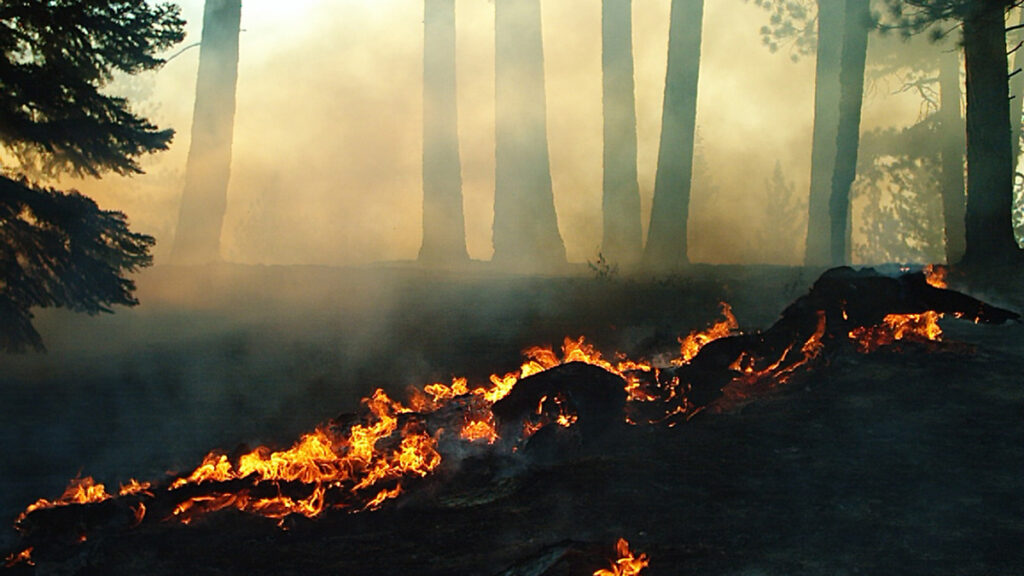
Hotter, drier conditions in the western United States have led to a rise in wildfire activity that has damaged or destroyed infrastructure, natural ecosystems, and entire towns across the region. As fires grow larger and more destructive, the cost of managing them rises as well.
Fire management agencies in the United States have been feeling the pressure. Between 2014 and 2023, fire management agencies across all levels of government experienced a 131% increase in total area burned and a 268% increase in total fire spending adjusted for inflation compared to the period between 1985 and 1994.
Today, federal agencies like the Department of the Interior (DOI) and the U.S. Department of Agriculture Forest Service (USFS) continue to invest in aiding states and managing hazardous fuel growth on public land, as well as suppressing active fires. Policymakers and federal agencies alike must decide how to manage limited budgets while protecting people, property, and natural resources.
Prestemon et al. built statistical models based on historical data to examine the potential increase in spending by the DOI and the USFS between now and 2100. Their models link wildfire activity to climate variables such as temperature and water vapor deficit and then connect fire activity to suppression costs. To capture a range of possible future conditions on federal lands, the study predicts 10 fire and suppression spending scenarios by applying five different climate models to two different warming pathways (the moderate Representative Concentration Pathways (RCP) 4.5 scenario and the high-emissions RCP 8.5 scenario).
The results varied by region and scenario, but each of the 10 scenarios suggested a rise in area burned as well as inflation-adjusted fire suppression spending, with higher fire activity translating to higher costs. Projected changes in DOI and USFS land burned increased 80% by mid-century and 208% by late century.
By the middle of the century, both agencies are projected to see spending increases: about 0.65% per year for DOI spending and about 0.87% per year for USFS spending from 2020 to 2100. Although uncertainty increased with time and outcomes varied across climate models and warming pathways, the largest increases in both cost and wildfire activity were consistently projected for the northwestern United States. (Earth’s Future, https://doi.org/10.1029/2025EF007985, 2026).
Citation: Owen, R. (2026), As wildfires increase in the West, so does suppression spending, Eos, 107, https://doi.org/10.1029/2026EO260187. Published on 10 June 2026.
Across the western United States, wildfires are increasing in size and intensity. As the climate continues to warm, more extreme wildfires will reshape landscapes and pose a growing risk to human health and natural ecosystems throughout the West.
Climate models, used to predict other effects of climate change, are unable to directly simulate wildfires. Instead, researchers link previously burned areas to climate variables such as temperature, precipitation, drought, and evaporation, then apply those relationships to future climate projections.
Many recent studies have connected higher vapor pressure deficit (VPD)—a measure of atmospheric dryness—to more area burned in previous fires. VPD increases as the temperature rises, so models that rely on it generally predict an increase in wildfire activity as the climate warms.
Cheng et al. raise questions about the role VPD plays in modeling wildfire, suggesting that VPD is a poor measure of fuel dryness at larger scales and overestimates potential burned areas under significant warming conditions. Instead, researchers suggest soil moisture could be a more reliable indicator of fuel dryness and lead to more moderate projections of wildfire increases.
The researchers looked at five forested ecoregions in the western states. Using the Western US MTBS-Interagency wildfire dataset from 1984 to 2020 combined with climate data (temperature, VPD, and soil moisture), the researchers analyzed drivers of the area burned from May through October. They connected this information with output from climate models to look at future burn potential.
VPD-based wildfire predictions increase sharply under warming conditions. These predictions showed that under 3°C of average global warming, 16 times as much land would burn by the end of the century, compared to historical levels. Under 4°C of warming, up to 66 times more land would burn by the end of the century. This “truly massive” increase, the authors say, would mean fires consuming vegetation almost as soon as it regrows.
Soil moisture, on the other hand, provides a more moderate, though still concerning, picture. Under the same warming scenarios, soil moisture changes would lead to an increase in burned area of only 2–3 times that of the historical period. The researchers argue that projections relying on VPD severely exaggerate wildfire risk. (AGU Advances, https://doi.org/10.1029/2026AV002350, 2026)
Citation: Owen, R. (2026), How much will western wildfires worsen under warming?, Eos, 107, https://doi.org/10.1029/2026EO260147. Published on 15 May 2026.


 Brazilian President Luiz Inácio Lula da Silva on Tuesday rejected the US government's argument that Brazil engages in “unreasonable” practices in the bilateral relationship, arguing that it is Washington that runs a trade surplus with his country. If anyone should impose tariffs, he said, it would be Brazil.º
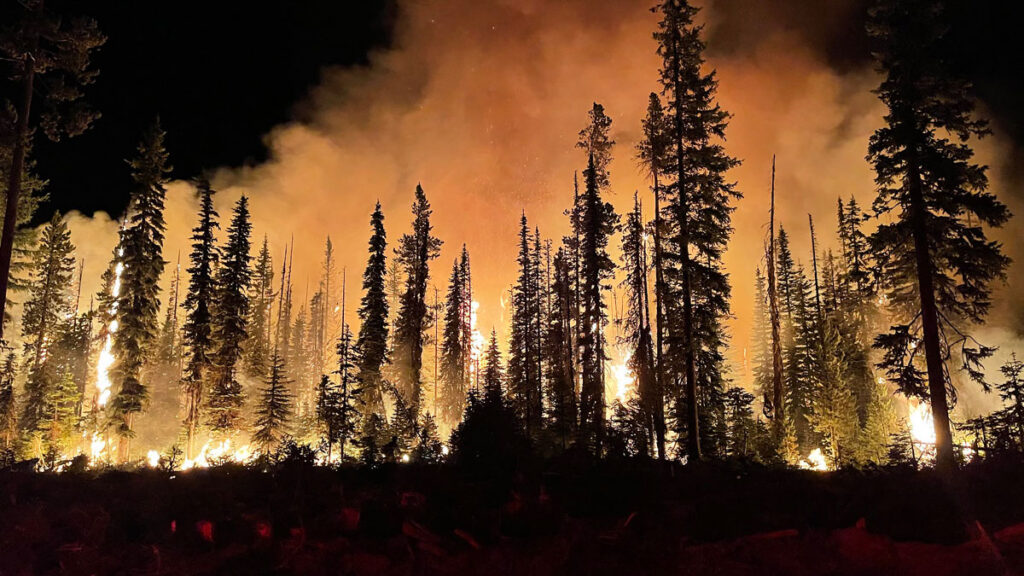

 Annual inflation in Brazil accelerated to 4.14% in March, pushed higher by rising fuel and food prices, the Brazilian Institute of Geography and Statistics (IBGE) reported on Friday. The figure reverses the slowdown recorded in February, when the index had eased to 3.81%.
 Brazilian financial markets posted one of their best sessions of the year on Monday after President Donald Trump announced a five-day postponement of strikes against Iran's energy infrastructure, citing “productive conversations” with Tehran.
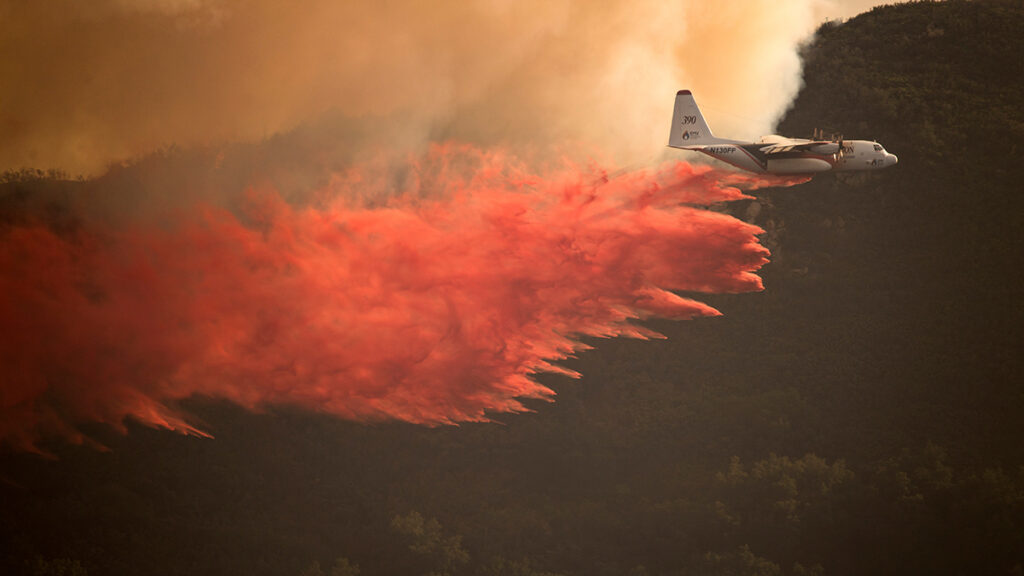
