Reading view

Interstellar Comet Was Born in a Very Cold Place

A bright white point is surrounded by a large, soft blue glow that fades gradually into a dark background. Thin, faint streaks appear diagonally across the image, suggesting motion or stars in the distance. The overall effect is of a luminous object in space, radiating light against a deep, dark backdrop.

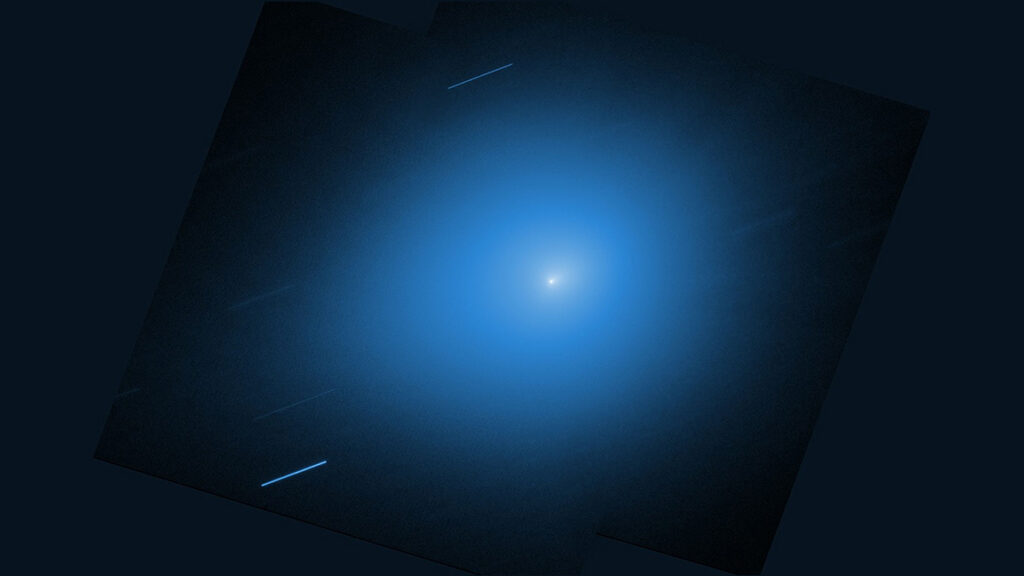
In late 2025, astronomers spotted an interstellar comet making a quick trip through the solar system. 3I/ATLAS was discovered in July when it was just inside Jupiter’s orbit. It’s now about halfway between Jupiter and Saturn and getting farther away every day.

A bright, oval shape glows near the center of a black, star-filled sky as it moves diagonally toward the top right of the frame. It has a soft halo around it and a faint, wispy tail stretching downward. Countless tiny white stars dot the background.
The European Space Agency’s Jupiter Icy Moons Explorer (ESA JUICE) mission, on its way to Jupiter, imaged 3I/ATLAS on 5 November 2025 when the comet was 64 million kilometers from the spacecraft. Credit: ESA/Juice/JANUS, CC BY-SA 3.0 IGO

Astronomers have been observing 3I/ATLAS throughout its journey inward toward the Sun and back out again, compiling the most comprehensive and detailed view thus far of an interstellar object, including the chemistry of the gases that sublimated from its surface and formed its coma and tail.

In a first-of-its-kind observation of an interstellar object (ISO), researchers have discovered that the ratio of deuterium to hydrogen in 3I/ATLAS’s outgassed water is 30–40 times higher than in solar system objects. That suggests that the comet formed in a much colder environment than our own solar system did.

“It is always hard to really pinpoint where these objects form,” said Luis E. Salazar Manzano, the lead researcher on these observations and a doctoral student at the University of Michigan in Ann Arbor. “We know that they were formed in different parts of the galaxy, but it’s hard to connect what we measure with how they were formed. These types of measurements, such as the relative abundance of deuterium to hydrogen in water, are one of the best ways we have to actually [learn] about their forming conditions and their evolution.”

Coming In from the Cold

Water appears to be ubiquitous throughout the universe, sprinkled within distant galaxies and in star-forming nebulae. But there are different flavors of water: heavy, semiheavy, and plain old H2O. In the molecular clouds where stars form, the cold environment favors a chemical reaction that increases the amount of gaseous deuterium (D), an isotope of hydrogen, relative to regular hydrogen atoms. That deuterium then bonds with hydrogen and oxygen atoms to create semiheavy water, or HDO.

By measuring the quantity of semiheavy water relative to regular water in an object, scientists can infer the object’s ratio of deuterium to hydrogen, or D/H, and decode the physical conditions in which that water formed. Astronomers have made such measurements for baby stars, planet-forming disks, solar system comets, and meteorites, as well as Earth’s ocean.

“What is fundamentally important about ISOs is that they are physical leftovers of the process of forming another planetary system and they can give us clues to that process,” said Karen Meech, an astrobiologist at the University of Hawaiʻi at Mānoa who was not involved with this research.

“The conditions in the stellar system in which 3I/ATLAS formed may have been quite different from the one in the solar system.”

The team observed 3I/ATLAS with the Atacama Large Millimeter/submillimeter Array (ALMA) in Chile on November 2025 when the comet was 335 million kilometers (208 million miles) from Earth. It had just passed its closest approach to the Sun and was as bright as it was ever going to be. This timing was critical for the measurements the team wanted to make because the signal for HDO is very subtle, especially when it has to compete with the much more abundant H2O in the comet and within Earth’s atmosphere, Salazar Manzano explained.

Those measurements showed that for every 1,000 hydrogen atoms in 3I/ATLAS, there were about 5–7 deuterium atoms. While that’s not a lot, the ratio is still at least 40 times more than what’s found in ocean water and at least 30 times the average value in solar system comets.

“The conditions in the stellar system in which 3I/ATLAS formed may have been quite different from the one in the solar system,” said Paul Hartogh, a physicist and atmospheric science researcher at the Max Planck Institute for Solar System Research in Göttingen, Germany.

The first interstellar object, 1I/ʻOumuamua, did not outgas any material, and although the second object, 2I/Borisov, did, it was not bright enough to detect deuterium. 3I/ATLAS was the first opportunity astronomers had to measure the D/H ratio of an interstellar comet. Those measurements suggest that 3I/ATLAS formed in a much colder galactic environment than the solar system did, less than 30°C above absolute zero. The team published these results in Nature Astronomy in April.

Planning for the Next Interstellar Visitor

Hartogh, who was not involved with this research, said that on the one hand, 3I/ATLAS’s high deuterium enrichment is surprising because it is higher than that of any known comet. On the other hand, he added, some scientists predicted such high values for cometary water several decades ago.

Meech said she found these results “really interesting.” She never expected all other solar systems to have formed just like ours, and 3I/ATLAS fits with that idea.

“This gives us an intriguing look into the processes of planetary system formation—and that there are differences from our own solar system,” Meech said. “It is too early to tell what this implies for the formation of planets or habitable worlds. We are just at the beginning of an exciting story.”

“The fact that we were able to make this measurement with 3I will allow us to better prepare what to expect with the next generation of interstellar objects.”

3I/ATLAS is getting harder to see with telescopes, but astronomers still have a lot of data from when it was much brighter to go through, Salazar Manzano said. Teams around the world are working on creating a holistic picture of the comet’s chemistry and evolution.

What’s more, “the fact that we were able to make this measurement with 3I will allow us to better prepare what to expect with the next generation of interstellar objects,” Salazar Manzano said.

Scientists expect that the Vera C. Rubin Observatory could discover between 6 and 51 interstellar objects within the next 10 years. If objects are detected early enough in their journey through the solar system, “there may be enough time to coordinate observations with ground-based and spaceborne telescopes, taking advantage of the recent experience gained by the multiple 3I/ATLAS observations,” Hartogh said.

“These are rare opportunities to study another planetary nursery up close, and we have to take advantage of each new ISO to learn as much as we can,” Meech said. “It may be harder for a large number of individual teams to get all the data they want, so I think coordination and collaboration is needed more than ever.”

—Kimberly M. S. Cartier (@astrokimcartier.bsky.social), Staff Writer

Citation: Cartier, K. M. S. (2026), Interstellar comet was born in a very cold place, Eos, 107, https://doi.org/10.1029/2026EO260141. Published on 7 May 2026.
Text © 2026. AGU. CC BY-NC-ND 3.0
Except where otherwise noted, images are subject to copyright. Any reuse without express permission from the copyright owner is prohibited.
  •  

This Arctic Atlas Shows Where Oil and Gas Activities Overlap with Wildlife and Indigenous Communities

Industrial facilities cover a small island, with gray-blue water in the foreground.

Scientists agree that to have a chance of keeping the world’s warming below the Paris Agreement limit of 1.5°C (2.7°F), humanity needs most oil, gas, and coal to remain in the ground. This “unburnable” or “unextractable” carbon would not contribute to global carbon emissions.

But where, exactly, should we prioritize shutting down or banning fossil fuel activities? A new study published in PLoS One provides an answer for the Arctic with an atlas showing where oil and gas activities overlap with vulnerable ecosystems, important wildlife species, and Indigenous land.

“We’re investigating the idea of unburnable carbon with a geographical perspective,” said Daniele Codato, a geographer at the Università de Padova in Italy and lead author of the new study. “We focus on where to keep oil and gas underground.”

The atlas is meant to help decisionmakers prioritize areas where it is essential to avoid opening new frontiers or where current oil and gas extraction should be halted because of social, cultural, ecological, or climate justice criteria, he said.

Overlaps, Mapped

Codato and a team of researchers created their Arctic atlas with dozens of public datasets from five Arctic polities known to have oil and gas activities (Alaska (United States), Canada, Greenland (Denmark), Norway, and Russia). Though various geographic definitions of the Arctic exist, the team chose a boundary used to evaluate wildlife and conservation by the Conservation of Arctic Flora and Fauna (the biodiversity working group of the Arctic Council, an intergovernmental organization focused on Arctic governance) to include the largest possible portion of vulnerable ecosystems.

The resulting maps revealed more than 512,000 square kilometers—an area about the size of Spain—of Arctic territory with existing or planned fossil fuel activities, including leases, areas under bid, exploration licenses, and infrastructure. Within those areas, the researchers counted 44,539 active wells and nearly 40,000 kilometers (about 25,000 miles) of pipelines.

A map of the Arctic shows oil and gas well density. The highest density of oil and gas wells is in northwestern Canada, northern Alaska, and northern Russia.
Oil and gas wells in the Arctic are highly concentrated in northwestern Canada, northern Alaska, and northern Russia. The CAFF boundary identifies the Arctic region as defined by the Conservation of Arctic Flora and Fauna (the biodiversity working group of the Arctic Council). Click image for larger version. Credit: Codato et al., 2026, https://doi.org/10.1371/journal.pone.0345775

Next, the researchers determined how oil and gas activities overlapped with protected areas defined by the International Union for Conservation of Nature and conservation priority areas defined by three other nongovernmental organizations. Fossil fuel activities threaten wildlife by altering habitats, disrupting migratory routes, and releasing pollutants.

Of the area containing oil and gas activities, more than 7% overlapped with ecologically protected areas, and more than 13% overlapped with the ranges of all of the three key Arctic species considered in the study: polar bears, yellow-billed loons, and caribou. The highest concentrations of oil and gas activities were in the Yamal Peninsula of Russia, northwestern Canada, and the North Slope of Alaska, all home to fragile ecosystems.

A map of the Arctic shows where oil and gas wells overlap with protected areas in the Arctic.
Seven percent of Arctic fossil fuel extraction areas mapped by the research team overlapped with ecologically protected areas. In some cases, such as in the Yamal`skij Nature Reserve in Russia (top right), protected area borders have been cut or delimited to avoid overlapping with protected area boundaries, possibly indicating that protected areas have been downsized or redesigned to accommodate fossil fuel infrastructure. ANWR = Arctic National Wildlife Refuge. Click image for larger version. Credit: Codato et al., 2026, https://doi.org/10.1371/journal.pone.0345775
A map of the Arctic shows where oil and gas activities overlap with the ranges of three key Arctic species: polar bears, yellow-billed loons, and caribou.
Mapping revealed that 87.21% of leases in Alaska and more than 13% of total Arctic concessions for fossil fuel activities overlapped with the ranges of all three of the key Arctic species considered in the study (polar bears (Ursus maritimus), caribou (Rangifer tarandus), and yellow-billed loons (Gavia adamsii)). Click image for larger version. Credit: Codato et al., 2026, https://doi.org/10.1371/journal.pone.0345775

The researchers also discovered that 73% of land with oil and gas activities overlapped with Indigenous Peoples’ lands, defined in the study as lands where Indigenous communities maintain significant influence over land management. Fossil fuel activities can threaten Indigenous communities’ health and ways of life, though the authors note that overlaps between Indigenous Peoples’ lands and fossil fuel activities do not necessarily indicate an opposition between the two.

A map of the Arctic shows where oil and gas activities overlap with Indigenous lands.
Oil and gas concessions cover more than 4% of Indigenous Peoples’ lands (IPLs) in the Arctic. Click image for larger version. Credit: Codato et al., 2026, https://doi.org/10.1371/journal.pone.0345775

“It’s a really interesting idea to create an atlas of unburnable carbon and try to make visible where tensions might occur between Indigenous land, ecosystems, [and fossil fuel activities],” said Mariel Kieval, a researcher at the Arctic Institute, a nonprofit research organization. The overlaps noted in the atlas are an “initial indicator” providing opportunities for further research that zooms in on specific areas, she said.

Kieval also said the atlas could be helpful for local communities trying to identify where extraction activities are occurring nearby.

Policy Paradigm

The atlas’s effort to express the urgency of action to the public and policymakers is useful, said Paul Ekins, an economist at University College London who was part of the team that coined the term “unburnable carbon.” “Any way in which atlases or discussions or slogans can up the political ante so that politicians become braver in seeking to address this issue is to be welcomed.”

In particular, Codato hopes the atlas will fuel a “paradigm shift” in global policy that would ultimately ban the proliferation of fossil fuel activities in the Arctic.

The need for an intergovernmental ban on fossil fuel activities is evidenced by the Arctic National Wildlife Refuge in Alaska, Codato said: The refuge received temporary protections against drilling under the Biden administration, but the Trump administration plans to open the refuge for oil and gas leases this summer. “We need something stronger” to avoid such administration-by-administration changes in Arctic protections, he said.

“If we don’t start to ban fossil fuels in the Arctic now, it could become another sacrifice zone.”

Such a paradigm shift will be more important than ever as warming in the Arctic provides new access to resources and opportunities for trade that may accelerate ecological and cultural disruptions. “If we don’t start to ban fossil fuels in the Arctic now, it could become another sacrifice zone,” like some parts of the Amazon rainforest, Codato said.

Policy actions have fallen far behind the science, Ekins said. “There should have been an agreement not to exploit fossil fuels in the Arctic well before the ice had melted to a sufficient extent to make that a practical possibility.”

In 2023, the research team published a similar atlas identifying unburnable carbon in the Ecuadorian Amazon and plans to continue to expand their atlas to include the rest of the world. The team is currently working on projects that cover Brazil, Italy, Nigeria, and the United Kingdom.

Codato said he hoped the Arctic atlas would inform discussions to update the European Union’s Arctic policy that are scheduled to occur this year.

—Grace van Deelen (@gvd.bsky.social), Staff Writer

Citation: van Deelen, G. (2026), This Arctic atlas shows where oil and gas activities overlap with wildlife and Indigenous communities, Eos, 107, https://doi.org/10.1029/2026EO260139. Published on 7 May 2026.
Text © 2026. The authors. CC BY-NC-ND 3.0
Except where otherwise noted, images are subject to copyright. Any reuse without express permission from the copyright owner is prohibited.
  •  

Martian Aerosols Reveal Dynamics of Dust and Cloud Transport

Illustration of a satellite over the surface of Mars.
Editors’ Highlights are summaries of recent papers by AGU’s journal editors.
Source: Journal of Geophysical Research: Planets

Dust and water ice clouds are ubiquitous on Mars; they regulate the planet’s climate and can affect measurements of other atmospheric components. Constraining their spatial and temporal variability is also essential for improving Martian general circulation models.

Fedorova et al. [2026] use solar occultation measurements from the SPICAM infrared spectrometer on board the Mars Express orbiter to characterize nine Martian years (MY 28 through 36) of dust and water ice clouds. Because the spectrometer could not distinguish between these particles’ types, the researchers employ a new method integrating Mars Climate Sounder data and general climate model predictions to identify them.

The analysis reveals that the particles can reach altitudes up to 80 kilometers during perihelion, while their size remains relatively uniform with height. This suggests that Martian dust distribution is driven more by atmospheric dynamics and horizontal transport, capable of lifting and moving particles over vast distances, rather than by turbulent mixing against gravity alone.

The study also provides a detailed seasonal and spatial climatology of major Martian atmospheric features, including the Polar Hood Clouds, the Aphelion Cloud belt, and the Mesospheric Clouds. The detection of high-altitude clouds (70–90 km) during dust events confirms enhanced transport of water vapor into the upper atmosphere during both global and regional storms. These findings are consistent with simultaneous observations from the Atmospheric Chemistry Suite on the Trace Gas Orbiter.

These observations show that large-scale atmospheric dynamics, rather than local mixing alone, control how aerosols are distributed vertically on Mars, with important implications for the transport of water to the upper atmosphere and the planet’s climate evolution.

The figure shows how the water ice cloud layers vary with latitude and season (Ls), based on SPICAM observations. (a) altitude of the cloud layer in kilometers; (b) thickness of the cloud (optical depth); (c) average size of the ice particles in micrometers; and (d) number of particles within the layer (number density. The background color is the amount of dust in the atmosphere from Montabone et al. [2015]: red areas indicate high dust levels, while dark blue areas indicate low dust. Black open circles mark locations where no clear water ice clouds were detected. Credit: Fedorova et al. [2026], Figure 12

Citation: Fedorova, A. A., Luginin, M., Montmessin, F., Korablev, O. I., Bertaux, J.-L., Stcherbinine, A., & Lefèvre, F. (2026). Multiyear monitoring of aerosol vertical distribution on Mars by SPICAM IR/MEX. Journal of Geophysical Research: Planets, 131, e2025JE009388. https://doi.org/10.1029/2025JE009388  

—Arianna Piccialli, Associate Editor, and Beatriz Sanchez-Cano, Editor, JGR: Planets

Text © 2026. The authors. CC BY-NC-ND 3.0
Except where otherwise noted, images are subject to copyright. Any reuse without express permission from the copyright owner is prohibited.
  •  

The 10 August 2025 landslide and tsunami at Tracy Arm fjord in Alaska

A mountainside stripped of trees has some dead vegetation still visible.

A wonderful new paper on the huge Tracy Arm landslide and tsunami will have profound but challenging implications for the management of risk in an age of increased tourism and rapid climate change.

Image of a landslide partially covered with a transparent sand-colored overlay and the words “The Landslide Blog,” centered, in white

The journal Science has published an excellent new paper (Shugar et al. 2026) that examines the extraordinary 10 August 2025 landslide and tsunami at Tracy Arm fjord in Alaska. The paper is open access, so you can read it for yourself (it is very accessible), and there has been a plethora of media coverage (quite rightly).

I wrote about this event at the time and in the aftermath, but Shugar et al. (2026) is the authorative source. There is little for me to add to the science, but AGU Eos has a really excellent write up and explainer that I thoroughly recommend.

That large landslides occur in fjords is not a surprise, and that they can generate enormous displacement waves is also not news. We know that landslide occurrence in these environments in general is increasing, and specifically so in Alaska. However, this paper is the most comprehensive and systematic analysis of such an event, and it has shown the remarkable threat that these events can generate. The tsunami created by this landslide had a 481 metre run-up; it is remarkable that there were no fatalities. If a large cruise ship had been in the area, with passengers being ferried ashore on small boats and exploring the shoreline, the consequences would have been catastrophic. It is unsurprising then that cruise companies are now amending their itineraries.

The USGS released the image below of the aftermath of the landslide and tsunami – scale is hard to understand in such images, but the crown of the landslide is over 1,000 metres above the level of the fjord, and the landslide had a subaerial volume of over 63 million cubic metres.

A photo shows a mountainside with a large wedge of lighter-colored rock, above a churning channel of water. The foot of a glacier can be seen at the lower edge of the image.
This aerial photo shows the north side of Alaska’s Tracy Arm Fjord in the aftermath of the 2025 landslide and tsunami. The lighter-colored rock is the exposed surface, where the mountainside collapsed and fell into the water. The foot of South Sawyer Glacier is visible at lower right; in decades past, the ice extended much farther and was thick enough to hold the rock slopes in place. Credit: Cyrus Read/U.S. Geological Survey

Shugar et al. (2026) has a brief section that examines the implications of this event, and of the understanding that it provides of the hazards posed by very large landslides in fjord settings. These are locations with extensive human activity – local communities, trade, fishing and tourism. There is some evidence that these landsldies are more likely to occur in the spring and summer months, when human occupation is higher. Our resilience to a tsunami wave that starts off being hundreds of metres high is low.

A case in point lies in Milford Sound in New Zealand, where (for example) an earthquake on the Alpine Fault has the potential to trigger a large landslide that could result in a major tsunami. Milford Sound is an extremely popular tourism location. Should such an event occur, and mass fatalities result, there is no doubt that the public inquiry would find that the societal risk was known and that it was probably unacceptable. However, to ban tourism, including cruise ships, in this area would carry heavy risks in its own right – it would profoundly impact the vital tourist economy of the area, on which many livelihoods depend. This is a substantial risk in its own right, and of course politics plays a major part too. Balancing these risks is a major challenge for any society.

Some hope is offered by the fact that this landslide showed substantial precursory seismic activity, which might represent a route to providing a warning for at least some of these rock slope failures. But research in this area is immature at the moment, and of course there will be no warning for a landslide triggered by a major earthquake.

So, the landslide at Tracy Arm fjord presents us with a host of major challenges, but it also represents a big step forward in our understanding of these events. Well done to Dan and his colleagues for another brilliant paper. I shall watch the debate with great interest.

Reference

Shugar et al. 2026. A 481-meter-high landslide-tsunami in a cruise ship–frequented Alaska fjord. Science, eaec3187. DOI:10.1126/science.aec3187

Text © 2026. The authors. CC BY-NC-ND 3.0
Except where otherwise noted, images are subject to copyright. Any reuse without express permission from the copyright owner is prohibited.

  •  

The Forensics of a Skyscraper-Sized Tsunami

A photo shows a mountainside with a large wedge of lighter-colored rock, above a churning channel of water. The foot of a glacier can be seen at the lower edge of the image.

In the early morning of 10 August 2025, a mountainside collapsed into the waters of Tracy Arm Fjord in southeastern Alaska.

This massive landslide produced a tsunami that reached 481 meters on the opposite side of the fjord—higher than all but the world’s 14 tallest buildings—and registered on seismic detectors around the globe. For days after the slope collapsed, the waters of the fjord churned with a standing wave known as a seiche.

This drone video shows a man paddling through the iceberg-filled Tracy arm fjord in the aftermath of a landslide. Credit: Bill Billmeier

This event was the second-largest tsunami ever recorded and the largest not linked to an earthquake. A new paper published in Science presented strong evidence that the Tracy Arm landslide was instead the result of the rapid retreat of South Sawyer Glacier, itself a consequence of global climate change.

“It’s like if you have a kid and they said they cleaned their room but really all they did was throw everything in the closet. As soon as you open that door, everything falls out.”

Nobody was harmed by the rockslide or tsunami, but cruise ships were scheduled to visit the fjord later that morning. If the collapse had happened just a few hours later, it could have been disastrous.

“While the [South Sawyer] Glacier is in the fjord, it’s supporting those valley walls, like the buttresses on a cathedral,” said Daniel Shugar, a geomorphologist at the University of Calgary who led the study. “As that glacier retreated over the last few decades, it retreated just past the spot that did fail. It’s like if you have a kid and they said they cleaned their room but really all they did was throw everything in the closet. As soon as you open that door, everything falls out.”

This animation shows an overhead view of the 10 August 2025 Tracy Arm landslide. Credit: Patrick Lynett, University of Southern California

In other words, the glacier that carved the fjord in the first place was also holding its slopes in place, and the ice’s retreat under warming temperatures exposed rock that became vulnerable to crumbling. The proximate cause of the landslide might have been something else—as Shugar noted, rainfall is plentiful in that part of Alaska, which could have weakened the fjord’s walls further—but it might also have been a combination of small, individually insignificant factors. In any case, the removal of that glacial “closet door” was what made the collapse and tsunami possible.

“We know that steep slopes are very sensitive to the things that climate [change] is exacerbating, whether it’s losing permafrost, glacier retreating, or more water in the soil,” said glaciologist Leigh Stearns of the University of Pennsylvania, who was not involved with the Tracy Arm study. “Often, we think of glacier retreat as a long and continuous thing, but [it] can trigger sudden catastrophic events.”

This aerial photo shows the highest run-up resulting from the 10 August 2025 landslide-triggered tsunami in Tracy Arm. It was captured during a U.S. Geological Survey field reconnaissance overflight on 13 August 2025. Credit: John Lyons/U.S. Geological Survey.

The researchers shared their findings at a press briefing on Wednesday at the European Geosciences Union 2026 General Assembly.

Debuttressing and Slope Instability

The Tracy Arm tsunami, like the record-setting Lituya Bay 524-meter megatsunami in 1958, was so dramatic in part because it happened in a fjord. The steep sides of the relatively narrow channel concentrated the energy generated by the rockfall into water.

A drone video shows the tsunami-affected part of the fjord, including the highest run-up area and the landslide itself. Credit: Bill Billmeier

Unlike Lituya Bay, which resulted from an earthquake, Tracy Arm provided very little seismic warning before the slope collapsed, requiring forensic work to determine what caused it.

Shugar noted that South Sawyer Glacier had retreated by roughly 500 meters in the spring of 2025 alone, on top of the general trend of shrinking and thinning over the decades. And it’s not alone: Interferometric synthetic aperture radar (InSAR) images taken by satellites indicate that many slopes in Alaska and beyond are in motion, pointing to potential future danger.

“Not every single one, but it seems like a huge majority of [shifting slopes] are above the lower parts of thinning glaciers,” Shugar said. He described this phenomenon as “debuttressing,” as in losing the glacial buttress holding a slope up. He added, “I think in the next 5 years or so, we’ll probably have a much better understanding of just how and how quickly slopes respond to that debuttressing.”

Threats, Hazards, and Climate Change

“We were unbelievably lucky that the [tsunami] occurred with the timing that it did, and not 5 hours later.”

Most tsunamis are set in motion by earthquakes and travel across the open ocean, wreaking their destruction when they reach shallower water near coasts; the word “tsunami” means “harbor wave” in Japanese. The Tracy Arm tsunami joined the ranks of other landslide-driven tsunamis, like the ones in Taan Fiord (Alaska) and Dixon Fjord (Greenland), in being linked to human-driven climate change. Beyond the immediate impact of the waves, this category of hazard requires rethinking potential risks from abrupt catastrophes like debuttressing as well as slower effects such as sea level rise.

“The risk to any particular cruise ship [from a tsunami] on any particular day is very low,” Shugar said. “We were unbelievably lucky that the [tsunami] occurred with the timing that it did, and not 5 hours later. The risk certainly still could be increasing as we build new settlements, new mining camps, or new oil and gas infrastructure.”

Both Shugar and Stearns highlighted the importance of learning lessons from Tracy Arm and related events.

“Climate is a threat multiplier, and the research is really forcing us to look at these cascading hazards,” Stearns said. Tracy Arm “is one example of this: Small slow changes can trigger big events. Hopefully, we don’t need so many disasters to spur some change.”

A drone video shows Sawyer Island in the Tracy Arm Fjord and evidence of the tsunami on the fjord walls. Credit: Bill Billmeier

—Matthew R. Francis (@BowlerHatScience.org), Science Writer

Citation: Francis, M. R. (2026), The forensics of a skyscraper-sized tsunami, Eos, 107, https://doi.org/10.1029/2026EO260140. Published on 6 May 2026.
Text © 2026. The authors. CC BY-NC-ND 3.0
Except where otherwise noted, images are subject to copyright. Any reuse without express permission from the copyright owner is prohibited.

💾

This aerial photo shows the north side of Alaska’s Tracy Arm Fjord in the aftermath of the 2025 landslide and tsunami. The lighter-colored rock is the exposed surface, where the mountainside collapsed and fell into the water. The foot of South Sawyer Glacier is visible at lower right; in decades past, the ice extended much farther and was thick enough to hold the rock slopes in place. Credit: Cyrus Read/U.S. Geological Survey
  •  

Taking the Pulse of Atmospheric Drag to Predict Satellite Trajectory

Illustration of a satellite orbiting Earth.
Editors’ Highlights are summaries of recent papers by AGU’s journal editors.
Source: AGU Advances

In low Earth orbit (typically below about 700 kilometers altitude), atmospheric drag is the primary source of uncertainty when predicting the trajectories of satellites. These prediction errors largely arise from limitations and inaccuracies in the models used to estimate the density of the upper atmosphere, particularly within the thermosphere.

Mutschler et al. [2026] introduce a new method for estimating atmospheric density along the path of an individual satellite by using Energy Dissipation Rates (EDRs). The derived single-satellite density measurements provide valuable insight into variations in thermospheric density and can help characterize how the upper atmosphere responds to disturbances such as geomagnetic storms. Incorporating these observations can contribute to ultimately improving the accuracy of satellite orbit predictions.

Effective density and Space Force effective density estimated by the Kosmos 1508 satellite (plotted on the right-hand y axes) compared to estimates from satellites Swarm-A and Swarm-C (plotted on the left-hand y-axes). Credit: Mutschler et al. [2026], Figure 17a

Citation: Mutschler, S., Pilinski, M., Zesta, E., Oliveira, D. M., Delano, K., Garcia-Sage, K., & Tobiska, W. K. (2026). First results of a new inversion tool for thermospheric neutral mass density computations during severe geomagnetic storms. AGU Advances, 7, e2025AV002079. https://doi.org/10.1029/2025AV002079

—Alberto Montanari, Editor-in-Chief, AGU Advances

Text © 2026. The authors. CC BY-NC-ND 3.0
Except where otherwise noted, images are subject to copyright. Any reuse without express permission from the copyright owner is prohibited.
  •  

Number of Scientific Publications from EPA Authors Has Dropped During Trump Administration

Silhouettes of people in lavender and periwinkle stand, some overlapping, on a aubergine-colored background. Overlying the image at the bottom is the text “R&D Research and Developments.”

Research & Developments is a blog for brief updates that provide context for the flurry of news regarding law and policy changes that impact science and scientists today.

The number of peer-reviewed scientific studies authored by scientists at the EPA has declined since the beginning of Donald Trump’s second administration, according to a new analysis.

The analysis was published by Public Employees for Environmental Responsibility (PEER), a nonprofit organization that advocates for public employees in the natural resource and environmental professions. The report tracks the number of peer-reviewed scientific studies authored by EPA scientists since 1977. 

According to PEER’s analysis, 61 peer-reviewed publications by EPA scientists have been published so far this year, putting the agency on track to publish 183 articles by the end of 2026. That would be 67% of the number of articles published the previous year and 54% of the number of articles published in 2024.

“These numbers represent a diminution of scientific contributions from the fewer, remaining EPA scientists,” Kyla Bennett, a science policy director at PEER and a former EPA attorney, said in a statement. “The net result is that the scientific contribution of EPA to a greater understanding of what affects human health and the environment will be diminished.”

chart visualization
The number of peer-reviewed publications authored by EPA scientists in 2026 will be just over half of the number published in 2024, if current publication rates continue. As of 5 May, 2026, EPA authors have published 61 peer-reviewed articles for the year. Credit: PEER, Grace van Deelen

Peer-reviewed publications can take years to review and publish, meaning the work for a publication may have occurred during a previous administration. But the decline in publications may indicate a shift away from long-term basic research at the agency, according to PEER. 

Since Trump took office, hundreds of scientists have been terminated from the EPA or have chosen to resign, and scientists working within at least one of its research office have been told to pause efforts to publish research, representing “millions of dollars of research, potentially, that’s now being stopped,” one EPA employee told The Washington Post anonymously.

In February, the EPA took final steps to eliminate the Office of Research and Development, the arm of the agency responsible for conducting research. In its place, Administrator Lee Zeldin announced that a new office, called the Office of Applied Science and Environmental Solutions, would be formed but would not operate as a separate division. 

Six EPA scientists who signed an open letter expressing frustration about changes to the agency, including the elimination of the Office of Research and Development, were terminated and have filed claims with the federal government arguing that their terminations were illegal retaliation.

—Grace van Deelen (@gvd.bsky.social), Staff Writer

These updates are made possible through information from the scientific community. Do you have a story about how changes in law or policy are affecting scientists or research? Send us a tip at eos@agu.org.

A photo of a hand holding a copy of an issue of Eos appears in a circle over a field of blue along with the Eos logo and the following text: Support Eos’s mission to broadly share science news and research. Below the text is a darker blue button that reads “donate today.”
Text © 2026. AGU. CC BY-NC-ND 3.0
Except where otherwise noted, images are subject to copyright. Any reuse without express permission from the copyright owner is prohibited.
  •  

Where Was Baltica 616 Million Years Ago?

Two people, one wearing a yellow vest and one in a gray long-sleeved shirt, look up at a rock face.
Source: Geochemistry, Geophysics, Geosystems

About 600 million years ago, the continents wandered Earth, yet to settle into their current positions. Their locations during the Ediacaran (as this time is called) have been tough for scientists to pin down. Earth’s magnetic field appears to have behaved in erratic ways, and applying standard techniques to calculate the continents’ positions based on records of the magnetic field yields implausible results. In particular, scientists debate the location of an ancient continent called Baltica, which is now part of Europe.

To investigate, Xue et al. traveled to Egersund, Norway, to collect samples of rock that formed during a time when Baltica’s crust was being pulled apart, allowing magma to percolate up from below. As that magma hardened, it recorded snapshots of Earth’s magnetic field, storing information about Baltica’s position in the process.

The results of studying these samples revealed a much more complex picture of the ancient rocks than the scientists initially envisioned. The rocks contained a messy mix of at least six magnetic signals. Several appeared to have formed when more modern geological processes altered the original rocks. Three distinct signals may have survived from the Ediacaran period, two of which diverge from the most plausible Ediacaran signal, which places Baltica near the equator. These conflicting signals further support the idea that Earth’s magnetic field was behaving strangely at the time, adding new complexity to an already puzzling picture.

On the basis of the new results, the researchers place the Egersund paleomagnetic pole at 20.8°N, 89.0°E during the Ediacaran—which diverges from previous results—and suggest that Baltica was located near the equator, adjacent to the ancient continent Laurentia, but rotated slightly clockwise relative to previous reconstructions. The study demonstrates the convoluted nature of the magnetic signals preserved in ancient rocks and the importance of dissecting those records into their constituent components. Doing so, the researchers suggest, can shed new light on the enigmatic behavior of Earth’s magnetic field during the Ediacaran. (Geochemistry, Geophysics, Geosystems, https://doi.org/10.1029/2025GC012730, 2026)

—Saima May Sidik (@saimamay.bsky.social), Science Writer

A photo of a telescope array appears in a circle over a field of blue along with the Eos logo and the following text: Support Eos’s mission to broadly share science news and research. Below the text is a darker blue button that reads “donate today.”
Citation: Sidik, S. M. (2026), Where was Baltica 616 million years ago?, Eos, 107, https://doi.org/10.1029/2026EO260124. Published on 5 2026.
Text © 2026. AGU. CC BY-NC-ND 3.0
Except where otherwise noted, images are subject to copyright. Any reuse without express permission from the copyright owner is prohibited.
  •  

Let’s Not Forget About Long Droughts

Map of the study region with a graph.
Editors’ Highlights are summaries of recent papers by AGU’s journal editors.
Source: Water Resources Research

In the March 2026 issue of Water Resources Research, Zhang et al. [2026] interrogate conceptual hydrologic models’ ability to capture prolonged drought dynamics. The Australian Millennium drought serves as an example in the study. The results are quite sobering because the vast majority of more than 40 models fail. Unfortunately, calibration doesn’t generally help either and might result in massive overfitting. In essence, conceptual models miss deep aquifer storage components and associated hydrodynamic processes leading to a lack of time scales important in drought modeling. The study is a constructive reminder that model parsimony is not necessarily a good thing and that detailed representation of complex physical processes is part of hydrologic sciences.

Citation: Zhang, Z., Fowler, K., & Peel, M. (2026). Can conceptual rainfall-runoff models capture multi-annual storage dynamics? Water Resources Research, 62, e2025WR042226. https://doi.org/10.1029/2025WR042226

—Stefan Kollet, Editor, Water Resources Research

Text © 2026. The authors. CC BY-NC-ND 3.0
Except where otherwise noted, images are subject to copyright. Any reuse without express permission from the copyright owner is prohibited.
  •  

Announcing the Inaugural AGU Advances Early Career Editorial Fellows

Photo of aurora over a body of water with mountains in the background.
Editors’ Vox is a blog from AGU’s Publications Department.

AGU Advances is excited to announce the journal’s inaugural Early Career Editorial Board! The editors of AGU Advances have selected three early career researchers to join the Early Career Editorial Fellow program:

Huilin Huang

University of Virginia

Yihe Huang

University of Michigan

Danielle Monteverde Potocek

Spark Climate Solutions

They will serve as Associate Editors from January 2026 to December 2027, under the leadership of the mentoring editors: David Schimel (Jet Propulsion Laboratory), Thorsten Becker (The University of Texas at Austin, Jackson School of Geoscience), and Eric Davidson (University of Maryland Center for Environmental Science), respectively. AGU Advances is excited to join AGU journals GeoHealth and JGR: Biogeosciences (Xenopoulos, M. A., and T. H. Nguyen, 2024) in launching an Early Career Editorial Fellow program and grateful to our exceptional Early Career Fellows for volunteering their time in service of scientific publishing. This mentorship program, designed to offer a hands-on approach for researchers interested in editorial roles, will support the next generation of researchers and journal editors and lead to stronger futures for our journals and scientific community.

The Early Career Fellows will work one-on-one with a current AGU Advances Editor.

The Early Career Fellows will work one-on-one with a current AGU Advances Editor to learn about the steps of the editorial process, the ethics of reviewing, and what goes into making a decision on a manuscript. They will also learn about the more challenging elements of the editorial process, such as securing reviewers, addressing conflicting reviews, addressing author and/or reviewer concerns.

As the scientific world, and the world at large, change and shift, so too does the world of academic publishing and the needs of future researchers. By working with these Early Career Fellows, we will gain invaluable insight on how to keep our publications at the forefront for the Earth and space sciences.

Below, we asked the Early Career Fellows about their research interests and what they are excited about as they step into this new role (responses edited for length and clarity):

What is your current role and area of research?

Danie: “My areas of research include: biogeochemistry, geobiology, climate science, and global environmental change. “

Huilin: “My area of research is land-atmosphere interaction especially biosphere-atmosphere interaction and climate modeling.”

Yihe: “My group studies the physical mechanisms of earthquakes and faulting processes using both observational methods (e.g., seismic data analysis) and numerical tools (e.g., earthquake rupture simulation). We’re particularly interested in how fluid, fault zone structure, and fault geometry can affect the nucleation, propagation and arrest of earthquakes and how earthquakes contribute to the strain budget and structural evolution of fault zones and plate boundaries. We also have a broad interest in developing physical tools for seismic hazard mitigation and bridging earthquake science and engineering applications.”

Do you have prior experience as a journal editor?

Danie: “This is my first experience in an editorial role.”

Huilin: “I am currently working as the associate editor of Geophysical Research Letters.”

Yihe: “Yes, I’ve been an Associate Editor for JGR: Solid Earth since 2020, and I’ve been an editor for Earth, Planets and Space since last year.”

What interested you in joining the AGU Advances editorial board?

Danie: “I was eager to learn more about the publishing process from the editorial perspective, engage with fellow editors, and contribute to supporting the scientific community. I was also particularly drawn to the structure of the Early Career Board, which offers the opportunity to be mentored by a senior editor and develop editorial expertise before handling manuscripts independently. “

Huilin: “I am drawn to AGU Advances because it prioritizes high-impact studies that fundamentally shift our understanding.”

Yihe: “I’m interested in getting a broader perspective about how an editorial board works, especially for a cross-disciplinary high-impact journal like AGU Advances.”

What would you like to see next from AGU Advances or the AGU journals as a whole?

Danie: “AGU Advances already has a strong focus and track record of publishing research with global relevance and impact. I am excited to support this mission and would also like to see continued expansion of the author base to include more diverse geographies (particularly Asia and Global South) as well as a broader range of career stages.

I would also welcome AGU journals to continue their outreach and engagement with the community that balances traditional hypothesis-driven research with action-oriented perspectives addressing urgent scientific and societal challenges especially considering the rapidly shifting landscape of scientific research.”

Huilin: “I am particularly interested in seeing the conversation toward the use of new technolog[ies] (like AI/ML or new satellite, new models) to advanc[ing] process-level understanding.”

Yihe: “I would like to see editors’ perspectives on how AGU Advances distinguishes itself from other high-impact journals. I would also like to learn how we can advertise and communicate the advantages of publishing in AGU Advances through different avenues.”


We are so appreciative of our volunteer Editors, David Schimel, Thorsten Becker, and Eric Davidson, who will be mentoring our new Early Career Fellows. Here, we asked them what they are looking forward to most about the program:

What outcomes for AGU Advances do you hope to see from the Early Career Board?

Dave: “ECRs provide a fresh view and are often much closer to the methods and science in papers we receive. An ECR and a Board editor have a great combination, experience, perspective and familiarity up close with the work and the community.”

Eric: “The associate editors become interested in being full editors and are well prepared. At a minimum, they have an experience that makes them better authors and reviewers because of the perspective they’ve gained as associate editors. 

Why did you decide to become a mentoring editor?

Editing scientific papers can be a true joy of learning and discovery.

Thorsten Becker

Thorsten: “We value a diversity of perspectives and background when assessing contributions during initial and formal review, and it will be terrific to benefit from Yihe’s expertise. Editing scientific papers can be a true joy of learning and discovery, and we think this position will be a great pathway to take on a larger role in this community process while having a somewhat reduced workload and being able to participate in an exchange about best practices and a mentoring system that can hopefully facilitate sharing best practices and insights gained from prolonged work in an editorial role.”

Dave: “Oh, man, when I started as a peer reviewer and then a guest editor, followed by being a member of a board, each step was sink or swim!  I am happy to share a few lessons learned but also expect to learn a lot from my ECR’s view from the cutting edge.  I think we’ll have fun learning from each other.”

What advice would you give to early career researchers interested in becoming journal editors?

Seeing publishing from the other side is really important for maturing scientists!

David Schimel

Dave: “Being an editor is an amazing way to broader your knowledge and network, but being an editor is serious work, is a paper going to advance science, or, with appropriate guidance could it advance science?  Does it build on the literature or ignore relevant work?  Accepting/rejecting papers has huge career impact on authors but we have to keep in mind we review papers to advance science, not to play career games, while recognizing publications have become very much about careers with all manner of distorted and perverse incentives. Seeing publishing from the other side is really important for maturing scientists!  Also, you learn that ten extra minutes to explain a decision to an author can change a life!  I’ve learned a HUGE amount from the peer reviewers and editors of my own papers!”

Eric: “Accept invitations to review manuscripts. Let an editor or EiC know of your interest. Make sure you have the time to do this.”

 —Allison Schuette (aschuette@agu.org, 0009-0007-1055-0937), Program Coordinator, AGU Publications; Alberto Montanari (0000-0001-7428-0410), Editor-in-Chief, AGU Advances; Huilin Huang (0000-0002-7328-6738), Early Career Fellow, AGU Advances; Yihe Huang (0000-0001-5270-9378), Early Career Fellow, AGU Advances; Danielle Monteverde Potocek (0000-0002-0198-8220), Early Career Fellow, AGU Advances; Thorsten Becker (0000-0002-5656-4564), Editor, AGU Advances; Eric Davidson (0000-0002-8525-8697), Editor, AGU Advances; David Schimel (0000-0003-3473-8065), Editor, AGU Advances; Kristina Vrouwenvelder (0000-0002-5862-2502), Assistant Director, AGU Publications; and Sarah Dedej (0000-0003-3952-4250), Assistant Director, AGU Publications

Citation: Schuette, A., A. Montanari, H. Huang, Y. Huang, D. Monteverde Potocek, T. Becker, E. Davidson, D. Schimel, K. Vrouwenvelder, and S. Dedej (2026), Announcing the inaugural AGU Advances Early Career Editorial Fellows, Eos, 107, https://doi.org/10.1029/2026EO265018. Published on 5 May 2026.
This article does not represent the opinion of AGU, Eos, or any of its affiliates. It is solely the opinion of the author(s).
Text © 2026. The authors. CC BY-NC-ND 3.0
Except where otherwise noted, images are subject to copyright. Any reuse without express permission from the copyright owner is prohibited.
  •  

Moon Mission Data Reveal Unexpected Cosmic Ray “Shadow”

Solar system diagram showing the Sun’s magnetic field lines and a shaded region representing the bubble of reduced cosmic rays, which sits at roughly a 45° angle extending ahead of and behind Earth as it orbits.

The solar system is bathed in galactic cosmic rays: protons and atomic nuclei traveling, nearly at the speed of light, from all directions. Earth’s magnetic field and atmosphere shield us from most of this harmful radiation, but outside of that shelter, the bombardment is strong enough to prove a threat to astronauts.

But a new analysis of data from the Chang’e-4 lunar lander published in Science Advances revealed an extended cosmic ray shelter stretching from Earth at an unexpected angle at least as far as the Moon, though exactly how far is unclear. When the Moon passes through this shelter in its orbit of Earth, the lunar surface experiences a roughly 20% reduction in the galactic cosmic ray flux.

“We found Earth casts kind of a shadow in the galactic cosmic ray space,” said Robert F. Wimmer-Schweingruber, a space physicist at Kiel University in Germany. “This was unexpected, and to me that was the cool part of this paper.”

The surprise came in part because the shape of Earth’s magnetic field is well understood: It forms a strong protective region around the planet known as the magnetosphere, with a long “tail” shaped by the solar wind of charged particles streaming from the Sun.

If the magnetotail is like a person’s shadow cast behind them by sunshine, this newly discovered bubble would be like if that shadow extended to the front of the person as well.

“You would expect an effect inside the tail or as [the Moon goes] through the tail, but we find an effect of the tail ahead of the tail,” said Wimmer-Schweingruber. He noted that if the magnetotail is like a person’s shadow cast behind them by sunshine, this newly discovered bubble would be like if that shadow extended to the front of the person as well and tilted rather than lying along a line connecting Earth, the Sun, and the Moon.

“The observed region of reduced [galactic cosmic ray] flux on the sunward side of the Moon’s orbit outside the geomagnetic field where it is compressed by the solar wind is unexpected,” Brian Flint Rauch wrote in an email. Rauch, a cosmic ray physicist at Washington University in St. Louis who was not involved in the Chang’e-4 study, added that any reduction in cosmic ray exposure is noteworthy for potential astronauts on the Moon.

A 20% decrease in flux during part of the lunar orbit is unlikely to make a large difference in determining when it’s safest for astronauts go out onto the lunar surface. But it might help guide individual decisions in the moment because while spacesuits won’t protect astronauts from cosmic rays, the metal of a habitat or lander would.

Shelter from the Storm

The China National Space Administration’s Chang’e-4 spacecraft was the first successful mission to the lunar farside, landing in the Von Kármán crater on 3 January 2019. As part of its suite of scientific instruments, the probe carried the Lunar Lander Neutron and Dosimetry experiment (LND) developed by Wimmer-Schweingruber and collaborators at Kiel University in an astonishingly rapid 18 months. This detector was designed in part to gauge conditions for human exploration by measuring the radiation on the Moon’s surface, including cosmic rays.

LND collected data between January 2019 and January 2022. Though Apollo astronauts carried radiation dosimeters, those instruments did not provide detailed information about fluctuations in exposure, making LND the primary source for such information from the lunar surface. For that reason, it provided the best data on galactic cosmic rays, which consist mostly of protons accelerated to nearly the speed of light in the remnants of supernovas.

Measurements show the ambient radiation dose on the lunar surface is more than twice as high as on the ISS and nearly 200 times as high as on Earth.

These protons arrive in the solar system from every direction, often undeflected by the magnetic fields of stars or planets. However, Earth’s magnetosphere is strong enough to repel many galactic cosmic rays in low orbit, where the International Space Station (ISS) resides. Meanwhile, measurements show the ambient radiation dose on the lunar surface is more than twice as high as on the ISS and nearly 200 times as high as on Earth, which is a matter of concern for long-term human presence on the Moon.

All of these reasons are why everyone was surprised when LND data revealed Earth’s magnetic protection extends far beyond the magnetosphere and at an angle to the line connecting Earth and the Sun. Lead author Wensai Shang of Shandong University in Weihai, China, worked out that the angle corresponds to the twisting of the Sun’s magnetic field.

“As the Sun rotates, it pulls the solar wind along the solar magnetic field,” Wimmer-Schweingruber said. “That produces a spiral.” Apparently, an unanticipated interaction between this twist in the solar magnetic field and Earth’s magnetic field produces the cosmic ray shelter revealed by LND.

Wimmer-Schweingruber noted that he was extremely skeptical that such results were possible at first. He warned Shang, a graduate student he worked with, that he might be wasting his time looking for cosmic ray anomalies in the Chang’e-4 data. It was only after Shang provided ironclad analyses ruling out other possibilities that he was swayed.

With the LND instrument shut off, researchers need other sources of data to continue the work. Wimmer-Schweingruber expressed particular interest in understanding how cosmic rays produce secondary radiation—especially neutrons, which are very dangerous to humans—when they impact the lunar soil. In the meantime, the general understanding of the radiation environment provided by Chang’e-4 shows we still have some surprises in store as humans explore the solar system.

—Matthew R. Francis (@BowlerHatScience.org), Science Writer

Citation: Francis, M. R. (2026), Moon mission data reveal unexpected cosmic ray “shadow,” Eos, 107, https://doi.org/10.1029/2026EO260137. Published on 4 May 2026.
Text © 2026. The authors. CC BY-NC-ND 3.0
Except where otherwise noted, images are subject to copyright. Any reuse without express permission from the copyright owner is prohibited.
  •  

Want to Predict Wildfire Severity? Look to the State of Vegetation

Large plumes of smoke rise from a hillside. Two vehicles on a roadside are dwarfed by the smoke cloud.
Source: AGU Advances

Urbanization, climate change, and fire suppression practices are contributing to increased wildfire risk at the densely populated wildland-urban interface. These factors make fires more unpredictable and harder to manage. In January 2025, this was made devastatingly clear in Los Angeles, when massive wildfires engulfed entire hillsides and canyons, destroying neighborhoods and damaging surrounding ecosystems.

The Mediterranean climate region of California, which stretches up most of the state’s coastline, is a naturally fire-prone landscape because its dry conditions support vegetation growth and also allow for fire to spread easily. As wildfires become more intense, better modeling and understanding of their drivers is crucial in efforts to predict risk.

Ward-Baranyay et al. looked at three of the January 2025 Los Angeles wildfires by analyzing preburn conditions, such as fuel characteristics, topography (including elevation and slope), and wind speed. Satellite observations gathered from the Ecosystem Spaceborne Thermal Radiometer Experiment on Space Station (ECOSTRESS) and the Earth Surface Mineral Dust Source Investigation (EMIT)—precursors to a recently announced NASA mission, the Explorer for Artemis Geology Lunar and Earth (EAGLE)—provided detailed information about the vegetation’s condition before the fires began. The researchers then built a random forest regression model to predict burn severity based on these conditions, ultimately demonstrating that prefire fuel conditions were a key driver of the destructive wildfires’ immediate effects on wildlands.

The model used in the study was able to accurately capture about 60% of the patterns in burn severity. It was most accurate for the Palisades and Hughes fires, but less accurate for the Eaton Fire. This discrepancy could be because the area burned by the Eaton Fire was more topographically variable, meaning its burn severity drivers may not have been fully captured by the model, the researchers suggest. Vegetation type was also a strong performance indicator: Terrain with shrub or scrub cover, the dominant vegetation type, offered the most accurate predictions for burn severity. The burn patterns of forests and other landscape types were less accurately captured.

Fuel conditions emerged as the dominant driver of burn severity, more so than topography or weather. In particular, how abundant, wet, dry, or stressed vegetation is can hint at how severe future fires may be. Tracking and monitoring these fuel conditions, researchers suggest, may be a way to monitor wildfire hazard in California and other fire-prone regions. (AGU Advances, https://doi.org/10.1029/2025AV002179, 2026)

—Rebecca Owen (@beccapox.bsky.social), Science Writer

A photo of a telescope array appears in a circle over a field of blue along with the Eos logo and the following text: Support Eos’s mission to broadly share science news and research. Below the text is a darker blue button that reads “donate today.”
Citation: Owen, R. (2026), Want to predict wildfire severity? Look to the state of vegetation, Eos, 107, https://doi.org/10.1029/2026EO260130. Published on 4 May 2026.
Text © 2026. AGU. CC BY-NC-ND 3.0
Except where otherwise noted, images are subject to copyright. Any reuse without express permission from the copyright owner is prohibited.
  •  
❌