Wealth and land-cover change govern landslide fatalities on world’s mountains
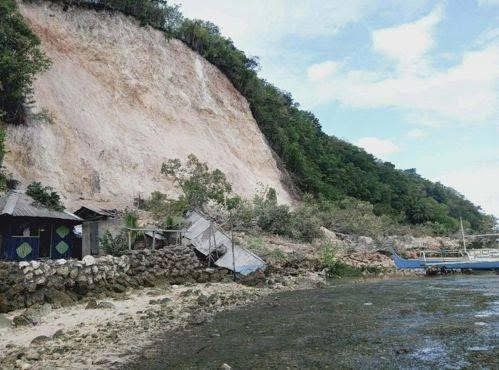
A new paper Fidan et al. (2026) demonstrates that wealth and the rate of land-cover change play a key role in determining the occurrence of fatal landslides in mountain areas. These factors are statistically more significant that precipitation and topography.
A fascinating new paper (Fidan et al. 2026 – this paper is both open access and published under a Creative Commons licence – hurrah!) has just been published in the journal Science Advances that explores rates of land-cover (in the paper, the authors use the term land-use – land-cover) change as a factor in determining fatal landslides in mountains globally. I must admit to some degree of personal interest in this paper, although I am neither an autor nor a reviewer, as it brilliantly uses the dataset that Melanie Froude and I collated on global landslide fatalities (see Froude and Petley 2018). I’m delighted to see our data being used in this way (and please do contact me if you want a copy of the spreadsheet).
Fidan et al. (2026) explores a range of factors that might influence the occurrence of fatal landslides from the perspective of either increased vulnerability (poorer people may live in more vulnerable locations for example) or increased landslide likelihood (land-cover change might increase the likelihood of a landslide being triggered, for example).
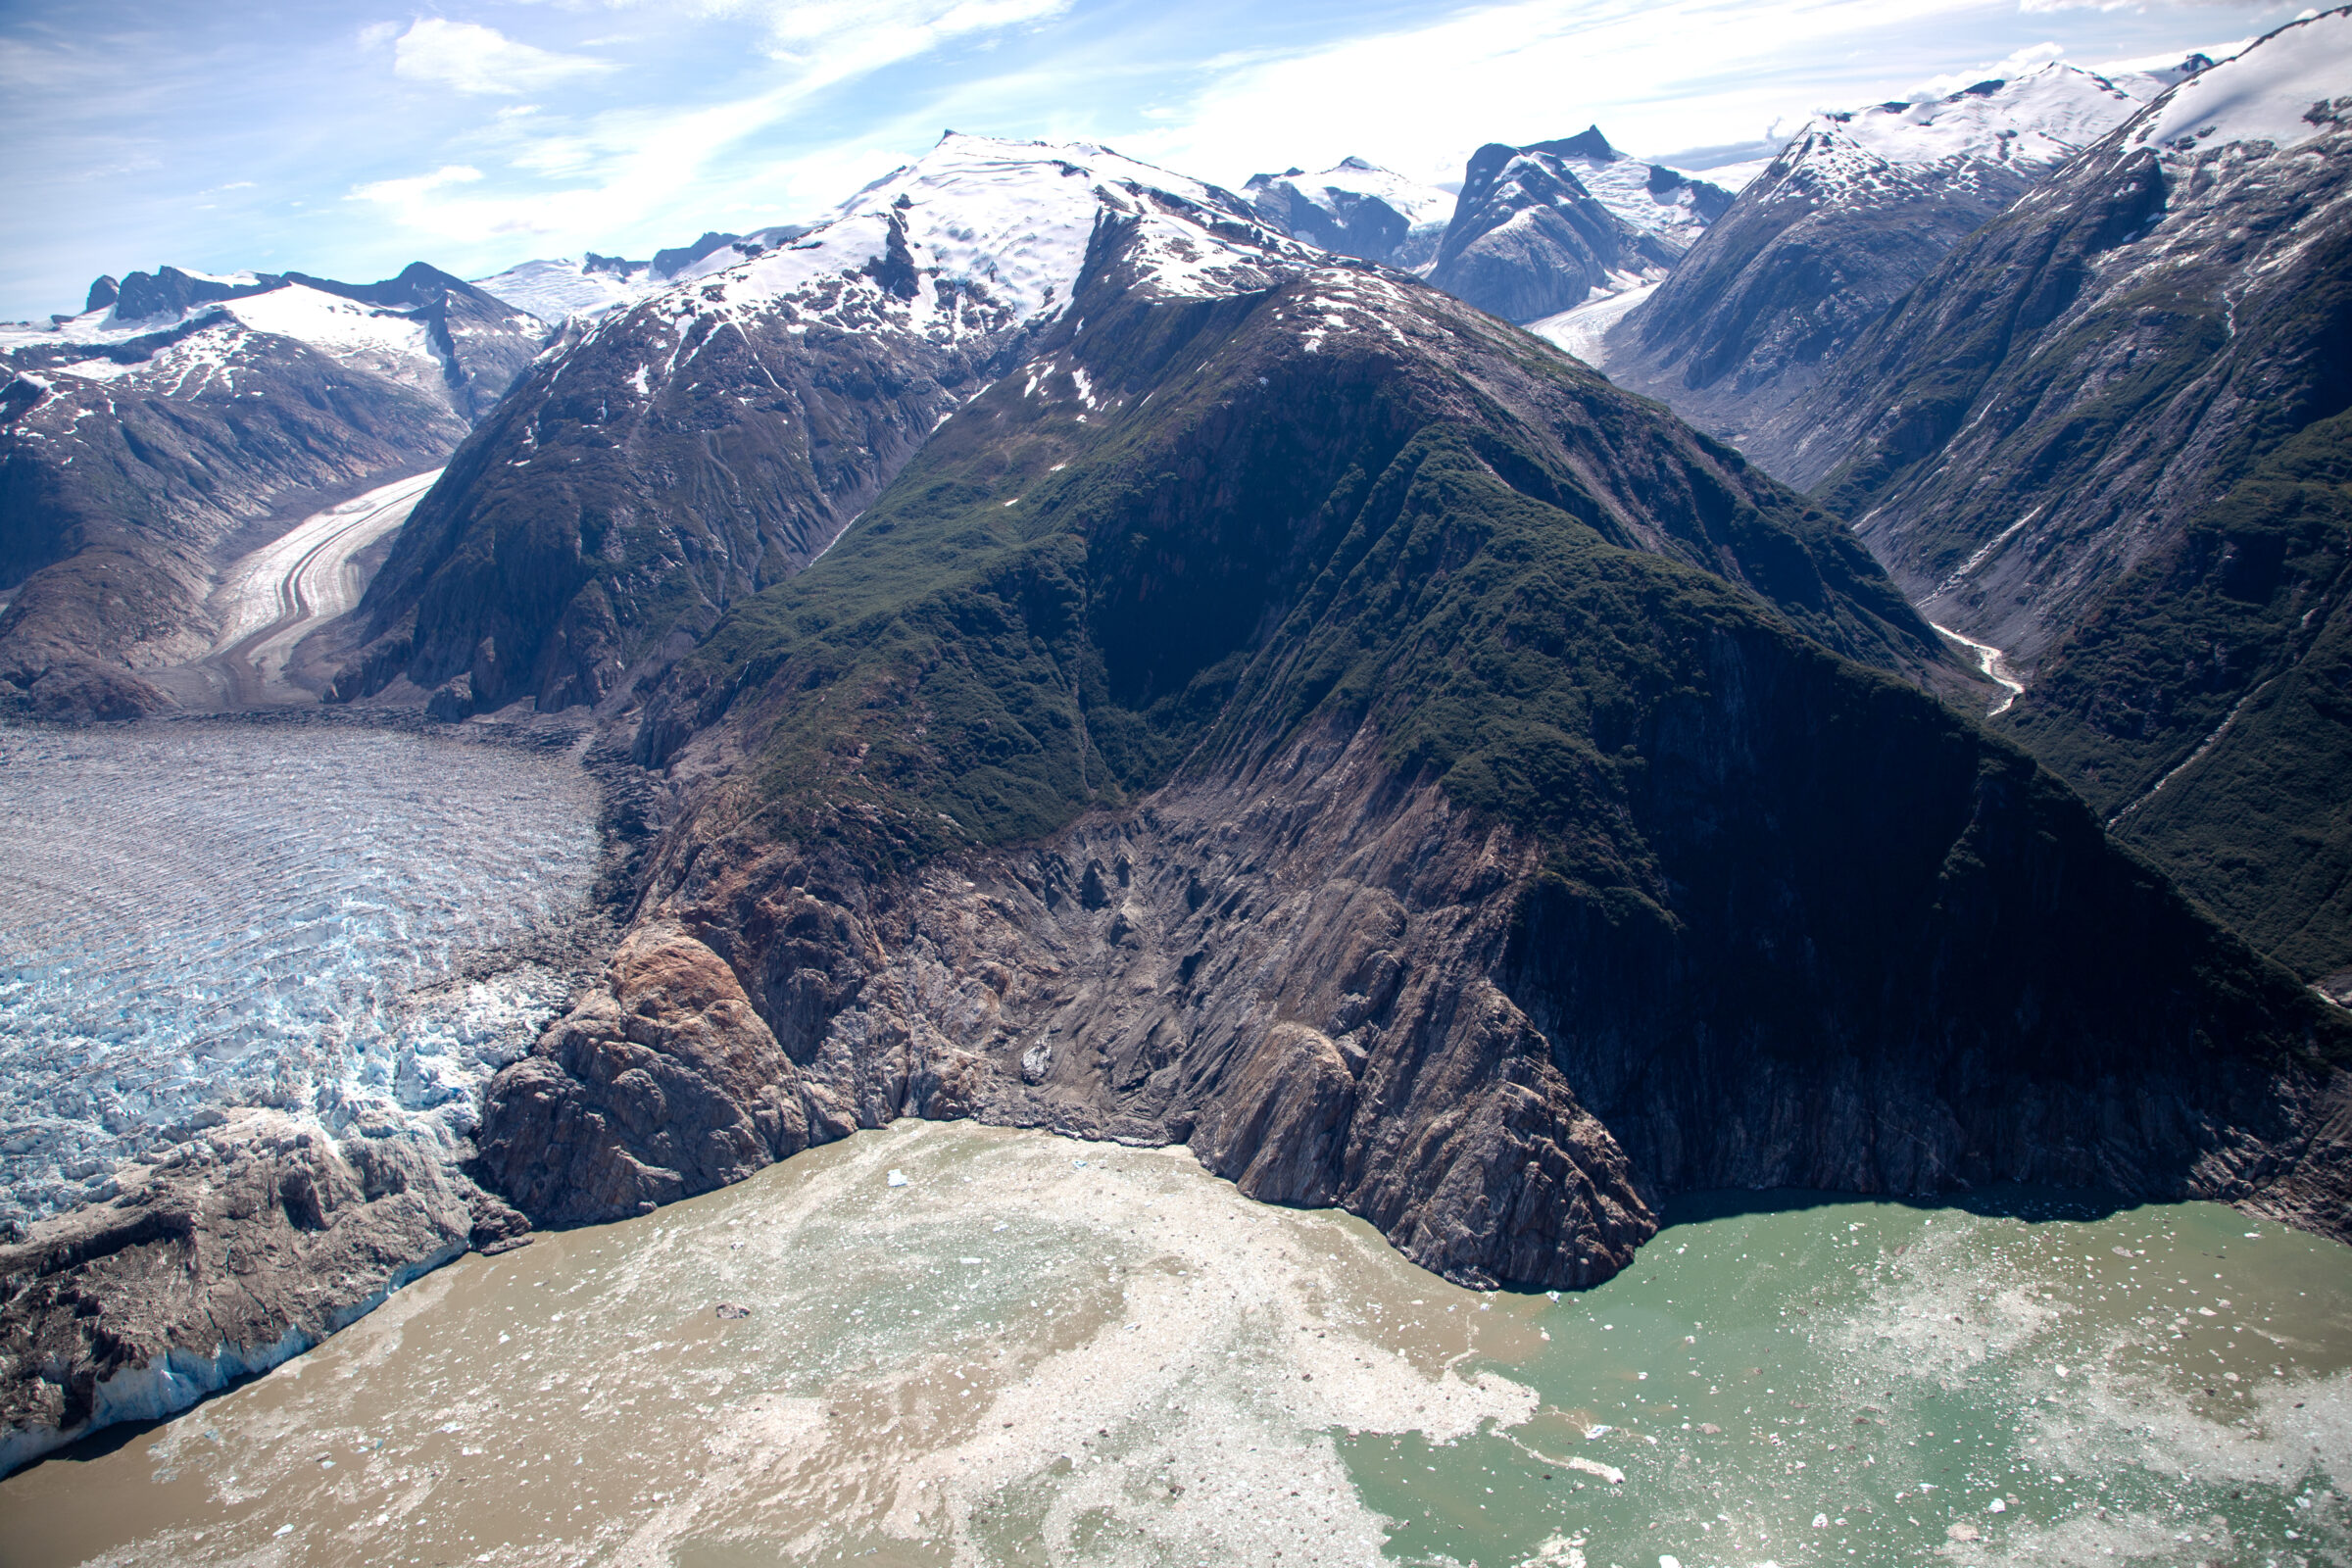
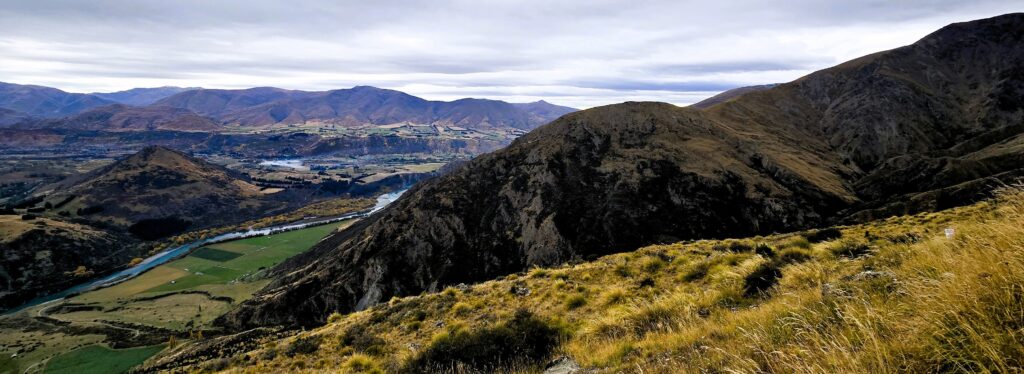
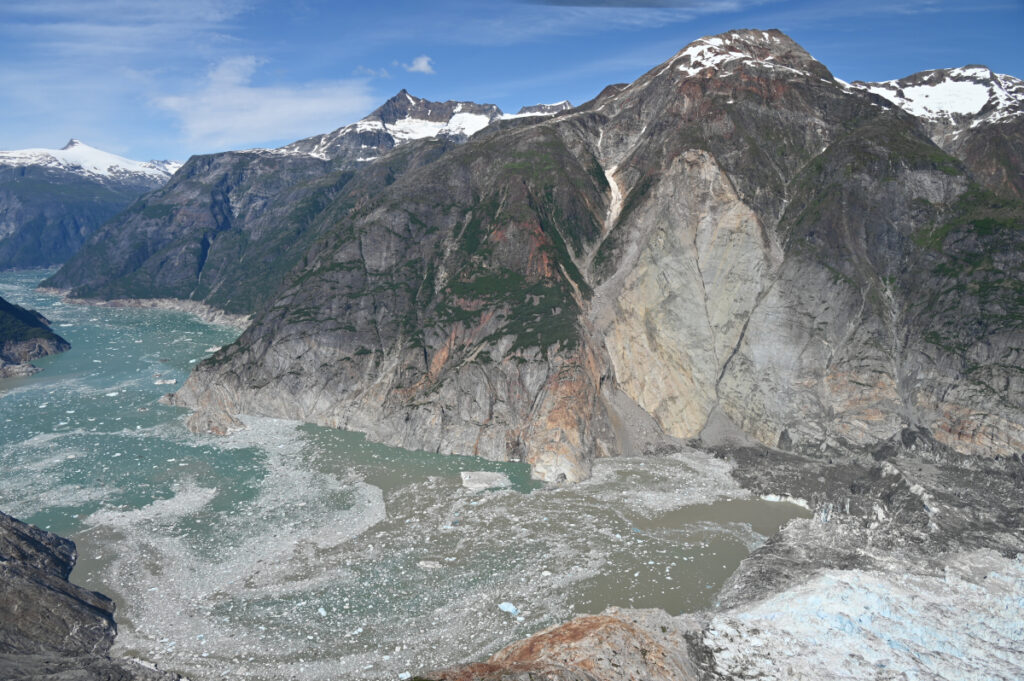
The fascinating result lies in land-cover change. The authors have looked at approximately 60 years of land-cover changes in mountainous areas across 46 countries. Unsurprisingly, there is substantial change, especially in low- and lower-middle–income countries, often involving the loss of forest (which as a first order estimation, may buffer against slope failures), although the pattern is far more complex of course. Fidan et al. (2026) find that a key metric is the rate of change of land-cover, and that this is linked to the rate of population growth (perhaps unsurprisingly). Countries with high rates of population growth also show high rates of change of land-cover.
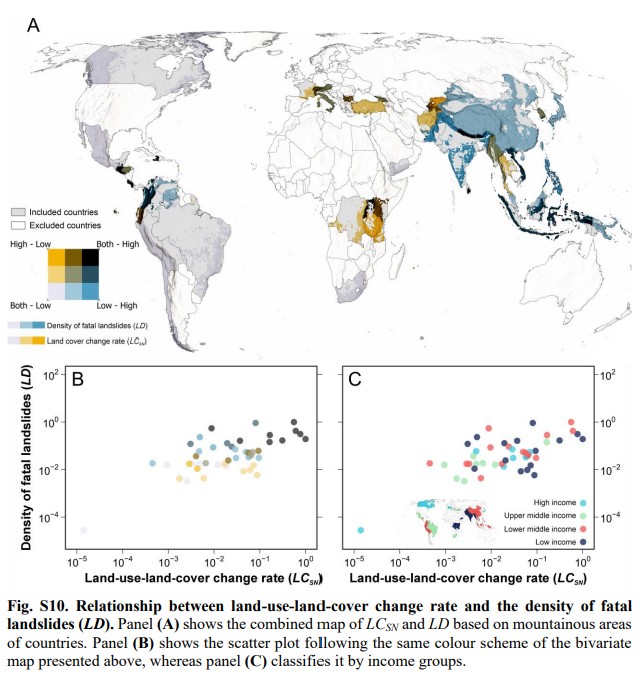
In many ways, the most interesting figure in this study is in the Supplementary Information. It is a complex diagram, but it’s worth more detailed analysis:-
The main map (A) shows mountain areas with high rates of land-cover change (orange), high density of fatal landslides (blue) or both (black). The left hand graph (B) shows the relationship between the landslide density and the rate of change of land-cover – here, higher rates of land-cover change are associated with a higher density of fatal landslides. The right hand graph is the same data as in (B), but with each point coloured according to the income level of the country. High income countries have a lower fatal landslide density. Thus, as the authors conclude, wealth and land-cover change appear to control fatal landslide density.
There is a really surprising element to this study, which I think requires more consideration. I think I should allow the authors themselves to express this finding, from the abstract:-
“Our statistical analyses show that land-use – land-cover changes have a substantially greater influence on the density of fatal landslides and landslide fatalities than physical factors such as topography and precipitation, especially in lower-income countries.”
As landslide researchers, we almost always default to topography and precipitation as being key in landslide occurrence. There are sound reasons for doing so. But statistically, the rate of land-cover change plays a more important role in mountain areas, especially in poorer countries.
This has (or should have) major implications for the way that we consider and manage landslide risk in such areas.
References
Fidan, S. et al. 2026. Wealth and land-cover change govern landslide fatalities on world’s mountains. Science Advances 12, eaec2739. DOI: 10.1126/sciadv.aec2739.
Froude M.J. and Petley D.N. 2018. Global fatal landslide occurrence from 2004 to 2016. Natural Hazards and Earth System Science 18, 2161-2181. DOI: 10.5194/nhess-18-2161-2018.