Chevrolet Pick Up C-20, 1967-1972
5 June 2026 at 14:06
vdgoltz posted a photo:
![]()
Auf einem Oldtimertreffen fotografiert
photographed on a vintage car meeting
![]()

vdgoltz posted a photo:
![]()
Auf einem Oldtimertreffen fotografiert
photographed on a vintage car meeting
![]()
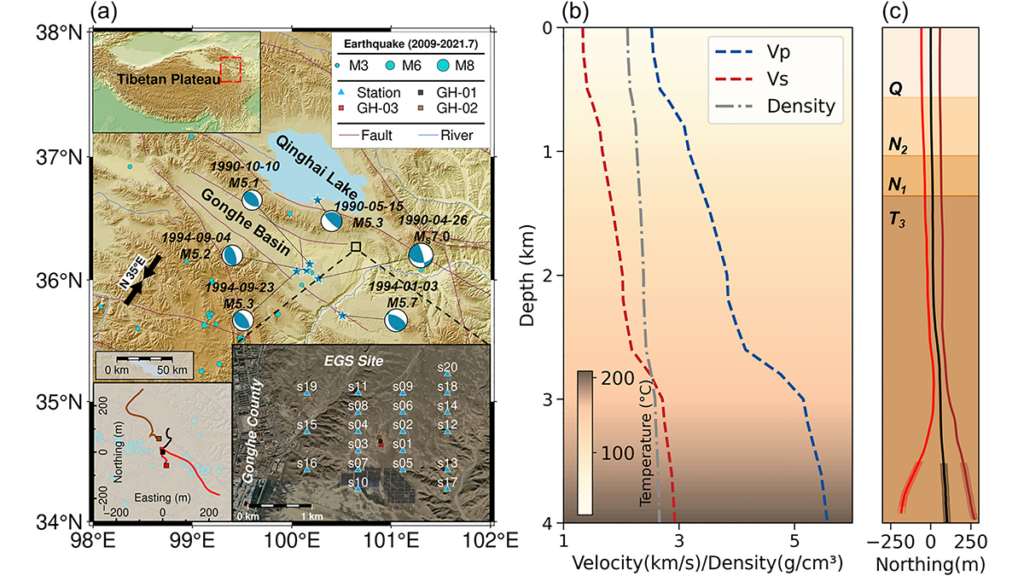
Enhanced Geothermal Systems (EGS) can expand low-carbon energy production, but fluid injection may trigger earthquakes whose locations and mechanisms are difficult to predict. Feng et al. [2026] investigate induced seismicity at China’s first EGS site in the Gonghe Basin using a comprehensive observational dataset. Machine learning processing of data from 20 surface seismic stations produced a high-resolution earthquake catalog with well-constrained locations and focal mechanisms. Stress inversion and modeling, constrained by borehole stress measurements, reveal mechanically weak faults with low friction coefficients, indicating that low-to-moderate fluid overpressure can trigger seismic slip. Site-scale analysis shows that seismicity reflects shear reactivation of pre-existing natural faults, rather than the creation of new tensile fractures. Further integration with borehole image logs reveals a fine-scale relationship between the main seismogenic zones and stress heterogeneity, expressed as rotations of the principal stress axes that likely reflect localized lithological contrasts and fault-damage zones.
Together, these integrated analyses show that geothermal-induced seismicity is controlled by inherited fault architecture at the site scale and localized stress heterogeneity at the borehole scale. By linking seismic observations to borehole stress and image-log evidence, the study provides a more physically constrained framework for seismic-hazard assessment and stimulation design in enhanced geothermal reservoirs.
Citation: Feng, P., Wang, R., Zhang, H., Zhang, C., Schultz, R., & Yang, L. (2026). Pre-existing structures and stress variations jointly control the induced seismicity in enhanced geothermal system of Gonghe Basin, China. Journal of Geophysical Research: Solid Earth, 131, e2025JB033158. https://doi.org/10.1029/2025JB033158
—Xiaowei Chen, Associate Editor, JGR: Solid Earth

Most auroras appear in the “auroral oval” at high latitudes surrounding the magnetic poles. However, some can appear as a detached auroral arc from the auroral oval, at lower latitudes in mid-afternoon and connected to the oval only at a tip or two. Such a detached arc is believed to be linked to the “plasmaspheric plume,” the tongue-shaped extension of the plasmasphere during the recovery phase of a geomagnetic storm. (The plasmasphere is the torus-shaped region of cold, dense plasma above the low- and mid-latitude ionosphere.) The surface waves at the plume boundary cause it to ripple and modulate the various plasma waves in the plume.
Based on observations from multiple satellites and ground stations, Feng et al. [2026] find sawtooth-like undulations along the equatorward boundary of a detached auroral arc in the ultraviolet that was produced by energetic (>keV) electrons and accompanied by energetic (>10 keV) ions. The authors attribute the undulations to Electromagnetic Ion Cyclotron (EMIC) waves that are modulated by the surface waves and resonating with the energetic ions. The study unravels the fine-scale structures of detached auroral arcs and sheds important light on the dynamics underlying their formation.
Citation: Feng, H., Wang, D., Hao, Y., Miyoshi, Y., Fu, H., Jun, C.-W., et al. (2026). First observation of sawtooth-like undulations in afternoon detached auroral arcs modulated by surface waves at the plasmaspheric plume boundary. AGU Advances, 7, e2025AV002234. https://doi.org/10.1029/2025AV002234
—Andrew Yau, Editor, AGU Advances

Evapotranspiration is a critical link between water, energy, and carbon. Scientists need to understand it well to accurately predict weather, droughts, streamflows, and even carbon emissions.
Eddy covariance towers, which measure changes in the atmosphere, are one of the primary ways that scientists measure evapotranspiration in an ecosystem. But these measurements often have a problem with energy imbalance, in which the measured fluxes of sensible heat and latent heat add up to less than they should. (Sensible heat refers to measurable temperature changes occurring via conduction or convection, whereas latent heat refers to water in the atmosphere changing phases.) There’s something missing—up to 30% of the system’s energy—in the math, and that can cause problems for later uses of the measurements, from forecasts to climate policies.
Scientists can adjust evapotranspiration measurements to try to correct for this problem, but a commonly used method to do so assumes that the Bowen ratio, or the ratio between sensible and latent heat, remains constant. However, this assumption may be flawed.
Raghav and Kumar present a new way of tackling this old problem without making assumptions about the Bowen ratio. It’s based on water use efficiency, which is how effectively plants use water to produce biomass.
The method first uses a suite of data from an eddy covariance tower to estimate evapotranspiration and energy balance through time. Then it derives the underlying water use efficiency potential while accounting for the influence of atmospheric dryness. In general, for a given vegetation type, this potential underlying efficiency is considered to be relatively stable over a growing season. The statistically smoothed potential underlying water use efficiencies is then compared to reference values derived during periods when the energy balance is well constrained. The ratio of the two is then used to correct evapotranspiration.
The new method is more consistent and more tied to the physics of plant physiology than current methods when results from each are compared, the authors found.
The new method is appropriate for use with any eddy covariance tower location or dataset because the authors used data from more than 250 towers around the world, in a range of ecosystem and climate types, to build their approach. However, they add, it may be less reliable in environments where evaporation dominates transpiration, such as wetlands. Nevertheless, the authors say, this work marks an important advance in measuring evapotranspiration, with broad implications for water management, agriculture, and adapting to climate extremes and drought. (Water Resources Research, https://doi.org/10.1029/2025WR042766, 2026)
—Rebecca Dzombak (@rdzombak.bsky.social), Science Writer

The space industry is surging. In coming years, nearly 10,000 spacecraft are slated to launch into low-Earth orbit for a variety of purposes, such as global surveillance, space tourism, and satellite “megaconstellations” providing internet service.
Rocket engine exhaust, as well as the burnup of inactive satellites and rocket parts reentering Earth’s atmosphere, releases a suite of pollutants. These chemicals have long been considered to pose little threat to our climate, given the historically small size of the space industry. Now, the sector’s rapid growth will send its emissions skyrocketing—but scientists don’t yet have a clear picture of the environmental ramifications.
An analysis by Vliex et al. of rockets launched in 2022 revealed that spaceflight depletes the ozone layer and contributes to global warming, with a significant portion of this ozone loss attributable to nitrogen oxide emissions released by objects reentering Earth’s atmosphere.
The researchers calculated emissions from all 186 rockets launched in 2022, as well as all 472 objects—with a combined total mass of nearly 5,000 tons—that reentered the atmosphere that year. They conducted computational simulations of each launch’s trajectory and emissions at various altitudes up to 100 kilometers, and they calculated emissions released by object reentry. They also accounted for the effects of chemical reactions that occur in rocket exhaust plumes, which alter emissions’ chemical composition.
Incorporation of the calculated emissions into GEOS-Chem, a computational model of atmospheric chemistry, revealed their ozone-depleting and Earth-warming effects, with reentry emissions identified as playing a key role in ozone depletion. The researchers found that accounting for plume reactions reduced the estimated effects of spaceflight emissions, highlighting the value of considering plume chemistry in future assessments.
The analysis also underscored the varying effects of different rocket fuel types. Solid-state fuels, used recently in rocket boosters for NASA’s Artemis II mission to return astronauts to the Moon, appeared to cause the greatest amount of ozone depletion relative to propellant mass, while rocket-grade kerosene caused the greatest amount of warming.
On the basis of their findings, the researchers call for further research into reentry emissions and rocket plume chemistry as the space industry continues to expand and evolve. (Earth’s Future, https://doi.org/10.1029/2025EF007795, 2026)
—Sarah Stanley, Science Writer

Manuel Gual posted a photo:
![]()
Echoes of the 1940s Circus: Steam Trains, Big Top Lights and Forgotten Wonders
Description
A cinematic journey through a fictional vintage circus world inspired by the atmosphere of the 1940s: steam trains arriving through clouds of smoke, crowded railway platforms, canvas tents rising at dawn, performers preparing behind the scenes, glowing fairground lights, brass bands, trapeze artists, ringmasters, clowns, fortune tellers, animal acts, travelling caravans and the quiet moments hidden between spectacle and exhaustion.
This collection evokes the golden age of travelling circuses as if seen through the lens of an old documentary photographer, but with the visual richness of modern cinematic photography. Warm amber lights, deep shadows, smoky interiors, velvet costumes, weathered wood, worn posters, dusty roads and dramatic faces create a world suspended between memory, theatre and dream. Each image suggests a fragment of a larger story: the arrival of the circus by train, the construction of the tent, the anticipation of the crowd, the tension before the performance, the intimacy of backstage rituals and the melancholy beauty of a show that exists only for one night before disappearing again.
The series blends realism and fantasy, presenting the circus not only as entertainment but as a temporary city of artists, workers, animals, music, mystery and human emotion. It captures both the grand spectacle and the fragile backstage humanity of a travelling world built from canvas, light, discipline and illusion.
All images have been generated by Artificial Intelligence.
![]()
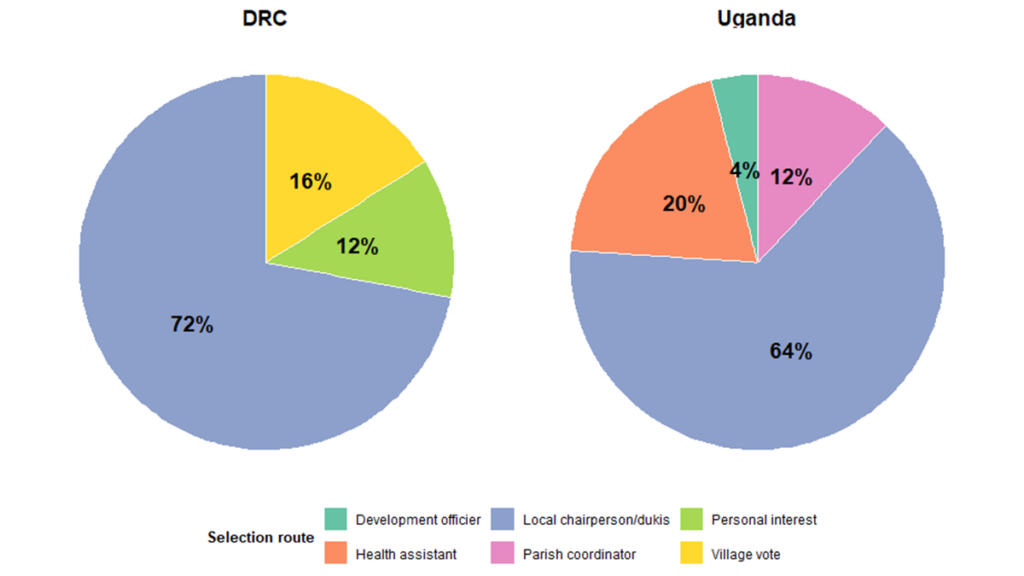
Citizen science continues to spread across the world. It is becoming an acceptable and reliable practice to monitor and report on local conditions. Yet, it must adapt to local conditions and constraints – such as the profile of participants, their level of education, or the time that is available for them. So, how does citizen science adapt to Low- and Middle-Income Countries (LMIC)?
In Ashepet et al. [2026], we learn from the ATRAP (Action Towards Reducing snail-borne Parasitic diseases) project, which focuses on the monitoring of snail-borne disease in Uganda and the Democratic Republic of Congo (DRC). The researchers show how citizen science requires consideration such as material and social benefits for the participants, and how social structure and practices need to be taken into account. The paper also challenges the universality of the European Citizen Science Association (ECSA) 10 principles of citizen science.
Citation: Ashepet, M. G., Mulmi, J., Michellier, C., Jacobs, L., Pype, K., & Huyse, T. (2026). Citizen science principles in practice: Lessons from Uganda and the democratic Republic of Congo. Community Science, 5, e2025CSJ000149. https://doi.org/10.1029/2025CSJ000149
—Muki Haklay, Editor, Community Science
Instantly delighted by the premise and format of Genderswap.fm, a classy little database made by Eva Decker that catalogues covers and original tracks sung by artists of different genders. (Particularly love getting to filter by tags like “more danceable” or “less acoustic”.)

This is an authorized translation of an Eos article. 本文是Eos文章的授权翻译。
据世界卫生组织的数据,全球每年因空气污染导致的死亡人数估计达 700 万。其中大部分死亡病例是由PM2.5引起的,这种直径小于 2.5 微米的颗粒物能够进入肺部和血液,从而引发呼吸系统和心血管系统疾病。除了直接排放到大气中的颗粒物外,工厂、船只、汽车和发电厂排放的氨(NH3)、氮氧化物(NOX)和二氧化硫(SO2)等物质也是导致 PM2.5 形成的前体物。然而,颗粒物污染的影响并非均匀分布。
Oztaner等人对北半球各区域的空气污染后果进行了建模,从而更细致地分析了哪些地区的减排政策最为有效。他们利用美国环保署(EPA)社区多尺度空气质量(CMAQ)建模平台的多相伴随模型(multiphase adjoint model),从挽救生命和节省资金两个角度评估了减少各种污染物带来的效益。该研究通过国际机构所广泛采用的一种成熟方法,计算出了空气污染影响所造成的经济损失。不过,这种方法也引发了一些伦理方面的担忧,因为它在评估生命价值时部分地依据了各国的人均国内生产总值(GDP)。
总体而言,研究发现,如果所有模型中的排放量减少 10%,那么在北半球每年将能挽救 513,700 人的生命,并节省 1.2 万亿美元的费用。
死亡率降幅最大的是中国和印度,削减排放量每年将分别挽救184,000人和124,000人的生命。成本节约幅度最大的也是中国,其次是欧洲和北美。健康效益也因排放类型和行业而异。氨(NH3)在中国造成的危害更大,而氮氧化物(NOx)在欧洲的危害相对高于其他地区。在整个北半球,农业部门是颗粒物和前体物污染的主要来源,预计农业相关排放量减少10%可挽救95,000人的生命,并节省约2900亿美元。其次是居民区和工业区。
作者指出,在对类似研究的结果进行比较时应保持谨慎,一部分原因是污染物浓度与健康结果之间的关联并非总是呈线性关系,还有一部分原因是不同地区在核算各行业排放量时可能采用不同的方法。此外,他们的研究仅关注与 PM2.5 相关的死亡率,未考虑如臭氧等其他污染物。总体而言,他们认为他们的研究为比较北半球不同污染物减排策略的效果提供了一个有意义的参考。(GeoHealth, https://doi.org/10.1029/2025GH001533, 2026)
—科学撰稿人Nathaniel Scharping (@nathanielscharp)
This translation was made by Wiley. 本文翻译由Wiley提供。
Read this article on WeChat. 在微信上阅读本文。

![]()

Greenhouse gas emissions are heating our atmosphere and oceans, and turning seawater more acidic. One of the myriad expected impacts of these conditions is a reduction in farming yields of shellfish, such as oysters and mussels. Coastal communities worldwide rely on these organisms for their economies and as a major food supply. However, exactly how climate change will affect oyster and mussel farming is not yet clear.
Using a novel experimental setup, Pernet et al. report new projected yields of oyster and mussel farming in the Mediterranean Sea for the years 2050, 2075, and 2100. Their results suggest that by 2050, yields of both shellfish will drop dramatically, with mussel production perhaps collapsing altogether.
Most prior studies have assessed shellfish in tank experiments under fairly idealized conditions that do not adequately reflect real-world aquaculture settings. This research team took a different approach. They developed a novel system for exposing oysters and mussels in tanks to realistic conditions using water pumped in from the sea, meaning the animals would experience fluctuations in acidity, temperature, and nutrients similar to those experienced by shellfish on nearby farms.
The researchers set up 12 experimental tanks on the French Mediterranean coast in the Thau lagoon, where shellfish farming is key for the local economy. In three tanks, oysters and mussels were exposed directly to pumped-in seawater under present, ambient conditions. The rest of the tanks received seawater that was first warmed and acidified in accordance with widely accepted climate projections for 2050, 2075, and 2100, with three tanks for each year.
The survival rate of oysters in the tanks with predicted 2100 conditions dropped by 7% compared to present rates, and their growth rate dropped by 40%. These results suggest that yields of farmed oysters in the Mediterranean could drop severely over the next several decades.
The mussels fared even worse. In fact, compared to oysters, mussels have a lower range of water temperatures in which they can survive, and the upper limit is already being exceeded in some summertime Mediterranean waters, leading to mass-mortality events. In the experimental tanks under present conditions, mussel mortality was about 40%, and nearly all mussels died under predicted 2050 conditions.
On the basis of these findings, the researchers call for the urgent development of strategies to protect Mediterranean shellfish farming, such as relocating mussel-farming operations to the cooler waters of open seas or developing cofarming with algae to increase resilience to climate change. (Earth’s Future, https://doi.org/10.1029/2025EF005992, 2025)
—Sarah Stanley, Science Writer
![]()