Tracing the Path of PFAS Across Antarctica
Seeking Solutions to PFAS Pollution
Chemical Companies Are Churning Out New PFAS. Where in the World Are They Ending Up?
The Persistence of PFAS
A Peculiar Polymer Paired with Sunlight Could Remove PFAS
Tracing the Path of PFAS Across Antarctica
Pollution Is Rampant. We Might As Well Make Use of It.
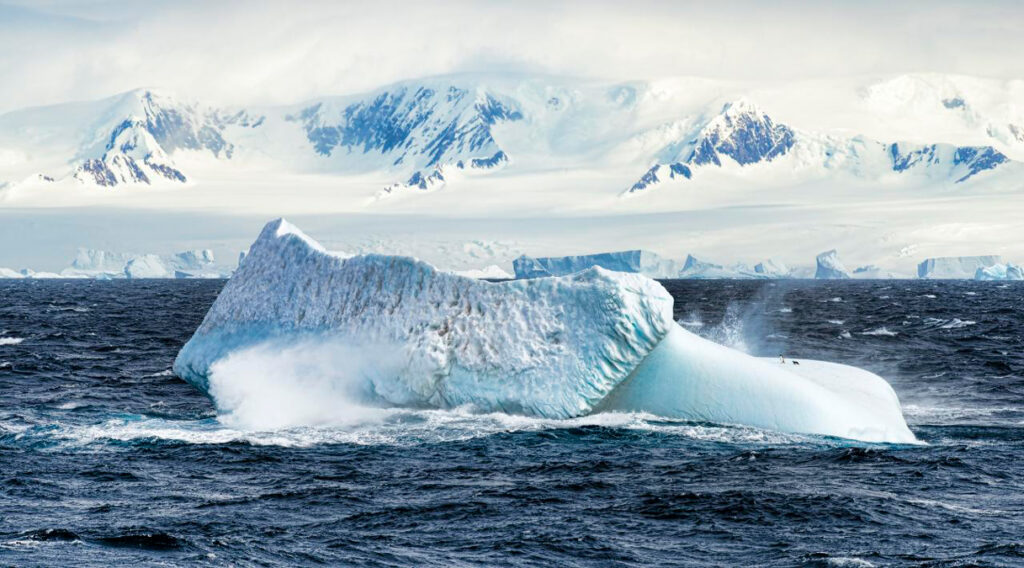
Per- and polyfluoroalkyl substances (or PFAS) have been widely used in thousands of common nonstick, waterproof, or stain-resistant products since the 1950s. These “forever chemicals” do not break down easily: PFAS make their way into the air, soil, and water, as well as into human and animal bloodstreams and to some of Earth’s most pristine environments. They have been detected even in Antarctica, despite its reputation as a relatively untouched landscape far from the types of products—fast-food wrappers, firefighting foam, nonstick cookware—that contain PFAS.
Research into how PFAS arrive in Antarctica is limited, and most tends to focus on the continent’s coasts, rather than its interior. A new study published in Science Advances aimed to fill some of these gaps by examining PFAS accumulation across a 1,200-kilometer stretch of Antarctica, from the snow pits of Zhongshan Station in East Antarctica to the 4,093-meter peak of Dome A. By examining layers of snow collected from the coast to the interior, researchers sought to better track and understand how PFAS levels vary by location and how these forever chemicals have been able to travel long distances through the upper atmosphere to be deposited in remote regions.
“For substances to get there, they have to be able to transport long distances,” said Ian Cousins, a chemist at Stockholm University and one of the study’s authors. “We know PFAS are very persistent, so that helps. By looking at the patterns of the PFAS contamination in the samples, it gives us clues as to how they’re transported.”
PFAS Arrive by Air and by Sea
Along the 1,200-kilometer route, researchers from the Chinese Academy of Sciences collected 39 snow samples at 30-kilometer intervals, scraping the first few centimeters of snow from the surface to analyze for traces of PFAS.
Zhongshan Station sits near Prydz Bay, and there, researchers collected snow from a 1-meter-deep pit, with samples taken every 5 centimeters. At Dome A, the summit of the East Antarctic Ice Sheet, samples were collected at 10-centimeter intervals from another snow pit; this one was 3 meters deep, providing information about the past several decades of PFAS use.
“It’s quite interesting that we see the historical production record of PFAS in this pit on the top of this mountain in Antarctica,” said Cousins.
PFAS pollution arrives in Antarctica in two ways: via upper atmospheric transport and sea spray. Some PFAS are formed in the atmosphere when volatile precursor chemicals like fluorotelomer alcohols used in textile and paper products break down through reactions with sunlight and oxidants into more stable compounds. The resulting PFAS are later deposited into the snow and ice through precipitation.
Storm winds near the coast create sea spray. “When you have waves, it makes bubbles in the ocean. When the bubbles burst, these sea spray aerosols can be super enriched with PFAS. This has been shown to be a very important transport route,” Cousins said.
To distinguish between sources, researchers measured sodium in the snow to trace the ocean’s salty influence. Sodium levels decreased farther inland, reflecting the fading influence of sea spray toward the interior of the continent. But surprisingly, PFAS concentrations actually increased moving from the coast into the interior.
“That was kind of a bit counterintuitive to me,” explained Cousins, who said he expected PFAS levels to be highest near the coast. “You see the opposite, actually.”
The inland increase is likely explained by higher snowfall totals in the coastal regions, which lead to PFAS concentrations becoming diluted. Inland, where snowfall is lower, even small amounts of PFAS can result in relatively higher concentrations within snow samples.
Additional factors shape PFAS distribution. PFAS levels are higher at the onset of precipitation events when they are rapidly removed from the air. Temperature inversions, too, can trap chemicals. In coastal areas, PFAS are more influenced by sea spray in the winter, whereas stronger sunlight drives the degradation of atmospheric precursors into PFAS in the summer months.
PFAS Presence at Both Poles
This new study also offers implications for the way that PFAS circulate globally. Though industrial activity in the Northern Hemisphere contributes most heavily to PFAS emissions, large-scale atmospheric circulation allows these compounds to reach polar regions. Rapid transport in the upper troposphere may act as an efficient pathway to shuttle PFAS across both hemispheres before they are deposited in the cold, remote regions at both ends of Earth.
“This completes the global picture with agreeing measurements at both poles, solidifying our understanding of the global distribution and drivers of PFAS contamination.”
Even though PFAS levels are higher in the Arctic, both polar regions show similar trends in PFAS concentrations since the 1990s. “It really matches decades of the same records that have been reported from the Arctic,” said Cora Young, an atmospheric chemist at York University, who was not involved in the new study.
“This completes the global picture with agreeing measurements at both poles, solidifying our understanding of the global distribution and drivers of PFAS contamination. The role of CFC [chlorofluorocarbon] replacements, changes in regulation, all of these things are important in the Northern Hemisphere and also the Southern Hemisphere,” said Young.
—Rebecca Owen (@beccapox.bsky.social), Science Writer