An ultra-large crude oil tanker at the Beihai shipyard in Qingdao City, Shandong Province, China on June 10, 2026. | CFOTO/Future Publishing via Getty Images
Gas prices are high right now — an average of roughly a dollar more than they were last year for Americans. But considering that we’re not more than 100 days into the closure of the Strait of Hormuz, which the International Energy Agency called the “most severe oil supply shock in history,” it seems like they should be higher. When
An ultra-large crude oil tanker at the Beihai shipyard in Qingdao City, Shandong Province, China on June 10, 2026. | CFOTO/Future Publishing via Getty Images
Gas prices are high right now — an average of roughly a dollar more than they were last year for Americans. But considering that we’re not more than 100 days into the closure of the Strait of Hormuz, which the International Energy Agency called the “most severe oil supply shock in history,” it seems like they should be higher. When the Hormuz crisis began, many analysts were predicting the price of oil would rise to $200 a barrel, which might mean gas in the $6.50 to $7 per gallon range. Instead, oil is currently trading at less than $90 a barrel.
So what’s going on? There are a few explanations. One is that more oil is still leaving the Middle East than many thought possible, via alternative pipelines and via covert means through Hormuz itself. Another is that oil-producing countries that don’t depend on Hormuz, most importantly the US, are ramping up production. Many countries are also still tapping their strategic reserves. But possibly the largest and definitely the most unexpected factor is that the world’s most insatiable consumer of oil has just stopped buying it.
China turns off the tap
China is normally the world’s top crude oil importer, and it sources much of that oil from Iran and other countries in the Middle East. China’s imports have fallen from around 11.6 million barrels a day to around 7.8 million, the lowest levels since 2017. To put it simply, there are millions of more barrels per day for other countries to import than anyone thought was possible. Good news for every other economy in the world — but what about for China itself?
“If I knew nothing else about what was going on and I was just looking at my data, I would assume there had been a demand collapse on par with the Covid-zero lockdowns,” said Rory Johnston, a Toronto-based oil market researcher, referring to the draconian policies the Chinese government imposed during the pandemic that effectively ground its domestic economy to a halt. “But that’s strange, because I haven’t seen any news about China relocking down its economy.”
China’s economy hasn’t cratered. Quite the contrary: All available data on industrial output, automobile traffic, pollution, and other economic indicators suggests that the country is humming along as normal. In recent years, the Chinese state has made massive investments in green energy and electric vehicles. Those investments have likely helped cushion the blow, but they’re still not enough to account for the numbers we’re seeing.
Instead, we seem to be seeing the results of a longer-term strategy. Back in 2023, many analysts were perplexed by the fact that China was dramatically ramping up its imports of crude oil and its refineries were pumping out dramatically higher amounts of gasoline and diesel, despite the fact that the country’s economy was slowing down. There appeared to be little demand for all that fuel at the time. We may be seeing the fruits of that stockpiling now.
China’s government also hasn’t explained their rationale for cutting imports during the current conflict, nor has it publicly acknowledged that it is. The closest we’ve gotten to an official acknowledgement of what’s happening may have been from US Energy Secretary Chris Wright, who said that China is releasing oil from its strategic petroleum reserve.
The odd thing about that, notes Johnston, is that the strategic reserve tanks in China that are visible to commercial satellites appear to be just as full if not more full than they were before the war. So where’s all their fuel coming from?
The most likely possibility is that China has large underground reserves that are not visible to the outside. The Chinese government has also mandated state-owned commercial companies to maintain their own strategic petroleum stocks. Whatever the case, China simply has a lot more oil on hand than we thought.
How long can China keep this up? Johnston says that’s difficult to say given that estimates of China’s stocks range from half a billion barrels to one and a half billion. But in theory, it could be months.
Why is Beijing doing this?
In theory, it’s possible that when President Donald Trump and Chinese President Xi Jinping met in May, they reached some sort of agreement for China to reduce its imports. After all, Trump is benefiting politically from the choice.
But it seems unlikely that Xi would agree to a policy to underwrite a war against one of its allies, and as unlikely that Trump wouldn’t tell anyone he had extracted that big a concession. More likely, China sees the benefit in preventing an all-out crisis in the countries that are its most important export markets.
Intentionally or not, though, China’s policies may be prolonging the war. Trump is clearly eager to reach a deal to reopen Hormuz, but not desperate enough to agree to major concessions or Iran’s nuclear program or sanctions relief. His urgency might be different if oil were at $150 a barrel rather than $90, putting even more pressure on American consumers during a pivotal election year. For all the attention paid to how Chinese missiles and satellites might be helping Iran’s war effort, that assistance might be outweighed by how its energy policies are helping the US.
Beyond this conflict, China’s policy may have wider strategic implications for China’s growing ability to weaponize its role in the global economy — a field of competition the US long dominated. As Eurasia Group oil analyst Gregory Brew wrote on X, “The world doesn’t have a swing producer any more” — referring to how Saudi Arabia’s oil production capacity once allowed it to almost single-handedly swing global energy markets — ”but it may have a swing consumer.”
In other words, China is intentionally keeping oil prices lower than they would be otherwise. It could in theory pull the rug out and jack up the world’s prices as well.
In part, China is simply also a country that’s traditionally inclined to stockpile stuff, whether it’s oil, strategic metals, or even pork. When it began its oil-buying spree a few years ago, there was some speculation it might be preparing for a major global crisis, namely an invasion of Taiwan.
There’s always been an assumption that the massive disruption to global trade a war over Taiwan would cause constitutes a sort of mutually assured economic destruction that might help dissuade Beijing from acting. But what we’re seeing is that China may actually be more insulated from that kind of disruption — and even more capable of causing it — than we thought.
SINGAPORE: If you’ve ever stepped outside, immediately started sweating, and wondered whether humans were actually meant to live in this level of humidity, you’re probably not alone.
One man recently admitted that Singapore’s heat has become such a concern that it has made him think about something he never seriously considered before: moving overseas.
Posting on the r/askSingapore subreddit on Tuesday (Jun 9), he said that while he and his children are still coping with the weather for now, the
SINGAPORE: If you’ve ever stepped outside, immediately started sweating, and wondered whether humans were actually meant to live in this level of humidity, you’re probably not alone.
One man recently admitted that Singapore’s heat has become such a concern that it has made him think about something he never seriously considered before: moving overseas.
Posting on the r/askSingapore subreddit on Tuesday (Jun 9), he said that while he and his children are still coping with the weather for now, the recent heat has made him question what life in Singapore might be like in the years ahead.
He also shared that several of his friends have already left the country because they wanted to escape the endless cycle of hot and humid weather.
“I’ve had friends who migrated out of SG because it is too hot all year round. Summer, for one season, is acceptable, but they want to experience the full four seasons,” he wrote.
With that in mind, he asked fellow Singaporeans whether they would ever consider doing the same if the country continues getting warmer.
“Will you consider moving overseas if Singapore continues to get warmer each year? Not just El Niño but generally Singapore’s humid and hot weather?” he wrote.
“I‘m so weary of our weather.”
The man’s question quickly sparked a lively discussion online. While some said they would happily tolerate the heat in exchange for Singapore’s safety and convenience, others admitted that the weather has become one of the reasons they are considering a move abroad.
One user said, “Definitely… It’s really unbearable nowadays. Imagine coming out of the shower feeling fresh, and within 5 minutes you will be sweating buckets again.”
Another commented, “Planning to move to Sweden in the next couple of years, I‘m so weary of our weather sweating non-stop daily, and I‘m ok with the winter months there.”
A third shared, “I’ve always wanted to live overseas, and I see it happening in my middle age. The weather here is definitely a push factor for me—not a major one, but it does make a huge difference.”
Others, however, pointed out that life in countries with four seasons comes with its own set of challenges.
One commenter wrote, “If you’re thinking about moving overseas with four seasons, you’ve got to think about winter. It’s a chore living during winter because of the blizzards, and when you want to go to work or even to buy groceries, you have to shovel the ice off your vehicle first and also pay for heating costs.”
Another chimed in, “Winter is cool if you are a tourist but not cool when you have to work and pay bills. If you ever lived in Japan, the bills for opening the heater will shock you.”
A third added, “You want a place that’s hot, or places with typhoons, tornadoes, floods, or earthquakes? Make your decision. Can’t have all at the same time.”
In other news, a man took to social media to share that he felt “cheated” after his uncle asked him and his two brothers to contribute S$1,500 each towards their grandmother’s funeral expenses.
In a post on the r/SingaporeR subreddit, the man said his uncle approached them to help pay for the funeral, which was held at a temple. However, he later became suspicious after checking funeral prices online and finding that similar arrangements typically cost between S$5,000 and S$8,000.
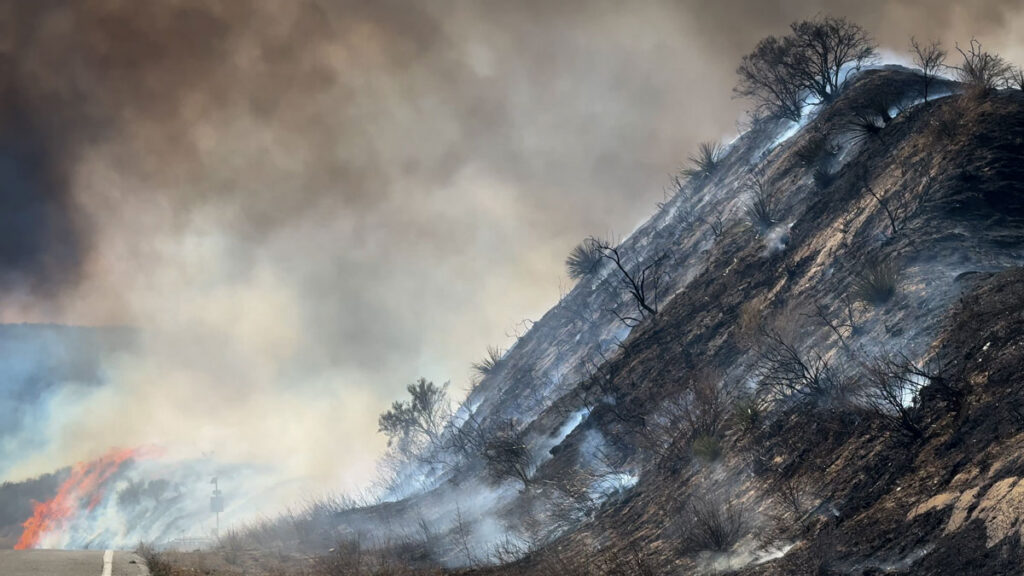
California is no stranger to the hot, dry summer weather that makes wildfires more likely. But wildfire season in the state is now stretching into the heart of winter, when it has historically been protected by cool, wet weather. In January 2025, Southern California experienced some of the deadliest and costliest wildfires in the state’s history.
Now, a new study published in Nature Communications shows that the climatic changes that increase the risk of these winter wildfires could be drive
California is no stranger to the hot, dry summer weather that makes wildfires more likely. But wildfire season in the state is now stretching into the heart of winter, when it has historically been protected by cool, wet weather. In January 2025, Southern California experienced some of the deadliest and costliest wildfires in the state’s history.
Now, a new study published in Nature Communications shows that the climatic changes that increase the risk of these winter wildfires could be driven by low autumn snow levels thousands of miles away, in western Eurasia. The authors said that tracking snowfall in Eurasia could help forecast winters in California that will have higher chances of wildfires.
The researchers were motivated by the catastrophic 2025 wildfires to search for climate drivers of winter wildfire conditions in California. First, they looked for correlations between winter wildfires and ocean temperatures, especially La Niña events that are associated with drier-than-average conditions in California. They also examined variability in sea ice, which can affect global weather patterns. But they saw only weak connections.
Compared to oceans and sea ice, the influence of snow cover on global weather patterns is less studied, said Shineng Hu, a climate scientist at Duke University and lead author of the paper. But another climate researcher in Hu’s lab, Shizuo Liu (first author of the study), had previously studied the connection between snow cover and weather patterns and suggested the team look for connections between snow and fires. That’s when they found significant correlations between the winter wildfires in California and low snow cover in western Eurasia.
“When I saw the result, I was suspicious,” Hu said, “because we all know that correlation doesn’t mean causality.” But they ran hundreds of climate model simulations reducing snow cover in Eurasia and saw an increased probability of winter fires in California. “At that point, we were pretty much convinced that there could be something interesting happening over there,” Hu said.
Propagating Pressure
“I’m glad to see this group saying snow can do something similar to what ocean temperature anomalies can do.”
The scientists determined that this intercontinental link starts because the land absorbs more energy when snow cover is low, disturbing the atmosphere above it. This disturbance, like a stone thrown into water, generates large waves of air called Rossby waves that travel eastward along the jet stream across the Pacific Ocean. The Rossby waves drive the formation of a high-pressure zone that creates the hot, dry, windy conditions conducive to wildfires.
“I’m glad to see this group saying snow can do something similar to what ocean temperature anomalies can do,” said Judah Cohen, a climatologist at the Massachusetts Institute of Technology who was not involved in the study but has also studied the links between snow in North America and Eurasia. “I’ve been surprised by how important this mechanism is for U.S. weather in the winter and how little there is about it in the literature.”
“This is just one missing gap that people didn’t even realize. We want to add that to the table.”
But Cohen suggested the study tells only part of the story. In North America, dry winters in the west are paired with wet, cold winters in the east. The same is true in Eurasia, and according to Cohen’s past research, when snow levels are low in western Eurasia but high in eastern Eurasia, a temperature and pressure gradient is created across the continent. The energy released as the atmosphere works to equalize that pressure drives the Rossby waves. Cohen said the disparity between snow levels in eastern and western Eurasia would likely strengthen the Rossby waves and then the warming in California. “If all of Eurasia [had] below normal [snow levels], I don’t think you could easily excite this wave energy that propagates across the hemisphere.” He also stressed that Rossby waves don’t just travel eastward. They also travel upward into the stratosphere, where they bounce back down over North America and intensify the high pressure over the western United States.
Both Cohen and the study authors insisted that many other factors influence whether wildfires ignite in winter. “This is just one missing gap that people didn’t even realize. We want to add that to the table,” said Hu. But monitoring snow levels in Eurasia could offer signs of bad wildfire winters to come. The January 2025 Southern California fires were preceded by low snow levels in November and December in Eurasia, Hu said. “So there’s a 1‑month lag, which gives us some hope that we can use that for prediction.”
Citation: Chapman, A. (2026), Low snow in Eurasia linked to wildfires in California, Eos, 107, https://doi.org/10.1029/2026EO260138. Published on 13 May 2026.
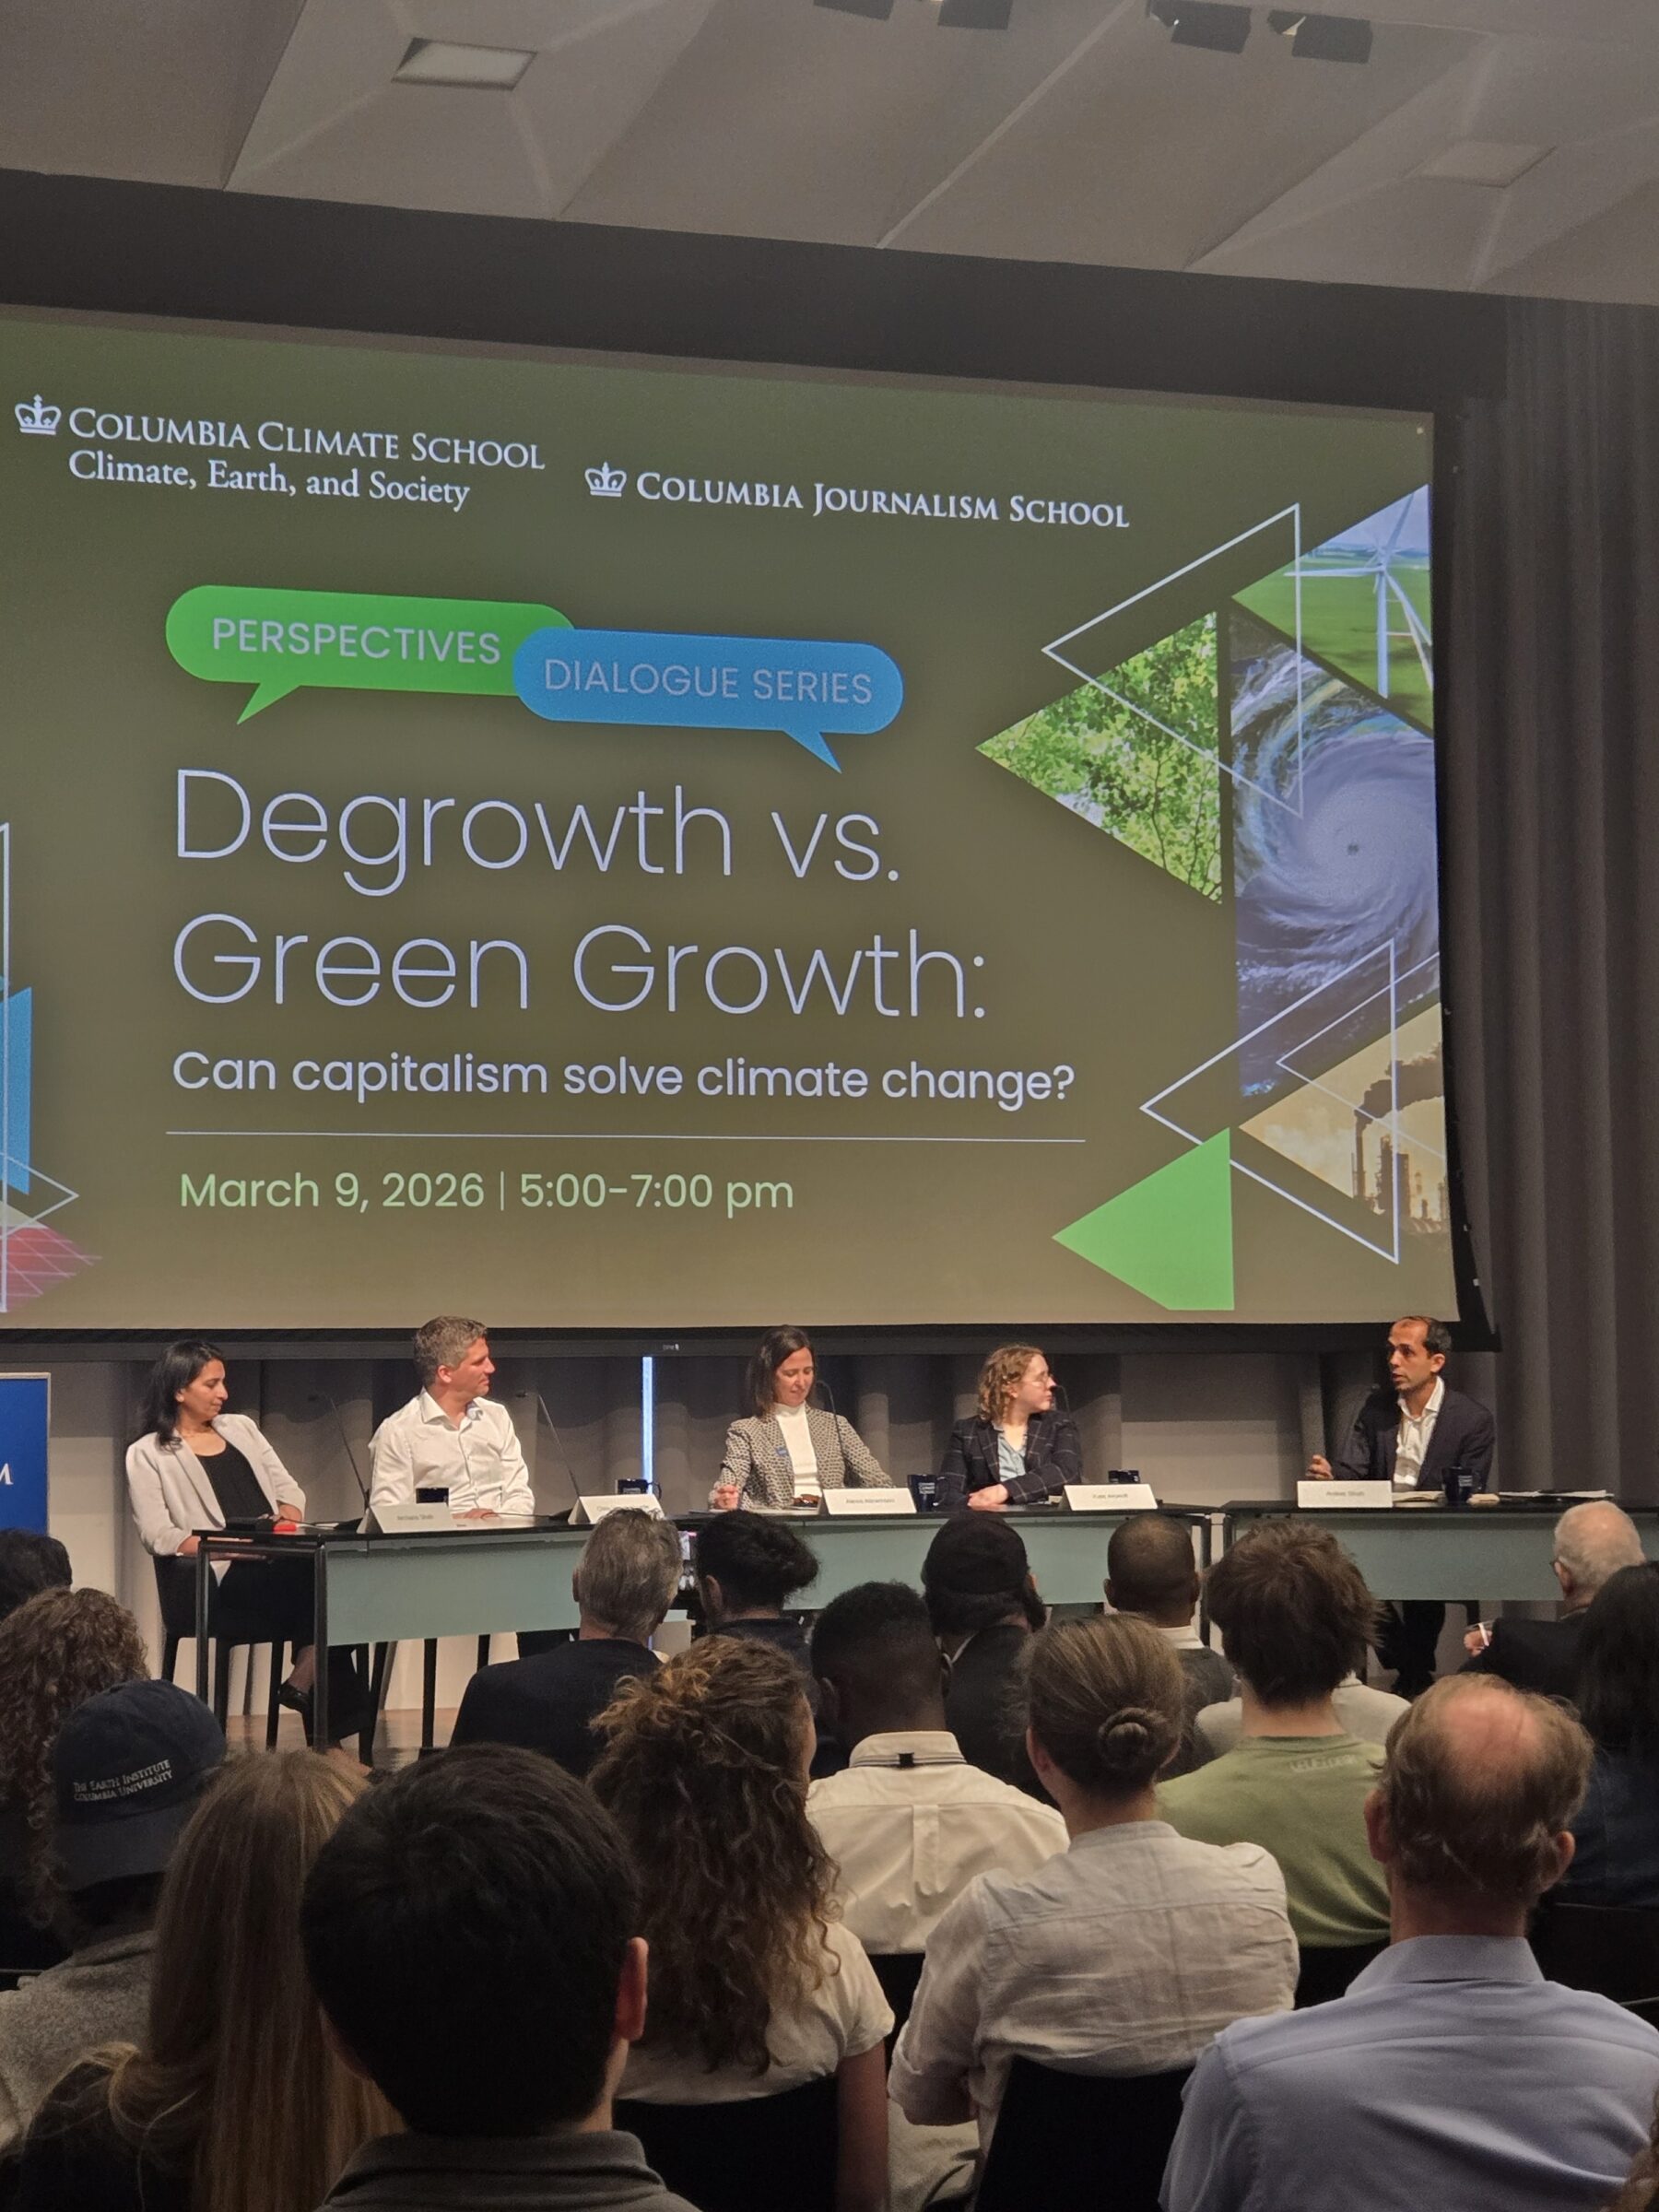
The inaugural Perspectives Dialogue Series event brought together prominent thinkers with diverse perspectives on capitalism and the role it could play in solving climate change.
The inaugural Perspectives Dialogue Series event brought together prominent thinkers with diverse perspectives on capitalism and the role it could play in solving climate change.
Editors’ Highlights are summaries of recent papers by AGU’s journal editors.
Source: Journal of Geophysical Research: Atmospheres
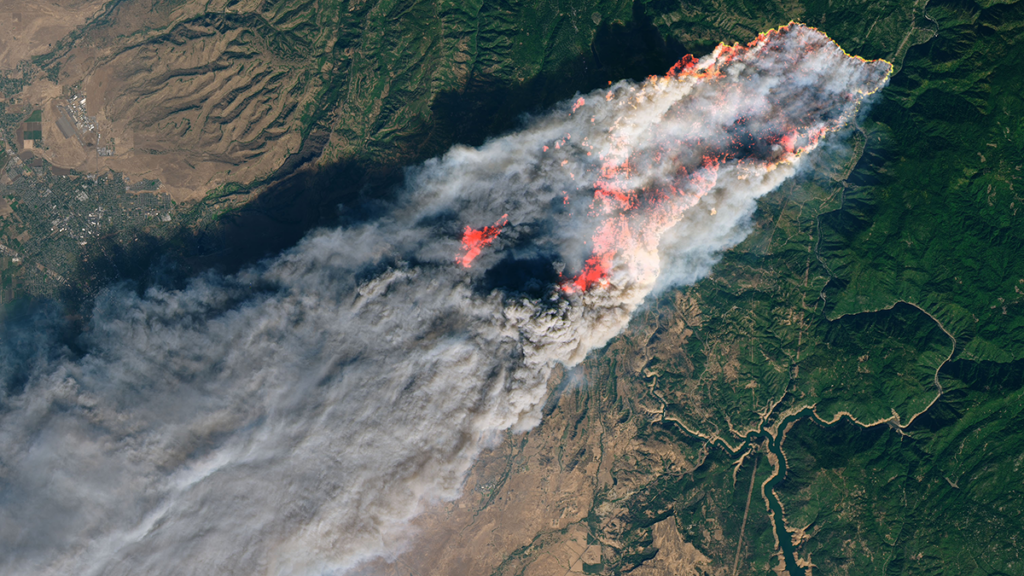
The 2018 Camp Fire was the deadliest and most destructive wildfire in California history. The Camp Fire spread extremely rapidly, driven by strong winds and dry fuels, but also by organized long-range spotting, i.e. lofting and downwind fallout of burning embers to ignite new fires.
Using operational Doppler radar and satellite observations, Lareau [2026] pr
Source: Journal of Geophysical Research: Atmospheres
The 2018 Camp Fire was the deadliest and most destructive wildfire in California history. The Camp Fire spread extremely rapidly, driven by strong winds and dry fuels, but also by organized long-range spotting, i.e. lofting and downwind fallout of burning embers to ignite new fires.
Using operational Doppler radar and satellite observations, Lareau [2026] provides the first high resolution depiction of spotting behavior during an extreme wildfire. Observations show that spot fire events for the Camp Fire occurred 5-10 kilometers ahead of the fire front, quickly merging into new fire lines. Spot fires are not random but aligned within coherent fallout zones that are shaped by plume dynamics and background winds. These results show that operational weather radar can identify lofting and fallout regions in real time, providing a new way to anticipate spotting-driven fire spread and improve early warnings for fast-moving wildfires.
(a) Along wind cross section of Camp Fire plume reflectivity observed by radar measurements, showing distinct updrafts (white arrows) and ashfall regions (blue dashed arrow). Spot fires within 10 minutes of these radar measurements are shown as filled cyan triangles. (b) Map of column maximum radar reflectivity and fire perimeter. In both panels the black dashed line indicates the eastern edge of the town of Paradise, California. Credit: Lareau [2026], Figure 6ab
Citation: Lareau, N. P. (2026). Plume-coupled long-range spotting drove the explosive spread of the 2018 Camp Fire. Journal of Geophysical Research: Atmospheres, 131, e2025JD045798. https://doi.org/10.1029/2025JD045798
Source: Community Science
Heat, air pollution, and flooding can affect a city and the health of city residents. Yet few cities have a comprehensive network of weather stations providing accurate measurements of rainfall, humidity, and air temperature across different neighborhoods. Some of this information can be filled in by community members’ personal weather stations, like those connected through Weather Underground. But because of a lack of sensors and inconsistencies in data collection,
Heat, air pollution, and flooding can affect a city and the health of city residents. Yet few cities have a comprehensive network of weather stations providing accurate measurements of rainfall, humidity, and air temperature across different neighborhoods. Some of this information can be filled in by community members’ personal weather stations, like those connected through Weather Underground. But because of a lack of sensors and inconsistencies in data collection, these types of community networks are often not reliable on their own. Furthermore, most personal weather stations are located in higher-income neighborhoods, with very few in lower-income, underserved neighborhoods.
The same is true in Baltimore, where personal weather stations are more prevalent in higher-income, majority-white neighborhoods around and stretching north from the Inner Harbor but are lacking in lower-income and majority-Black neighborhoods to the west and east. Furthermore, only one National Weather Service sensor is present in the city itself, in the Inner Harbor, and another sensor is located about 12 kilometers (8 miles) away at Baltimore/Washington International Airport.
Waugh et al. describe a partnership between universities, state agencies, and Baltimore residents to build the Baltimore Community Weather Network (BCWN) that addresses the missing data coverage around the city. Unlike the patchwork of personal weather stations, community members participating in the BCWN are from underserved areas in the city and are actively involved in data collection and interpretation.
Weather stations are placed in open spaces to avoid obstacles like buildings or trees affecting measurements of temperature, rainfall, or wind. This careful placement is designed to ensure that the data collected are as close as possible to the conditions experienced by actual residents.
BCWN sites are carefully monitored and managed by community members. Baltimore residents are actively involved in data collection, weather station management, and decisionmaking with scientists and local organizations to help promote engagement, education, and community empowerment.
Because Baltimore is not the only U.S. city that has historically lacked accurate weather data coverage, the BCWN system could be applied to other locations—or even used to monitor other environmental exposures, such as air pollution, the authors say. (Community Science, https://doi.org/10.1029/2025CSJ000154, 2026)
Citation: Owen, R. (2026), Fixing Baltimore’s unequal weather data coverage, Eos, 107, https://doi.org/10.1029/2026EO260108. Published on 13 April 2026.
“Future winters promise less snow, more rain. Nobody’s prepared.” So proclaims the title of a recent article in the Proceedings of the National Academy of Sciences of the United States of America that frames adaptation to snow loss as the “million-dollar question” facing the western United States.
As the largest sectoral consumer of fresh water globally, agriculture is particularly vulnerable to snow loss.
Declining snowfall—and snowmelt—affects ecosystems, urban and rural water supplies,
“Future winters promise less snow, more rain. Nobody’s prepared.” So proclaims the title of a recent article in the Proceedings of the National Academy of Sciences of the United States of America that frames adaptation to snow loss as the “million-dollar question” facing the western United States.
As the largest sectoral consumer of fresh water globally, agriculture is particularly vulnerable to snow loss.
Declining snowfall—and snowmelt—affects ecosystems, urban and rural water supplies, hydropower, recreation, tourism, and agriculture. As the largest sectoral consumer of fresh water globally, agriculture is particularly vulnerable to snow loss.
In response, water managers have developed a range of approaches for adapting to snow loss: infrastructure-based approaches like managed aquifer recharge, nature-based solutions such as forest management and beaver dam analogues, demand-side approaches like multibenefit land repurposing, and polarizing supply-side approaches like reservoir expansion and cloud seeding (Figure 1).
Fig. 1. Potential approaches to reduce negative impacts to agriculture from snow loss include a variety of adaptive strategies that address either water supply or demand. Click image for larger version.
However, efforts to identify which of these strategies to implement for different drainage basins, or watersheds, using the variety of available approaches seem to fall into one of two traps: either searching for unrealistic one-size-fits-all panaceas [Ostrom, 2007] or treating every basin as unique, which is costly and inefficient.
The “trillion-dollar question” isn’t how to adapt but, rather, where existing strategies may make the most—and fastest—difference.
Importantly, continuing along this trajectory means that we’re on track to offset only about a third of global climate-induced crop yield losses by 2100. For the western United States, previous work has estimated cumulative economic losses from declining snowfall of hundreds of billions to trillions of dollars while noting that rational adaptation decisions are hampered by the lack of financial analyses of the importance of snow [Sturm et al., 2017].
We thus suggest that the “trillion-dollar question” isn’t how to adapt but, rather, where existing strategies may make the most—and fastest—difference to offset projected losses. Answering this question requires an approach that matches strategies to the contexts where they are more likely to succeed—one that treats basins as neither uniform nor unique.
A Mismatch in Research and Operational Scales
Physical scientists tend to look at snow loss as a basin-scale problem, in part because this view aligns with hydrologic boundaries. However, as our colleague, applied economist Joey Blumberg, explains, “county lines were not drawn to follow watersheds, and rivers do not conform to political borders, creating a patchwork of mismatched boundaries.”
Scientists have long emphasized that mitigating climate change requires us to “think globally, assess regionally, act locally.” And in 1992, the authors of the Dublin Principles reasoned that moving the needle on “wicked water problems” requires targeting decisionmaking at the “lowest appropriate level,” where stakeholders can collaborate most effectively.
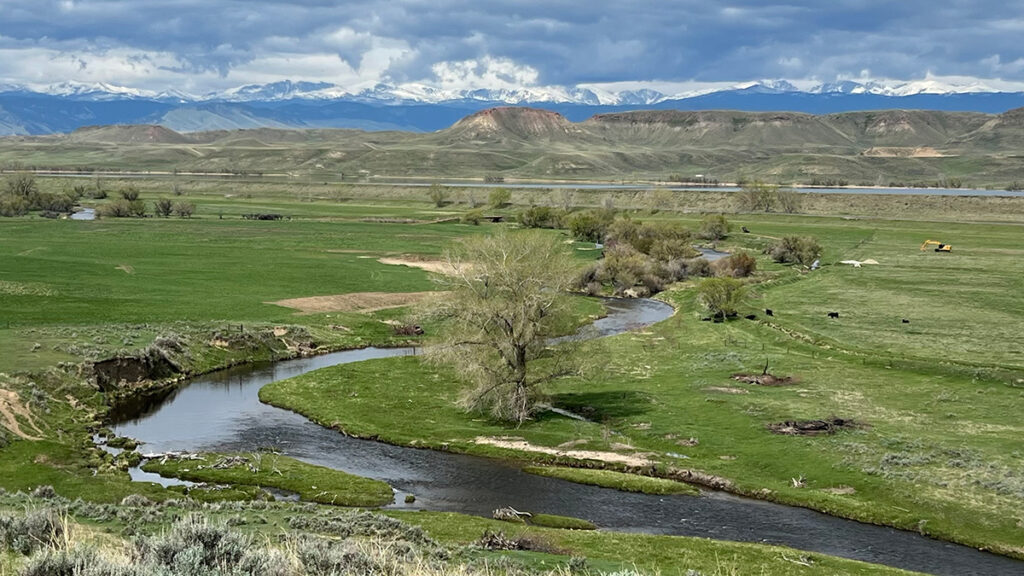
Lake Tahoe, pictured here, contains 37 trillion gallons of water, roughly half of which is supplied by snowmelt in the Sierra Nevada Mountains. Credit: Beatrice L. Gordon
Working at this scale, we found one-size-fits-all strategies often don’t hold up, even within the same hydrologic basin [Gordon et al., 2024; Boisramé et al., 2026]. In the Upper Colorado River Basin, for example, expanding reservoir storage could buffer agriculture in northeastern Utah against declining snowpack, but the same strategy may fail miles away in southwestern Wyoming, where a thirstier atmosphere may make it harder to refill existing reservoirs.
However, collecting detailed local-scale information for just 13 of the roughly 2,600 operational contexts nationwide took almost 3 years of searching websites, reading working papers, and calling water managers.
Scaling this approach across the entire western United States is understandably overwhelming. We need a more systematic approach to help managers identify which strategies could work most effectively, and where.
A Diagnostic for Agriculture and Snow Loss
Ostrom [2007] argued that complex systems, such as Western agriculture, “are partially decomposable in their structure.” This insight is woven into archetype analysis, an approach for identifying recurrent patterns across otherwise diverse systems.
Like workplace assessments—which are genuinely useful, albeit imperfect, tools for understanding successful management styles—archetypes draw on qualitative, quantitative, or hybrid approaches to group diverse operational contexts on the basis of shared characteristics [Sietz et al., 2019]. These groupings enable systematic knowledge transfer about, for example, how management strategies that work in one context can also guide adaptation elsewhere.
Three main characteristics interact to define operational contexts in snow-dependent agriculture in the western United States: physical constraints, governance systems, and human behavior.
“Researchers can empirically derive building blocks or components that comprise archetypes to represent key features of a system,” explains Elizabeth Koebele, who studies urban water sustainability [Garcia et al., 2019] and has begun applying archetypes in that context. However, she notes, these building blocks “vary based on the system context, available data, and study goal.”
We propose three main characteristics that interact to define operational contexts in snow-dependent agriculture in the western United States: physical constraints, governance systems, and human behavior. Physical constraints, including biophysical setting, infrastructure, and climate, determine available water supplies. Governance capacity relative to governance complexity shapes how those supplies are allocated across competing uses. Human behaviors influence both water demand and how users respond to supply conditions and governance rules.
Using these characteristics to establish archetypes of water management contexts could define a path forward for operationalizing an approach to accelerate successful adaptations to declining snowpacks in the West.
Constraining How Snowmelt Becomes Water Supply
Physical constraints stem from biophysical processes that influence how, when, and how much snow becomes streamflow; infrastructure that stores and conveys water; and hydrologic and climatic uncertainties about future supplies. These constraints can vary substantially from basin to basin.
Consider the Walker River Basin and California’s San Joaquin Valley, both of which rely on Sierra Nevada snowpack but have different biophysical settings. In some parts of the central Sierra, forest management can reduce wildfire risk and increase streamflow by up to 14% during low-snow years. Elsewhere, however, water made available by forest management may be consumed by remaining vegetation, limiting downstream gains.
These biophysical differences interact with uses of built infrastructure, including irrigation systems, reservoir outlets, and canals, to determine how and when water is stored and released. As temperatures warm and snowmelt declines, officials in both the Walker River and San Joaquin Valley basins must increasingly manage for a wider range of extremes, including “cold-water droughts.” However, the infrastructure to manage these trade-offs through reservoir storage and operations that balance agricultural deliveries with aquatic habitat needs is more developed in the highly managed San Joaquin than in the Walker.
Thankfully, measuring physical constraints on snowmelt at basin scales is becoming more feasible today with newly developed tools.
Layered on top of biophysical and infrastructural constraints are climatic and hydrological uncertainties, such as whether snow loss will lead to more evapotranspiration and less streamflow. These uncertainties complicate management decisions based on cost-benefit modeling of individual strategies: Should districts expand reservoir storage if precipitation is predicted to increase or decrease depending on the model? Frameworks like Decision Making Under Deep Uncertainty emphasize the need to select strategies that are robust across many possible futures.
Thankfully, measuring physical constraints on snowmelt at basin scales—a means, along with improved modeling, to reduce hydroclimatic uncertainties—is becoming more feasible today with newly developed tools. Water managers can turn, for example, to databases like the U.S. Geological Survey’s ResOpsUS [Steyaert et al., 2022], which catalogs historical reservoir operations across the contiguous United States, and to publicly available hydrologic projections such as those from Oak Ridge National Laboratory’s Coupled Models Intercomparison Project phase 6 (CMIP6) ensemble.
Governance Controls Supply Allocations
We frame governance around capacity and complexity. Capacity in this context is the ability of stakeholders “to mobilize resources in order to make equitable and fair decisions around shared challenges,” according to governance scholar Gina Gilson. Complexity refers to the number and intricacy of jurisdictions, authorities, regulations, and stakeholders involved. As governance complexity increases, the effectiveness of adaptation strategies becomes more sensitive to capacity constraints, particularly regarding timescales and funding.
For example, infrastructure in the Walker is controlled locally by a single water district, and jurisdictional coordination involves two states and the Walker River Paiute Tribe. Coordination on water management is never simple, but fewer jurisdictions generally means faster decisionmaking and clearer authority, allowing the single water district to implement strategies like multibenefit land repurposing more readily. Such implementations, in turn, enable reduced agricultural water use, directly supporting restoration of Walker Lake and recovery of endangered species.
The San Joaquin Valley is vastly different in scale and complexity, covering eight California counties, one of which alone has 22 water districts and seven cities. Following the passage of the state’s Sustainable Groundwater Management Act, water users in the basin formed more than 120 groundwater sustainability agencies. Agricultural water management thus involves overlapping federal and state systems that operate under different rules, contracts, and regulatory requirements. Whileland repurposing programs can be implemented, more substantial capacity, time, and resources are typically needed to do so.
Emerging efforts like the Western States Water Data Access and Analysis Tool (WestDAAT) and the Harmonized Database of Western U.S. Water Rights make it easier to assess governance in a basin by standardizing data about rules, regulations, and water rights across states. Combined with mapping of irrigation service areas and water transfers [Siddik et al., 2023], these resources help stakeholders identify the jurisdictions involved, how authority is distributed, and what coordination mechanisms exist for agricultural water management.
Human Behavior Shapes Demand Responses
Once snowmelt reaches water users, behavioral dynamics—how people respond to crises, policies, and changing conditions—determine how effectively management strategies achieve desired results.
Water demand is influenced by consumption choices and by economic, political, and cultural factors.
Water demand is influenced by consumption choices and by economic, political, and cultural factors. It is also influenced by factors that typical hydrologic models rarely account for, including social structure, social memory, and affluence. More affluent users are less likely to modify their behavior to reduce water use under conditions of scarcity.
The dynamics of water demand in the South Platte River Basin, for example, are especially complex, as they are balanced across cities, agriculture, and ecosystems across parts of Colorado, Nebraska, and Wyoming. Water prices in the basin’s Big Thompson project, a federal water diversion system in northern Colorado, jumped from $1,500 per acre-foot in 1990 to more than $30,000 in 2018, driven by economic factors that resulted in cities owning 70% of water originally intended for agriculture.
Even with reliable projections of future climate and water supply, carefully planned strategies can be overwhelmed by economic and behavioral factors, resulting in transfers and reallocations of water. What’s more, behavioral responses to adaptation strategies can paradoxically increase demand when users perceive that scarcity problems are solved.
The “reservoir effect” occurs when water security perceptions encourage expansion of water-intensive activities [Di Baldassarre et al., 2018]. Similarly, the irrigation efficiency paradox shows how efficiency gains can lead to expanded production and reduced return flows (how much irrigation water returns to streams and aquifers) downstream [Grafton et al., 2018].
Conceptual frameworks, models, and global case studies have all been used as approaches to study the effects of human behavior on hydrology. With sufficient training data, we believe tools like machine learning could be used to further explore how behaviors influence adaptation and to anticipate shifts as snow loss continues.
Archetypes in Practice
By evaluating how physical factors, governance systems, and human behavior shape outcomes across places like the Walker, South Platte, and San Joaquin basins, researchers and practitioners can establish archetypes to help identify patterns in what strategies are most effective in different places and assess how to transfer lessons from one setting to another (Figure 2).
Fig. 2. An archetype-based diagnostic grounded in evaluating the physical constraints, governance, and human behavioral dynamics affecting hydrologic basins could facilitate more rapid transfer of learning about successful adaptation approaches across snowmelt-dependent agriculture in the western United States.
The Walker River Basin exemplifies an archetype common to agriculturally dominated headwaters in the western United States with low governance complexity (few jurisdictions), adequate capacity (resources), low behavioral complexity (more predictable and unified user groups), and substantial physical constraints (significant future snow loss and limited infrastructure for water storage and supplementation).
With this profile, the Walker is an ideal testing ground for evaluating how effectively different strategies offset changes in snowmelt. Does cloud seeding increase snowpack? Could beaver dam analogues—a nature-based solution reminiscent of Idaho Fish and Game’s mid-20th century effort to parachute beavers into the wilderness—meaningfully increase water retention? Could multibenefit land repurposing buffer people and ecosystems against supply volatility while restoring ecosystem functionality?
The value of organizing operational contexts by archetypes is that each context need not be treated as unique.
The value of organizing operational contexts by archetypes is that each context need not be treated as unique. Lessons learned from the Walker could be systematically transferred to other areas with similar characteristics and could be incrementally tested in others.
The South Platte has physical constraints similar to Walker’s but features greater governance complexity because of multiple interstate compacts, as well as greater behavioral complexity. Modeling analyses indicate that demand-side strategies could adapt to more volatile water supply in the South Platte [Gharib et al., 2023]. But implementing them requires balancing perspectives from both agricultural and urban water users—a behavioral dynamic absent in Walker.
Crop switching to cultivate higher-value crops on less acreage could reduce water use. However, options for what crops can be grown where are constrained by factors like elevation and climate. Even where feasible, new crops would require investments in education, new infrastructure, risk management, and agronomic knowledge.
Through iterative expansion and testing, broad archetypes like “high behavioral complexity” could be specified to reflect dynamics like rural-urban competition or concerns around buy-and-dry economics. Archetypes may also point to contexts where governance complexity signals that decisionmaking is occurring above the lowest appropriate level.
The San Joaquin, with its extremely complex governance involving numerous local, state, and federal agencies managing surface and groundwater, is one potential example. Recognizing this pattern can help identify where substantial resources and long timelines may be required to implement programs (e.g., LandFlex) requiring legislative authorization, multiagency coordination, and stakeholder engagement. It may also signal the need to identify smaller operational contexts within larger settings so implementations proceed more rapidly.
Operationalizing Archetypes from Diagnosis to Action
Developing a systematic approach to match adaptation strategies with areas where they are most likely to succeed in operation is only a first step. Applying diagnostics without mechanisms to implement new strategies is often insufficient to drive timely action.
An instructive precedent of success in water quality management comes from the 1970s. By then, pollution controls on factories had improved compared with the early 20th century, yet water quality in surface waters across the country still declined because of pollution in agricultural runoff. The breakthrough came with the EPA’s total maximum daily load (TMDL) program, which created a structured process that set measurable goals for reducing pollution and assigned responsibility for meeting those goals to the sources of the pollution, allowing for local control over adaptation.
Archetypes could play a similar role in facilitating beneficial snow-loss adaptations, and a structure like the TMDL program could start by assessing supply-demand risks across operational areas, setting performance targets such as reservoir reliability and shortage frequency, and then using the diagnostic to identify which strategies fit each archetype. Results and lessons could be shared region-wide, while implementation would remain locally driven.
This suggestion is, emphatically, not a prescription for specific policy mechanisms. But it serves as a reminder that—just as few of us engage with workplace assessments or change behavior on the basis of their results without organizational support—archetypes will need to be paired with implementation structures to translate diagnosis into action.
Beyond Silver Bullets
There is no single answer to our trillion-dollar question, but one path forward for sustaining complex Western ecosystems lies in developing archetypes of different types of basins.
Nearly 20 years ago, Ostrom [2007] warned against seeking panaceas for complex environmental problems. There is no silver bullet for snow loss or single answer to our trillion-dollar question, but one path forward for sustaining complex Western ecosystems lies in developing archetypes of different types of basins.
A small irrigation district, for example, wouldn’t need to independently test every strategy in Figure 1 or develop complex decision support tools when a similar archetype already evaluated which strategies work under comparable governance, behavioral, and physical conditions.
Critically, these archetypes can be developed and refined by managers and scientists to capture more nuanced realities. Physically constrained systems, for example, could include areas facing high future uncertainty or limited reservoir flexibility. Governance and behavioral dimensions could likewise evolve to represent contexts where subsidies lead to incoherent incentives or where cultural norms link water use to local identities and traditions.
Like workplace assessments, the goal isn’t to diminish unique personalities but to work with them more strategically. Archetypes can show where we don’t need to reinvent the wheel to adapt and where the wheel might need to be tweaked. By leveraging collective knowledge and learning across regions facing similar challenges, rather than crafting new solutions basin by basin, we can reduce the time and resources needed to implement equitable and sustainable adaptation solutions.
Acknowledgments
This work is supported by the National Science Foundation (NSF) under grants 1828902 and OIA-2148788. Where We Live is funded by a grant from NSF’s Established Program to Stimulate Competitive Research (EPSCoR) RII Track-2 program and features partnerships across the University of Idaho (award 2316126); the University of Nevada, Reno (award 2316127); and the University of South Carolina (award 2316128). Work was also supported by internal funds from the Division of Hydrologic Resources at the Desert Research Institute.
References
Boisramé, G. F., et al. (2026), Think globally, model locally: Complex responses of agricultural water supplies to different climate projections, J. Am. Water Resour. Assoc., 62(3), e70117, https://doi.org/10.1111/1752-1688.70117.
Garcia, M., et al. (2019), Towards urban water sustainability: Analyzing management transitions in Miami, Las Vegas, and Los Angeles, Global Environ. Change, 58, 101967, https://doi.org/10.1016/j.gloenvcha.2019.101967.
Gharib, A. A., et al. (2023), Assessment of vulnerability to water shortage in semi-arid river basins: The value of demand reduction and storage capacity, Sci. Total Environ., 871, 161964, https://doi.org/10.1016/j.scitotenv.2023.161964.
Gordon, B. L., et al. (2024), The essential role of local context in shaping risk and risk reduction strategies for snowmelt‐dependent irrigated agriculture, Earth’s Future, 12(6), e2024EF004577, https://doi.org/10.1029/2024EF004577.
Ostrom, E. (2007), A diagnostic approach for going beyond panaceas, Proc. Natl. Acad. Sci. U. S. A., 104(39), 15,181–15,187, https://doi.org/10.1073/pnas.0702288104.
Sietz, D., et al. (2019), Archetype analysis in sustainability research: Methodological portfolio and analytical frontiers, Ecol. Soc., 24(3), 34, www.jstor.org/stable/26796999.
Steyaert, J. C., et al. (2022), ResOpsUS, a dataset of historical reservoir operations in the contiguous United States, Sci. Data, 9, 34, https://doi.org/10.1038/s41597-022-01134-7.
Sturm, M., et al. (2017), Water and life from snow: A trillion dollar science question, Water Resour. Res., 53(5), 3,534–3,544, https://doi.org/10.1002/2017WR020840.
Author Information
Beatrice L. Gordon (beatrice.gordon@dri.edu), Gabrielle F. S. Boisrame, Christine M. Albano, and Rosemary W. H. Carroll, Desert Research Institute, Reno, Nev.; and Adrian A. Harpold, University of Nevada, Reno
Citation: Gordon, B. L., G. F. S. Boisrame, C. M. Albano, R. W. H. Carroll, and A. A. Harpold (2026), Archetypes could accelerate agricultural adaptation to less snowpack, Eos, 107, https://doi.org/10.1029/2026EO260184. Published on 9 June 2026.
This article does not represent the opinion of AGU, Eos, or any of its affiliates. It is solely the opinion of the author(s).
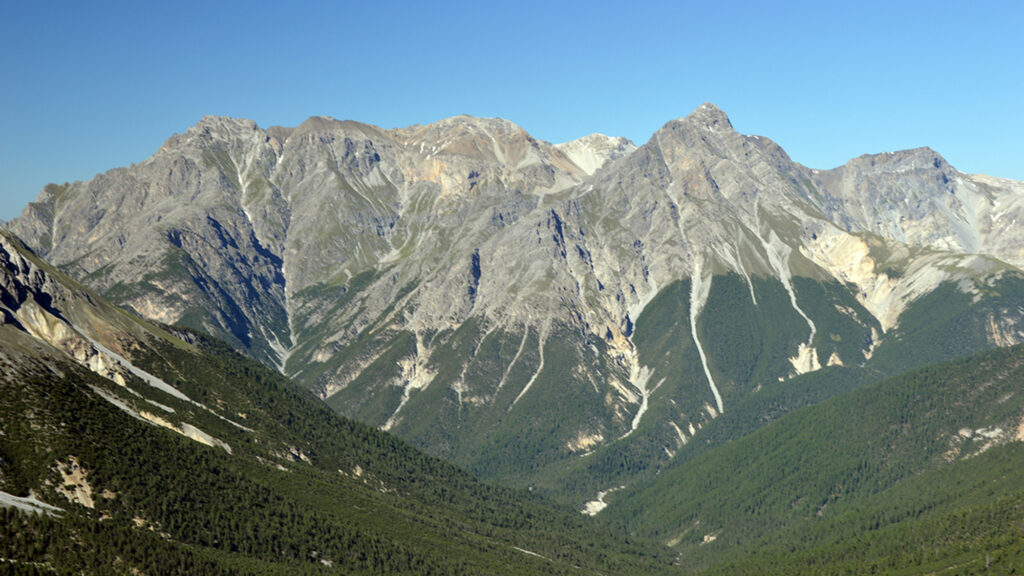
As the climate warms, tree lines are generally understood to move up, because regions that were previously too cold for trees to survive now have higher, more tree friendly temperatures.
A tree line is clearly visible in the Swiss National Park, in Graubünden, Switzerland. Credit: Sabine Rumpf, University of Basel
This migration can be seen in these images of Canada’s Waterton Lakes National Park…
Rising tree lines are visible in Canada’s Waterton Lakes National Park,
As the climate warms, tree lines are generally understood to move up, because regions that were previously too cold for trees to survive now have higher, more tree friendly temperatures.
A tree line is clearly visible in the Swiss National Park, in Graubünden, Switzerland. Credit: Sabine Rumpf, University of Basel
This migration can be seen in these images of Canada’s Waterton Lakes National Park…
Rising tree lines are visible in Canada’s Waterton Lakes National Park, seen here in 1913 (left) and 2007 (right). Credit: Mountain Legacy Project
…and of Jackson Glacier in Montana’s Glacier National Park, for example.
Jackson Glacier, in Montana’s Glacier National Park, is seen here in 1912 and 2009. As the climate has warmed, the glacier has receded significantly, and tree lines have risen. Credit: MJ Elrod, U of M Library–9/3/2009, L McKeon, USGS
But new research, published in the International Journal of Applied Earth Observation and Geoinformation, paints a more complicated picture: Between 2000 and 2020, 42% of tree lines shifted up, true. But 25% of them actually moved downhill.
Sabine Rumpf, an ecologist at the University of Basel in Switzerland, said many studies of tree line shifts tend to be concentrated in limited geographic areas. A preponderance are based primarily on data from North America, Europe, and the Himalayas, where researchers are more likely to have funding to head to the field to take measurements themselves.
“But that also means that a large proportion of the surface of our planet is so understudied,” Rumpf said. “And [to remedy] that, remote sensing data [are] really amazing because you can get a truly global picture, even though there’s nobody, or too few people, observing things in the field.”
Tree Lines Aren’t Living up to Their Potential
So the team set out to take a more global look. They used a world mountain map, developed in 2018, with a 250-meter resolution. They did exclude some regions from their analysis: cells with less than 10% high-mountain coverage (which have so few trees that they don’t have much of a tree line) and cells more than 95% covered with trees (which have so many trees that they don’t have much of a tree line). For their purposes, the team defined the “observed tree line” as the upper limit of trees that stand 3 meters or taller.
Then, said Rumpf, they used a model to calculate the potential tree lines for each area, because, thanks to human effects on the environment, “where these trees could be surviving is almost always higher than where the trees are currently.” The model looked at the growing season length and mean growing season temperature for each cell in the map’s grid. The researchers determined that if a cell had a growing season length of 94 days or longer, and an average growing season temperature of 6.4°C or higher, it could potentially host trees. Cells that didn’t meet both criteria were considered unable to be covered in forest, and thus above the potential tree line.
With this model, “you can calculate based on climatic data where trees could potentially occur or not occur, even though they might not be there in the field,” Rumpf said. “It’s actually super simple. And that’s the beauty of it.”
Credit: Sabine Rumpf, University of Basel
Jordon Tourville, a terrestrial ecologist with the Appalachian Mountain Club, said the overall findings are not surprising, because other studies have shown seemingly “paradoxical downslope shifts in some cases.” But he noted that whereas this study estimated potential tree lines based on temperature constraints, some scientists have suggested that factors such as nutrient availability and wind exposure are also important in determining tree line position.
Unsurprising, on Second Thought
In areas with more human disturbance, the upward spread of trees is suppressed, or even reversed.
Armed with this information about observed versus potential tree lines, the researchers hypothesized that areas with the smallest deviation between the two were mostly responding to climatic factors. In contrast, they speculated, areas with a greater difference between observed and potential tree lines were likely experiencing more anthropogenic disturbance, such as logging, agriculture, and infrastructure development.
Their hypothesis held up. In areas with less human disturbance, tree lines were moving upward more quickly (the researchers noted, though, that the upward migration of tree lines lagged behind the rate of climate change). In areas with more human disturbance, the upward spread of trees is suppressed, or even reversed.
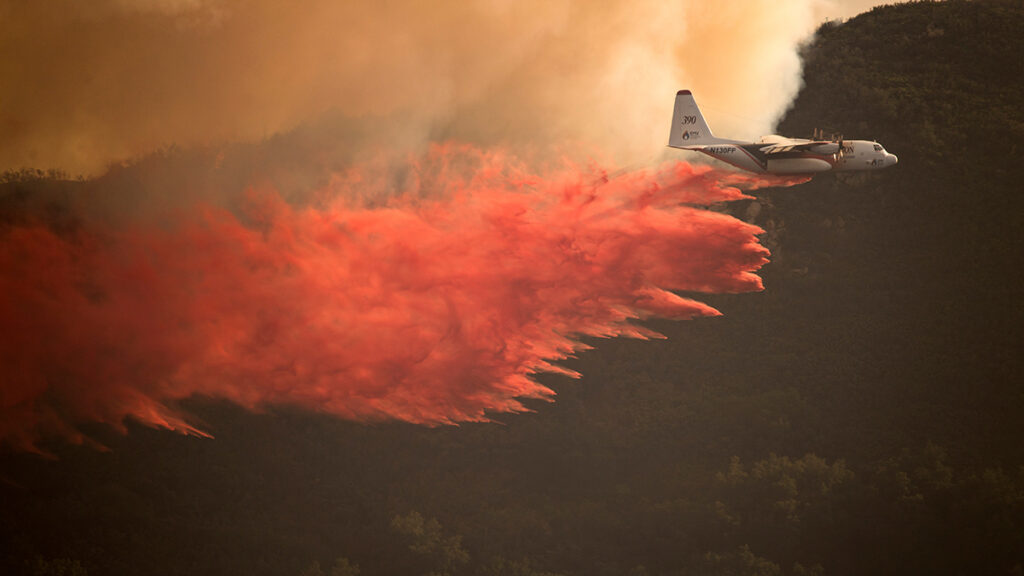
Fire played a big role in tree line shifts as well: The researchers found that 38% of the downslope shifts were linked to fire events. Wildfires played a particularly big role in western North America and Alaska.
Wildfires played a particularly large role in the downward shift of tree lines in western North America. Here, a tree line is visible in California’s Little Lakes Valley. Credit: mlhradio/Flickr, CC BY-NC 2.0
Rumpf and several of her colleagues are located in the Alps, where glaciers are retreating, tree lines are climbing, and towns are generally more threatened by mudslides than by wildfires.
Some of the study’s findings, like a quarter of tree lines shifting down, or such a clear signal from wildfires in some areas, were at first unexpected. But after some reflection, Rumpf realized the diversity of data was a perfect example of why global-scale research is important.
“A lot of scientific funding is based in North America and Europe,” Rumpf said, which means many studies return similar results. “Then we do something global and we are surprised that things are different somewhere else on the globe?… I mean, well, duh.”
This news article is included in our ENGAGE resource for educators seeking science news for their classroom lessons. Browse all ENGAGE articles, and share with your fellow educators how you integrated the article into an activity in the comments section below.
Citation: Gardner, E. (2026), Tree lines are migrating. Some up, some down., Eos, 107, https://doi.org/10.1029/2026EO260146. Published on 12 May 2026.
The rest of the world is building solar farms and battery plants as fast as the supply chains allow. The United States is trying to run against a market it no longer controls. | Ritesh Shukla/Getty Images
This story was originally published in The Highlight, Vox’s member-exclusive magazine. To get access to member-exclusive stories every month, become a Vox Member today.
For more than a century, the world has run on coal.
When Thomas Edison’s Pearl Street electrical station in Lower Ma
The rest of the world is building solar farms and battery plants as fast as the supply chains allow. The United States is trying to run against a market it no longer controls. | Ritesh Shukla/Getty Images
This story was originally published in The Highlight, Vox’s member-exclusive magazine. To get access to member-exclusive stories every month, become a Vox Member today.
For more than a century, the world has run on coal.
When Thomas Edison’s Pearl Street electrical station in Lower Manhattan fired up in 1882, it ran on coal. Coal survived the oil era, the nuclear era, the dash for natural gas, and decades of back-and-forth climate policy. From the 1970s through the mid-2010s, coal supplied somewhere between 35 and 40 percent of the planet’s electricity, a steady if sooty presence powering modern life.
Then last year, it lost the lead. According to Ember’s Global Electricity Review 2026, recently released in time for Earth Day, renewable sources produced 33.8 percent of the world’s electricity last year, compared to 33 percent for coal. It was the first time those two lines had crossed since 1919, when the global grid was still small enough to run mostly on hydropower.
As coal has declined — at least on a relative basis — the sun has risen. When the Paris climate agreement was signed in 2015, solar produced just 256 terawatt hours of electricity globally. Nuclear power plants, at the time, were pumping out about 10 times that, while wind was responsible for three times as much electricity as solar.
A decade later, solar is producing 10 times more power: 2,778 TWh, roughly what the entire European Union consumes in a year. Its production has doubled in the past three years alone. For 21 years running, solar has been the fastest-growing source of electricity on the planet. In 2025 it surpassed wind for the first time, and is now on pace to pass nuclear this year.
While the world still burns a huge amount of coal — some 8.8 billion tonnes in 2024, according to the International Energy Agency (IEA) — solar alone covered 75 percent of the rise in global electricity demand. Put wind and solar together, and you’ve met 99 percent of it. Fossil fuel power generation — coal, oil, and gas combined — fell 0.2 percent in 2025, the first decline since the pandemic and only the fifth year this century that fossil generation didn’t rise.
Clean sources are now growing fast enough, on their own, to absorb just about everything the world is adding to its grid. And there’s a decent chance that, thanks in part to what’s happening right now in the Middle East, that transition may speed up.
Why solar is no fluke
It all starts with cost.
Solar module prices have fallen roughly 75 percent every decade for more than 40 years, a pattern so durable it has its own name, Swanson’s law, the observation that the price tends to drop by 20 percent every time the total number of solar panels ever built doubles. This rule has held through supply gluts, trade wars, and pandemics. In the mid-1970s, a solar module cost more than $100 per watt. In late 2025, one panel cost about 10 cents per watt. No other major energy source in modern history has gotten that cheaper, that fast.
The oldest objection to solar — that it goes dark when the sun goes down — is becoming obsolete because we can increasingly store the daytime electricity solar units generate. Battery costs dropped 20 percent in 2024 and another 45 percent in 2025. Global battery deployment grew 46 percent last year, to 250 gigawatt-hours. Solar plants built with enough batteries to deliver power round the clock now sell electricity in the US for around $76 per megawatt hour, cheaper than building new natural gas capacity.
The China story
The world’s long-time manufacturing powerhouse — China — has made this shift possible. Chinese factories now make around 80 percent of the world’s solar panels and an even larger share of the polysilicon, wafers, and cells that feed into them, a dominance built over two decades of state-backed investment, enormous scale, and ferocious price competition. The result is the cheapest energy technology in human history, produced at a pace the rest of the world has not matched.
Chinese dominance has also made clean power a geopolitical story: tariffs, trade disputes, arguments in Washington and Brussels about whether to build parallel supply chains. For the climate, though, the math is simple. Cheap panels built anywhere cut emissions everywhere.
The demand side has moved too. For most of the last two decades, the global coal story has been a Chinese story. When China’s electricity demand surged, so did coal. When it slackened, so did coal. That relationship cracked in 2025: China’s fossil generation fell 0.9 percent, its first decline since 2015, even as the country’s electricity demand rose 5 percent. India’s fossil fuel generation fell as well, by 3.3 percent, while its renewables grew 24 percent year over year. In both cases, new clean energy capacity outran new demand. Ember found that renewables in China now produce more electricity than every household and service-sector business in the country, combined.
Don’t get carried away — yet
A flat year for coal is not the same as a falling one. Power-sector emissions in 2025 were still close — within a rounding error — of 2024’s levels, which set a record high. In its report, Ember calls this moment “the era of clean growth,” which should be understood as the start of real decarbonization, rather than a final state of decarbonization.
Coal’s share is shrinking — from a peak of 41 percent of global generation in 2013 to 33 percent today — but the fleet itself isn’t going away. China approved more than 40 gigawatts of new coal capacity in just the first three quarters of 2025. Thanks to growth in renewables, these plants are increasingly becoming a backup source, rather than a primary one. But those plants exist, they burn coal when they run, and they’ll burn coal for years.
Then there is the US. The Trump administration’s One Big Beautiful Bill Act ended the residential solar tax credit in December and tightened eligibility for commercial projects. Rhodium Group, a research institute, projects the law will cut US clean-capacity additions through 2035 by more than half. America is in danger of getting left behind.
That sounds bad, and in the short run it is. But policy can slow a market; it has a harder time stopping one when the economics have already shifted. BloombergNEF reported that global energy-transition investment hit a record $2.3 trillion in 2025, up 8 percent from 2024. China alone put roughly $800 billion into clean energy last year; India’s clean-energy spending climbed 15 percent to about $68 billion; the EU has been accelerating renewables spending ever since Russia’s invasion of Ukraine cut its pipeline gas. Even if Washington slows down, the rest of the world is building solar farms and battery plants as fast as the supply chains allow. The US is trying to run against a market it no longer controls.
There is, however, the AI wild card. The IEA estimates global data-center electricity use rose 17 percent in 2025, with AI-specific demand growing faster. In the US, gas is currently the biggest single source of new data-center supply. Artificial intelligence is the one uncontrolled variable that could swamp clean-power gains in the back half of this decade.
Strait talk
The last big oil shock rewrote the global energy system. After the 1973 OPEC embargo, President Jimmy Carter put solar panels on the White House, founded the Solar Energy Research Institute in Golden, Colorado, and signed the country’s first appliance efficiency standards into law. Ronald Reagan undid much of that work, but the seed technologies — photovoltaic R&D, efficiency standards, CAFE rules for cars — kept developing in the background for decades.
The response has been exactly what cheap clean power makes possible. In March, global solar generation grew 14 percent year over year and wind grew 8 percent; solar alone saved European buyers some $3.5 billion in gas costs for the month. Countries that might have responded to an oil crisis in 2006 by drilling faster are instead moving up construction for solar farms, offshore wind, and grid-scale storage. Where the 1970s planted seeds that took 40 years to sprout, 2026’s shock is meeting an industry already at commercial scale.
The climate case for clean power has always rested on a simple bet: that the technologies would keep getting cheaper faster than the politics got worse. Today, solar is the fastest-growing source of electricity in the history of electricity, while coal looks to be on a terminal decline. Batteries are starting to make it a 24-hour fuel. What comes next is a question of speed — and speed, mostly, is a question of choice.
A version of this story originally appeared in the Good News newsletter. Sign up here!
Source: Earth’s Future
Hotter, drier conditions in the western United States have led to a rise in wildfire activity that has damaged or destroyed infrastructure, natural ecosystems, and entire towns across the region. As fires grow larger and more destructive, the cost of managing them rises as well.
Fire management agencies in the United States have been feeling the pressure. Between 2014 and 2023, fire management agencies across all levels of government experienced a 131% increase in t
Hotter, drier conditions in the western United States have led to a rise in wildfire activity that has damaged or destroyed infrastructure, natural ecosystems, and entire towns across the region. As fires grow larger and more destructive, the cost of managing them rises as well.
Fire management agencies in the United States have been feeling the pressure. Between 2014 and 2023, fire management agencies across all levels of government experienced a 131% increase in total area burned and a 268% increase in total fire spending adjusted for inflation compared to the period between 1985 and 1994.
Today, federal agencies like the Department of the Interior (DOI) and the U.S. Department of Agriculture Forest Service (USFS) continue to invest in aiding states and managing hazardous fuel growth on public land, as well as suppressing active fires. Policymakers and federal agencies alike must decide how to manage limited budgets while protecting people, property, and natural resources.
Prestemon et al. built statistical models based on historical data to examine the potential increase in spending by the DOI and the USFS between now and 2100. Their models link wildfire activity to climate variables such as temperature and water vapor deficit and then connect fire activity to suppression costs. To capture a range of possible future conditions on federal lands, the study predicts 10 fire and suppression spending scenarios by applying five different climate models to two different warming pathways (the moderate Representative Concentration Pathways (RCP) 4.5 scenario and the high-emissions RCP 8.5 scenario).
The results varied by region and scenario, but each of the 10 scenarios suggested a rise in area burned as well as inflation-adjusted fire suppression spending, with higher fire activity translating to higher costs. Projected changes in DOI and USFS land burned increased 80% by mid-century and 208% by late century.
By the middle of the century, both agencies are projected to see spending increases: about 0.65% per year for DOI spending and about 0.87% per year for USFS spending from 2020 to 2100. Although uncertainty increased with time and outcomes varied across climate models and warming pathways, the largest increases in both cost and wildfire activity were consistently projected for the northwestern United States. (Earth’s Future, https://doi.org/10.1029/2025EF007985, 2026).
Citation: Owen, R. (2026), As wildfires increase in the West, so does suppression spending, Eos, 107, https://doi.org/10.1029/2026EO260187. Published on 10 June 2026.