Reading view

The Forensics of a Skyscraper-Sized Tsunami

A photo shows a mountainside with a large wedge of lighter-colored rock, above a churning channel of water. The foot of a glacier can be seen at the lower edge of the image.

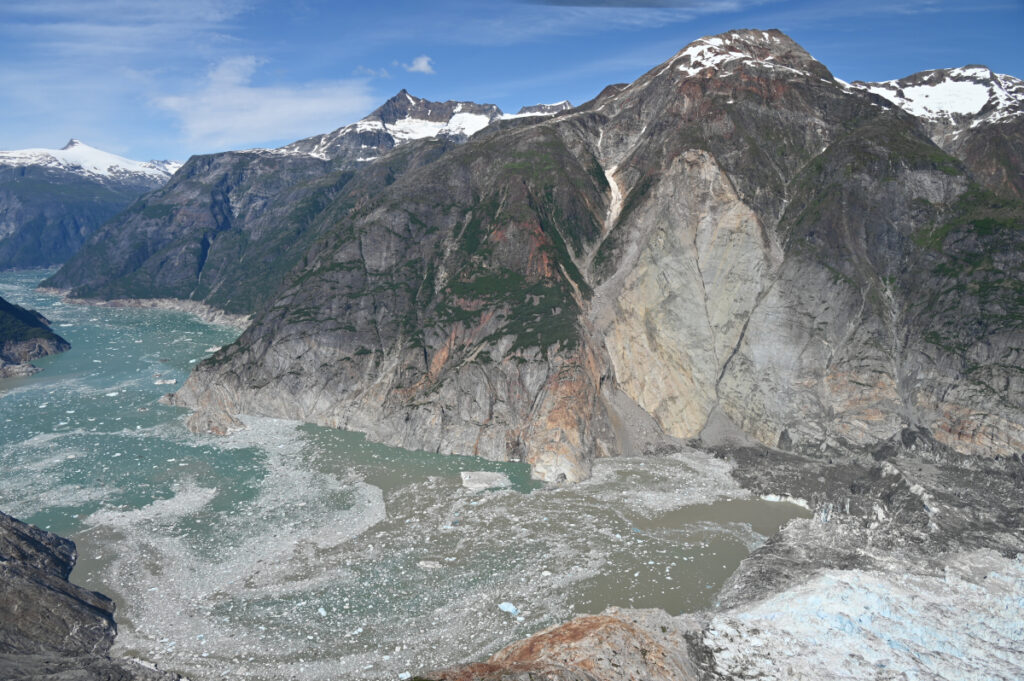
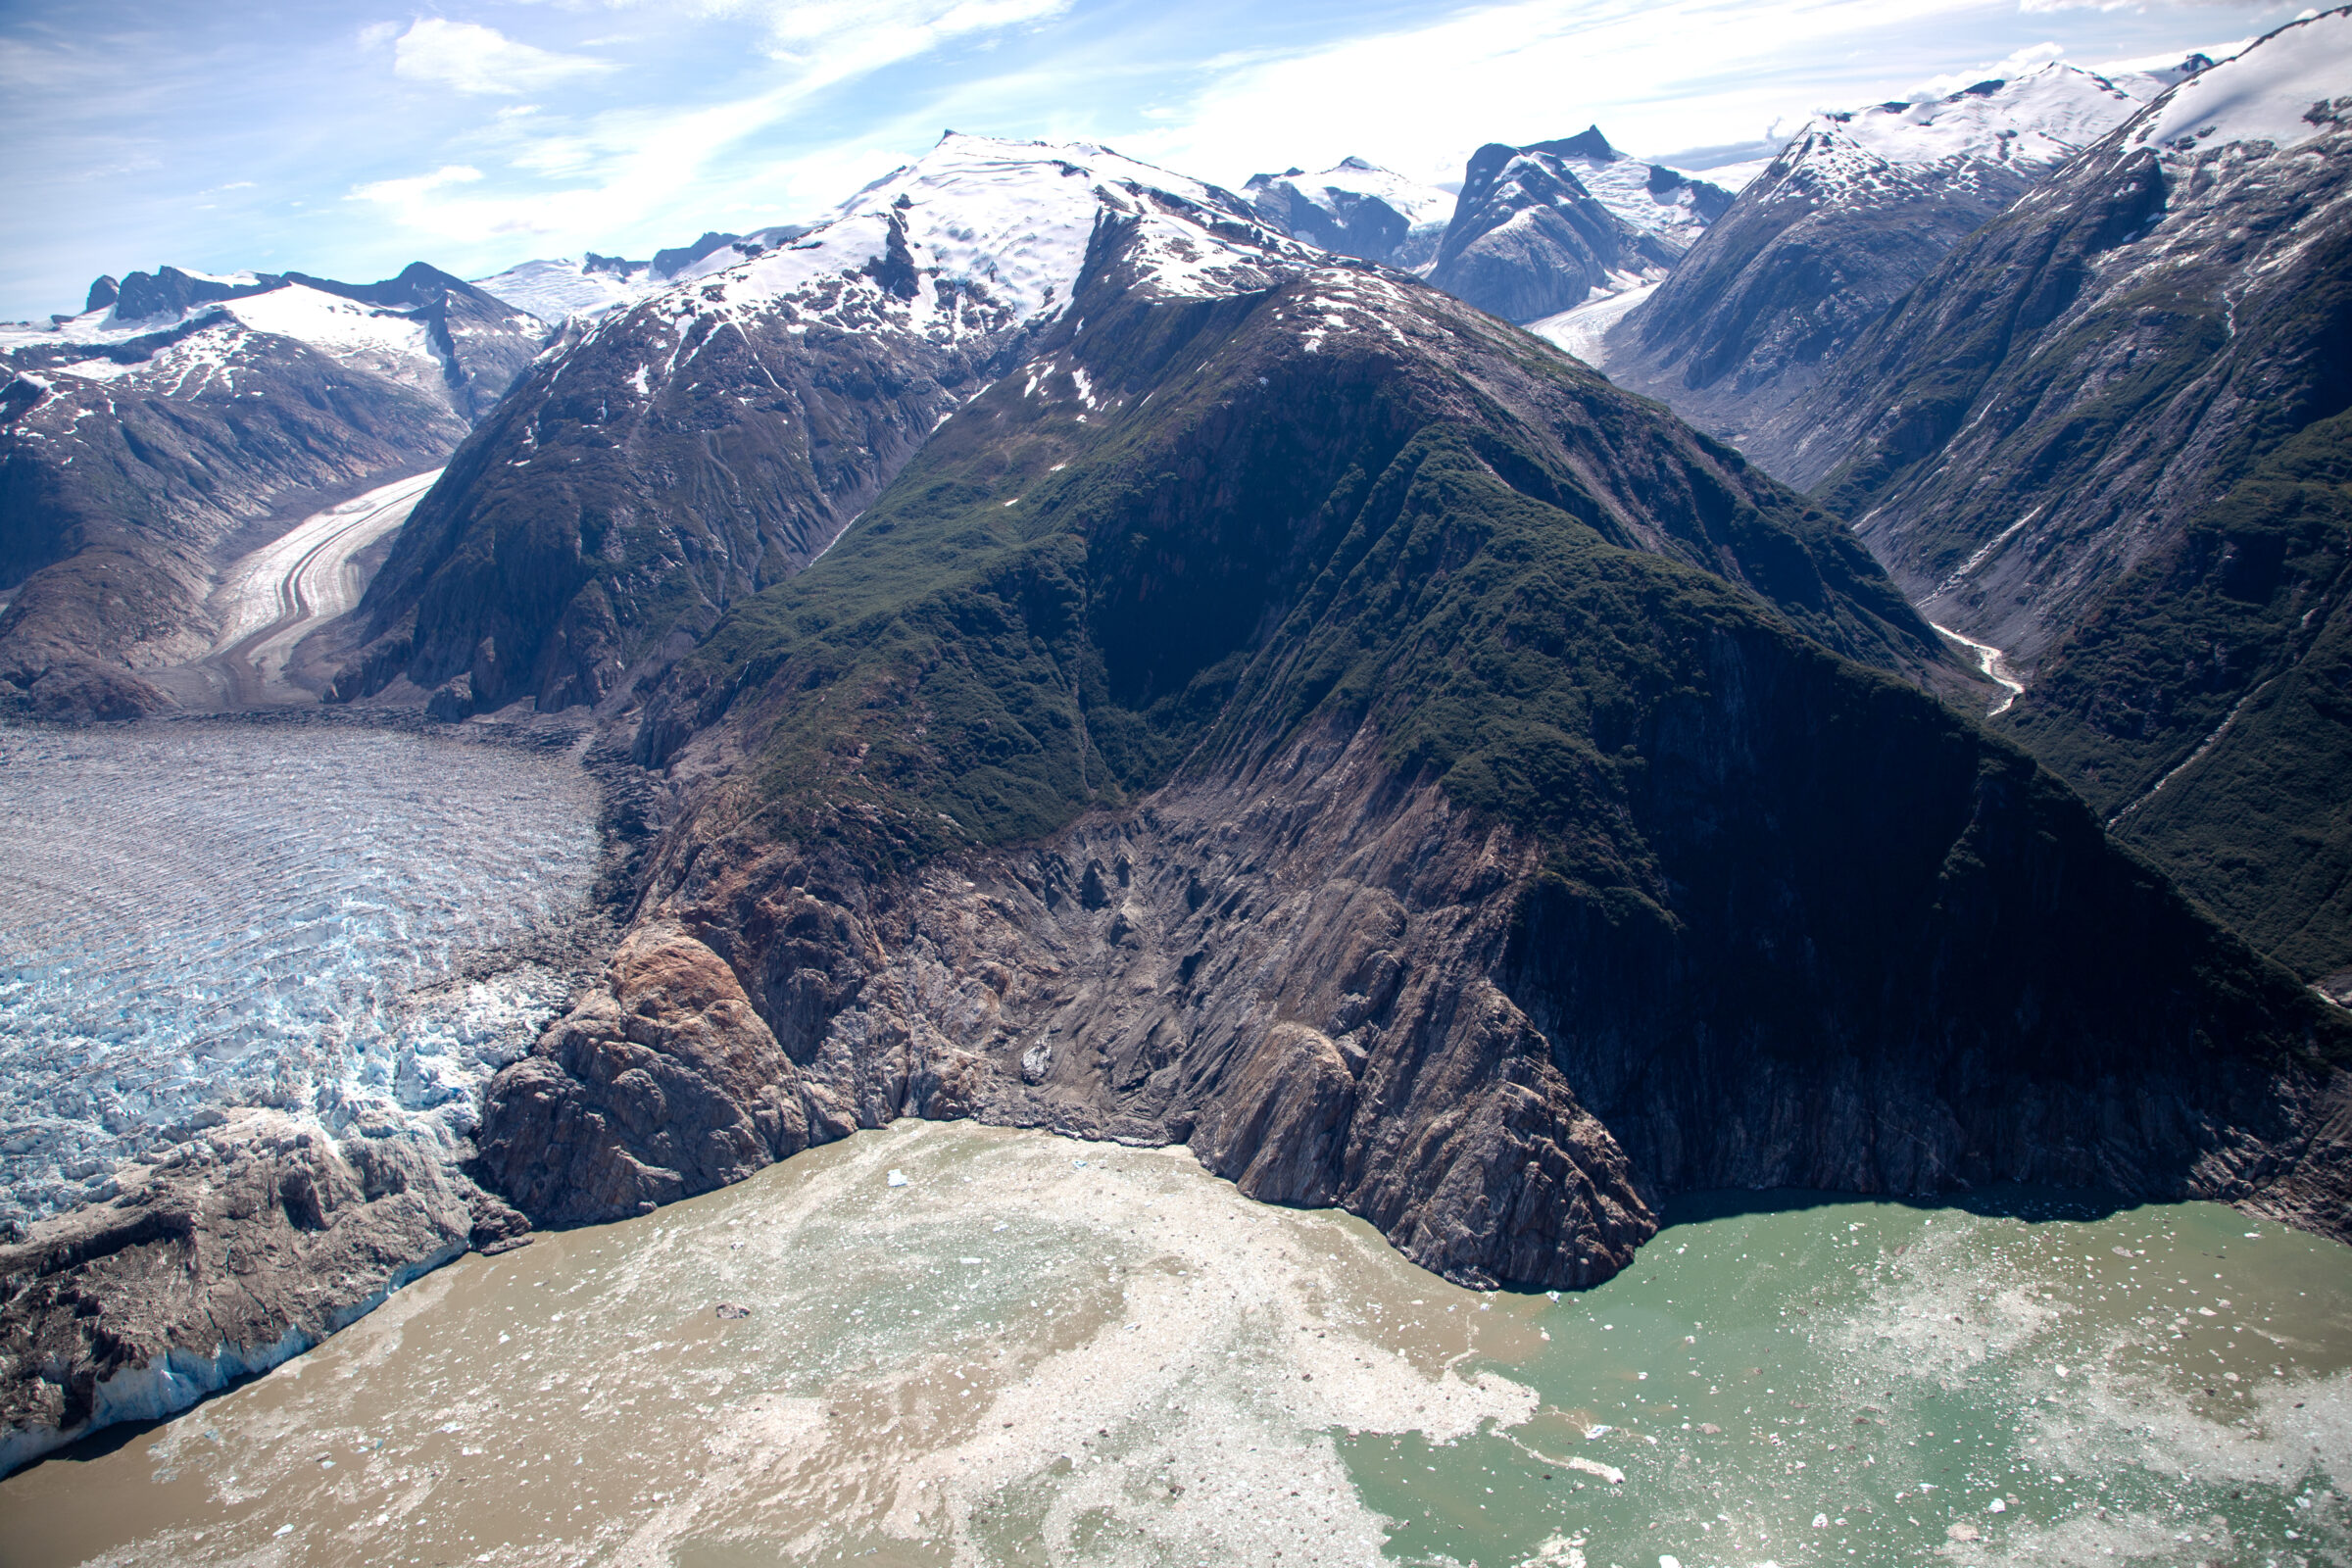
In the early morning of 10 August 2025, a mountainside collapsed into the waters of Tracy Arm Fjord in southeastern Alaska.

This massive landslide produced a tsunami that reached 481 meters on the opposite side of the fjord—higher than all but the world’s 14 tallest buildings—and registered on seismic detectors around the globe. For days after the slope collapsed, the waters of the fjord churned with a standing wave known as a seiche.

This drone video shows a man paddling through the iceberg-filled Tracy arm fjord in the aftermath of a landslide. Credit: Bill Billmeier

This event was the second-largest tsunami ever recorded and the largest not linked to an earthquake. A new paper published in Science presented strong evidence that the Tracy Arm landslide was instead the result of the rapid retreat of South Sawyer Glacier, itself a consequence of global climate change.

“It’s like if you have a kid and they said they cleaned their room but really all they did was throw everything in the closet. As soon as you open that door, everything falls out.”

Nobody was harmed by the rockslide or tsunami, but cruise ships were scheduled to visit the fjord later that morning. If the collapse had happened just a few hours later, it could have been disastrous.

“While the [South Sawyer] Glacier is in the fjord, it’s supporting those valley walls, like the buttresses on a cathedral,” said Daniel Shugar, a geomorphologist at the University of Calgary who led the study. “As that glacier retreated over the last few decades, it retreated just past the spot that did fail. It’s like if you have a kid and they said they cleaned their room but really all they did was throw everything in the closet. As soon as you open that door, everything falls out.”

This animation shows an overhead view of the 10 August 2025 Tracy Arm landslide. Credit: Patrick Lynett, University of Southern California

In other words, the glacier that carved the fjord in the first place was also holding its slopes in place, and the ice’s retreat under warming temperatures exposed rock that became vulnerable to crumbling. The proximate cause of the landslide might have been something else—as Shugar noted, rainfall is plentiful in that part of Alaska, which could have weakened the fjord’s walls further—but it might also have been a combination of small, individually insignificant factors. In any case, the removal of that glacial “closet door” was what made the collapse and tsunami possible.

“We know that steep slopes are very sensitive to the things that climate [change] is exacerbating, whether it’s losing permafrost, glacier retreating, or more water in the soil,” said glaciologist Leigh Stearns of the University of Pennsylvania, who was not involved with the Tracy Arm study. “Often, we think of glacier retreat as a long and continuous thing, but [it] can trigger sudden catastrophic events.”

This aerial photo shows the highest run-up resulting from the 10 August 2025 landslide-triggered tsunami in Tracy Arm. It was captured during a U.S. Geological Survey field reconnaissance overflight on 13 August 2025. Credit: John Lyons/U.S. Geological Survey.

The researchers shared their findings at a press briefing on Wednesday at the European Geosciences Union 2026 General Assembly.

Debuttressing and Slope Instability

The Tracy Arm tsunami, like the record-setting Lituya Bay 524-meter megatsunami in 1958, was so dramatic in part because it happened in a fjord. The steep sides of the relatively narrow channel concentrated the energy generated by the rockfall into water.

A drone video shows the tsunami-affected part of the fjord, including the highest run-up area and the landslide itself. Credit: Bill Billmeier

Unlike Lituya Bay, which resulted from an earthquake, Tracy Arm provided very little seismic warning before the slope collapsed, requiring forensic work to determine what caused it.

Shugar noted that South Sawyer Glacier had retreated by roughly 500 meters in the spring of 2025 alone, on top of the general trend of shrinking and thinning over the decades. And it’s not alone: Interferometric synthetic aperture radar (InSAR) images taken by satellites indicate that many slopes in Alaska and beyond are in motion, pointing to potential future danger.

“Not every single one, but it seems like a huge majority of [shifting slopes] are above the lower parts of thinning glaciers,” Shugar said. He described this phenomenon as “debuttressing,” as in losing the glacial buttress holding a slope up. He added, “I think in the next 5 years or so, we’ll probably have a much better understanding of just how and how quickly slopes respond to that debuttressing.”

Threats, Hazards, and Climate Change

“We were unbelievably lucky that the [tsunami] occurred with the timing that it did, and not 5 hours later.”

Most tsunamis are set in motion by earthquakes and travel across the open ocean, wreaking their destruction when they reach shallower water near coasts; the word “tsunami” means “harbor wave” in Japanese. The Tracy Arm tsunami joined the ranks of other landslide-driven tsunamis, like the ones in Taan Fiord (Alaska) and Dixon Fjord (Greenland), in being linked to human-driven climate change. Beyond the immediate impact of the waves, this category of hazard requires rethinking potential risks from abrupt catastrophes like debuttressing as well as slower effects such as sea level rise.

“The risk to any particular cruise ship [from a tsunami] on any particular day is very low,” Shugar said. “We were unbelievably lucky that the [tsunami] occurred with the timing that it did, and not 5 hours later. The risk certainly still could be increasing as we build new settlements, new mining camps, or new oil and gas infrastructure.”

Both Shugar and Stearns highlighted the importance of learning lessons from Tracy Arm and related events.

“Climate is a threat multiplier, and the research is really forcing us to look at these cascading hazards,” Stearns said. Tracy Arm “is one example of this: Small slow changes can trigger big events. Hopefully, we don’t need so many disasters to spur some change.”

A drone video shows Sawyer Island in the Tracy Arm Fjord and evidence of the tsunami on the fjord walls. Credit: Bill Billmeier

—Matthew R. Francis (@BowlerHatScience.org), Science Writer

Citation: Francis, M. R. (2026), The forensics of a skyscraper-sized tsunami, Eos, 107, https://doi.org/10.1029/2026EO260140. Published on 6 May 2026.
Text © 2026. The authors. CC BY-NC-ND 3.0
Except where otherwise noted, images are subject to copyright. Any reuse without express permission from the copyright owner is prohibited.

💾

This aerial photo shows the north side of Alaska’s Tracy Arm Fjord in the aftermath of the 2025 landslide and tsunami. The lighter-colored rock is the exposed surface, where the mountainside collapsed and fell into the water. The foot of South Sawyer Glacier is visible at lower right; in decades past, the ice extended much farther and was thick enough to hold the rock slopes in place. Credit: Cyrus Read/U.S. Geological Survey
  •  

Fatalities from landslides in earthquakes

An earthquake triggered landslide from the 2008 Wenchuan earthquake.

A new study (Sun et al. 2026) shows that in six earthquakes in China between 2010 and 2022, landslides and rockfalls were responsible for at least half of the total fatalities.

Image of a landslide partially covered with a transparent sand-colored overlay and the words “The Landslide Blog,” centered, in white

It is well-established that landslides are a major cause of loss of life in earthquakes in mountainous areas. The seismology maxim that “it is not earthquakes that kill people, it’s collapsing buildings” does not apply in its pure form in mountains – landslides also kill large numbers of people.

An earthquake triggered landslide from the 2008 Wenchuan earthquake.

However, the actual number of people killed by landslides in earthquakes is poorly understood. This is largely due to the challenges of collecting reliable information in the aftermath of a major earthquake, when the focus is on rescue and recovery rather than data collection. For this reason, many studies of landslide fatalities do not include seismically-triggered events. This is true of my own work.

However, a study has just been published (Sun et al. 2026) in the journal Natural Hazards Review that starts to address this issue. The paper nominally examines fatalities from all causes from earthquakes in China from 2001 to 2022. However, the authors note that the data has low reliability until 2010, so I’ll focus on the period from 2010 to 2022. I also note that the authors use the term “geological hazards“, which is a little broader than landslides. I should note that the paper isa broad look at fatalities from earthquakes – there is a much richer range of analyses than I will cover here.

In the period from 2010 to 2022, Sun et al. (2026) identified 14 earthquakes in which geological hazards caused loss of life. In some cases, the impacts were substantial. Thus, the M=6.5 3 August 2014 earthquake at Ludian in Yunnan led to 134 fatalities and 40 people missing from geological hazards from a total of 728 fatalities (c.24 % of the total), whilst the 5 September 2022 M=6.8 earthquake at Luding in Sichuan led to 76 geological hazard fatalities and 25 missing from a total of 118 fatalities (c.86% of the total). In six of the 14 examples, geological hazards caused at least 50% of the fatalities.

Sun et al. (2026) highlight that “fatalities from geological hazards concentrate in geologically complex, mountainous provinces, i.e., Sichuan, Yunnan, Gansu, Guangxi, and Guizhou”. They note that even small events can trigger fatal landslides – for example, six people were killed in a rockfall triggered by a M=4.3 earthquake in Guizhou in 2010, whilst a M=2.8 aftershock from the Yanjin earthquake in 2006 triggered a rockfall that killed a person.

This is an incredibly useful study. It starts to shed light on the impact of landslides in large earthquakes. It is not the definitive study, and questions remain – not least, the pattern of landslide losses in very large earthquakes, like the 2010 Wenchuan event, in which landslides were ferocious. But it forms the basis for such investigations, starting to fill a major gaps in our understanding.

Reference

Sun, B. et al. 2026. Causes Analysis of Earthquake-Related Deaths in Mainland China 2001–2022. Natural Hazards Review, 27 [2]. https://doi-org.ntu.idm.oclc.org/10.1061/NHREFO.NHENG-2458

Text © 2026. The authors. CC BY-NC-ND 3.0
Except where otherwise noted, images are subject to copyright. Any reuse without express permission from the copyright owner is prohibited.
  •  

Reports of landslides triggered by the 8 June 2026 M=7.8 earthquake offshore Mindanao in the Philippines

A failure in a coastal cliff at Sitio Buhangin, Barangay Patuco, Sarangani following the 8 June 2026 earthquake near Mindanao.

To date news reports suggest two fatal landslides with a combined toll of 17 people.

Image of a landslide partially covered with a transparent sand-colored overlay and the words “The Landslide Blog,” centered, in white

There are various news reports trickling in about the landslides triggered by the 8 June 2026 M=7.8 earthquake offshore Mindanao in the Philippines. As usual, the remote locations of many of the landslides means that the information is a bit hit and miss at this point.

To date, the most serious event appears to have occurred at a community called New Aklan, located in Glan, Sarangani. It appears that New Aklan is at: [5.7705 N, 125.3356]. News reports indicate that 13 people were killed, although there are also indications of additional fatalities in this area.

A further four people are missing under a landslide at Sitio Buhangin, Barangay Patuco, Sarangani. Patuco is in the area of [5.4770, 125.4859]. This appears to have been a failure on a coastal cliff:-

A failure in a coastal cliff at Sitio Buhangin, Barangay Patuco, Sarangani following the 8 June 2026 earthquake near Mindanao.
A failure in a coastal cliff at Sitio Buhangin, Barangay Patuco, Sarangani following the 8 June 2026 earthquake near Mindanao. Image tweeted by Radyo Pilipinas.

Over the next few days, satellite imagery should become available that will help identify the landslide impacts, but in the meantime Dan Shugar has identified some (using Planet imagery, I’d imagine):-

Text © 2026. The authors. CC BY-NC-ND 3.0
Except where otherwise noted, images are subject to copyright. Any reuse without express permission from the copyright owner is prohibited.
  •  

Do Bare Feet of a Gorilla slides really make your legs slimmer?

These bizarre sandals have gone viral on Japanese social media, so we put them to the test.

If you’re interested in Japan, your timeline and explore pages are likely filled with photos and videos of influencers promoting the country’s latest finds. A lot of the time, though, these influencers miss the true hidden gems that circulate on Japanese social media, and right now there’s one product that locals are raving about: Bare Feet of a Gorilla.

Produced by Osaka-based company Doshisha, as part of its Gorilla Series of quirky lifestyle products, Bare Feet of a Gorilla are acupressure sandals designed to provide a pleasant stimulation to the soles of the feet every time you walk in them.

Ever since their release in late April, users have been heaping praise on the sandals, adoring them not only for their cute similarities to a cloud, but the effect they have on the feet and legs.

▼ Look closer and you’ll find hidden gorillas within the puffy surface of each sandal.

According to Doshisha, these slides were created in response to the growing popularity of so-called “recovery sandals”, which are particularly popular with young people in summer to relieve tired legs. The pleasant stimulation provided by the puffy surface, and the gorillas hidden within them, are said to combat swelling in the legs, an assertion backed by many users of the product, who say their legs look slimmer after wearing them.

From our experience, acupressure sandals tend to have a breaking-in period, where you have to put up with a certain amount of pain before getting used to the stimulation on the soles of your feet. However, when we slid into the Bare Feet of a Gorilla, we were surprised to find that we barely felt any pain.

Although there was a feeling of unevenness, the sensation was soft on the feet, thanks to the EVA material, which had excellent give. The stimulation was moderate, and after just a short period we felt the sluggishness disappear from our legs.

They were wonderfully lightweight, making them very easy to walk in, and we were able to walk about the house for a couple of hours while doing chores before we felt it was time to step out of them. They’re comfortable enough that you could even wear them when ducking out to a nearby convenience store, but they do have an acupressure effect that’s hard on the feet after an extended period of time.

As for the slimming effect, well, we didn’t notice any differences there, but they did help to stimulate the soles of the feet and they also reduced fatigue so they certainly delivered on that promise.

They do look fantatstic, though, and will definitely turn the heads of passersby if you go out in them. Available in black, grey, white, and mint green, the slides come in small, medium and large sizes (22-23 centimetres [8.7–9.1 inches],  23-24 centimetres, and 24-25 centimetres respectively). They can be purchased at Don Quijote stores and affiliated retail chains like Apita and Piago nationwide, priced at 2,189 yen (US$13.76).

Related: Doshisha, Don Quijote
Images ©SoraNews24

● Want to hear about SoraNews24’s latest articles as soon as they’re published? Follow us on Facebook and Twitter!

  •  

The Cheekeye Debris Barrier Project

A render of the completed Cheekeye Debris Barrier.

In British Columbia a CAN$115 million project is almost complete to mitigate the risk posed by debris flows to the town of Squamish.

Image of a landslide partially covered with a transparent sand-colored overlay and the words “The Landslide Blog,” centered, in white

Upstream of the town of Squamish in British Columbia, Canada, an extraordinary project is underway to mitigate the risk of debris flows. Known as the Cheekeye Debris Barrier Project, the scheme involves the construction of a concrete barrier that is 24 metres high across the Cheekeye Fan, designed to catch debris flows with a volume up to 2.4 million cubic metres of debris.

The project is almost complete, with hand-over expected in the summer of this year. There is an excellent article about the project on The Tyee website, which includes some very interesting images of the structure. The estimated cost of the project is around CAN$115 million. The location of the Cheekeye Debris Barrier Project is [49.79417, 1123.10878]. This is a render of the final form of the barrier (but take a look at the images of the almost completed structure too):

A render of the completed Cheekeye Debris Barrier.
A render of the completed Cheekeye Debris Barrier. Image via the District of Squamish.

This is a fascinating project that makes a great case study for teaching, not least because both the detailed design considerations and the regulatory process for approving the programme are available in detail.

In terms of the detailed design considerations, there is an excellent open access paper in the Canadian Geotechnical Journal (Lesueur et al. 2025) that provides a very comprehensive analysis of the estimation of the potential volume and mobility of the debris flows on the Cheekeye Fan, and of the considerations that went into the final deisign of the structure.

In terms of the approval process, the District of Squamish has an online archive of documents and Council minutes that extends back to 2003.

I would highlight the challenges around determining the optimal size of a barrier of this type. The team has been balancing risk against cost, following the principle as outlined in Lesueur et al. (2025):-

“The local government specifies that tolerable debris-flow risks be reduced “as low as reasonably practicable” (ALARP), defined in this project as the point where the cost of additional mitigation measures is grossly disproportionate to the benefits gained.”

Thus, the barrier is not designed to stop the maximum credible debris flow, which is 5.5 million cubic metres (more than double the design event). This is pragmatic engineering at its best, and the Cheekeye Debris Barrier Project provides the level of detail that allows the decision-making process to be fully understood.

Reference

LeSueur, P. et al. 2026. Risk-informed design of debris-flow mitigation at Cheekeye FanCanadian Geotechnical Journal62: 1-16. https://doi.org/10.1139/cgj-2023-0008

Text © 2026. The authors. CC BY-NC-ND 3.0
Except where otherwise noted, images are subject to copyright. Any reuse without express permission from the copyright owner is prohibited.
  •  

“Near-miss” Tsunami in Alaskan Cruise Area Offers Lessons for Steep Landscapes Near Glaciers

As glaciers retreat in warming regions, the risk of related hazards can increase, and improved monitoring may help reduce some of those dangers, according to a new study.

  •  

How Wildfires Worsen Flood Risk

A rocky stream flows through a landscape of burned trees. A mountain is visible in the background.
Source: Water Resources Research

Wildfires can increase flooding risks in and downstream of burned areas by removing vegetation and disturbing hydrologic processes. As the climate changes, the severity of both wildfires and heavy rainfall events is increasing, meaning flooding is likely to become more severe in the near future. Better understanding how, and by how much, wildfires change flood risk is important for disaster and infrastructure planning for communities around the country.

Canham and Lane used streamflow data from the U.S. Geological Survey’s National Water Information System and precipitation data from the NOAA Analysis of Record for Calibration product to identify storms and quantify their effects across seven burned watersheds in the western United States.

To make the most of the limited data on flooding in the years following wildfires, the researchers created a paired-storms framework: They identified postfire peak flows (PFPFs), defined as the five highest peak flows within 3 years of a wildfire across seven watersheds. Then, for each precipitation event causing a PFPF, they looked for storms with similar characteristics (or paired storms) that occurred before the wildfire. Storm characteristics used for pairing included the season in which the storm occurred, recent precipitation, and precipitation depth, duration, and peak intensity.

The researchers found significantly elevated peak flows after wildfires in many cases, underlining the risks to communities following wildfires and validating their approach for use elsewhere.

Altogether, the authors found 26 PFPF events, including 20 with paired storms occurring before wildfires. For 75% of the postfire storms, their peak flows were 2 or more times greater than prefire peak flows. PFPFs were most likely to happen in the first year after a wildfire and typically occurred following storms that were centered upstream of the watershed centroid, were uniform in shape, and fully covered the watershed and burned area, the authors reported. They also found some evidence that the first storm in the year immediately following a fire has a higher-than-expected chance of producing a PFPF.

Future work could look more deeply at the characteristics of storms occurring over burned areas, such as storm direction and watershed recovery, and could apply the automated methods to more burned watersheds and storm events to enhance the robustness of the work, the authors say. (Water Resources Research, https://doi.org/10.1029/2025WR040693, 2026)

—Nathaniel Scharping (@nathanielscharp), Science Writer

A photo of a telescope array appears in a circle over a field of blue along with the Eos logo and the following text: Support Eos’s mission to broadly share science news and research. Below the text is a darker blue button that reads “donate today.”
Citation: Scharping, N. (2026), How wildfires worsen flood risk, Eos, 107, https://doi.org/10.1029/2026EO260133. Published on 30 April 2026.
Text © 2026. AGU. CC BY-NC-ND 3.0
Except where otherwise noted, images are subject to copyright. Any reuse without express permission from the copyright owner is prohibited.
  •  

Potential landslides and liquefaction from the 8 June 2026 M=7.8 earthquake offshore Mindanao in the Philippines

Initial Pager map of landslide hazard from the 8 June 2026 earthquake offshore Mindanao in the Philippines.

Initial analyses suggest that the earthquake this morning has the potential to have triggered significant numbers of landslides and areas of liquefaction.

Image of a landslide partially covered with a transparent sand-colored overlay and the words “The Landslide Blog,” centered, in white

At the time of writing, the impacts of the M=7.8 earthquake that occurred offshore the south coast of Mindanao in the Philippines remain unclear. Initial reports in the local press suggest 15 fatalities so far, but as always it could be the case that there is no information from those areas most seriously impacted.

The USGS Pager site is the best source of information about potential landslide impacts, bearing in mind there is a high level of uncertainty. This estimates that the area exposed to landslides is at the high end of the “significant” scale and that the population exposed to landslides lies in the 1,000 to 10,000 people range. This is the Pager landslide hazard map:-

Initial Pager map of landslide hazard from the 8 June 2026 earthquake offshore Mindanao in the Philippines.
Initial Pager map of landslide hazard from the 8 June 2026 earthquake offshore Mindanao in the Philippines. Source: USGS.

The area with the highest level of landslide hazard is remote and rural, so we may not get good information from this area for a while.

The potential for liquefaction may be even more serious, with a broad swathe having a high level of hazard:-

Initial Pager map of liquefaction hazard from the 8 June 2026 earthquake offshore Mindanao in the Philippines. Source: USGS.

Past earthquakes have generated large liquefaction-related landslides on low angle slopes, with devastating effects. Hopefully, there won’t have been an event on this scale in Mindanao.

One final point to note is that the Philippines is just entering the typhoon season. Fortunately, Mindanao is sufficiently far south to be away from the main typhoon zone. However, these storms are so large that they can bring very heavy rainfall – see for example Typhoon Bopha in 2012. A similar event this year could have very significant consequences.

Text © 2026. The authors. CC BY-NC-ND 3.0
Except where otherwise noted, images are subject to copyright. Any reuse without express permission from the copyright owner is prohibited.
  •  

The 9 April 2026 landslide at Lamarain in Papua New Guinea

The landslide at Lamarain in Papua New Guinea

Ten people were killed in a large landslide in Papua New Guinea triggered by heavy rainfall associated with Tropical Cyclone Maila.

Image of a landslide partially covered with a transparent sand-colored overlay and the words “The Landslide Blog,” centered, in white

On 9 April 2026, a large landslide occurred at Lamarain in the Inland Baining LLG of Gazelle District in Papua New Guinea. The landslide was triggered by heavy rainfall associated with the passage of Tropical Cyclone Maila.

Media reports indicate that ten people were killed by the landslide and that a further 18 people were injured. Baining is located at [-4.2548, 151.7811], so I assume that this is the general area.

Gaining information about landslides in the remote areas of Papua New Guinea is very challenging – the terrain is rugged and there is a high level of civil turmoil. But the best source of information is on the Facebook page of NBC East Britain, which has posted a helicopter video of the aftermath. This is a still from that video:-

The landslide at Lamarain in Papua New Guinea
The landslide at Lamarain in Papua New Guinea. Still from a video posted to Facebook by NBC East New Britain.

There are several interesting aspects of this landslide. First, the failure appears to have initiated high on the hillslope in an area that has a mix of forestry and cleared areas. The source appear to be quite large and deep-seated. This has transitioned into a disrupted debris slide / avalanche with a substantial amount of entrainment.

Note also the multiple other landslides in that area, all fresh, suggesting that the intense rainfall was sufficient to drive widespread failures. It is interesting to note though that is event did not involve multiple shallow landslides that combined to create a channelised debris flow.

The Post Courier reports that the Lamerain landslide occurred in two phases, the first at 6 am on 9 April 2026 and the second 24 hours later. However, other reports suggest that it occurred on 12 April 2026, underlying the challenges of properly understanding landslides in Papua New Guinea.

Text © 2026. The authors. CC BY-NC-ND 3.0
Except where otherwise noted, images are subject to copyright. Any reuse without express permission from the copyright owner is prohibited.
  •  

The 19 July 2025 multiple landslide event in Sancheong, South Korea

Planet Labs image of a part of the area affected by landslides during heavy rainfall in Sancheong County, South Korea on 19 July 2025.

On 19 July 2025, intense, long duration rainfall triggered over 550 landslides in Sancheong, South Korea, killing at least 10 people.

Image of a landslide partially covered with a transparent sand-colored overlay and the words “The Landslide Blog,” centered, in white

On 19 July 2025, extremely heavy rainfall triggered multiple landslides in Sancheong, South Korea. This event has been described by a new paper (Nguyen et al. 2026) just published in the journal Landslides. The paper is behind a paywall, but this link should give you access at the time of writing.

The core of the affected area is at [35.4333, 127.9111] (as usual, Landslides provides the location in degrees minutes and seconds when digital degrees is so much more useful – a pet frustration of mine!). This is a Planet Labs image of a part of the area, captured before the event. The marker is at the coordinate noted above:-

Planet Labs image of a part of the area affected by landslides during heavy rainfall in Sancheong County, South Korea on 19 July 2025.
Planet Labs image of a part of the area affected by landslides during heavy rainfall in Sancheong County, South Korea on 19 July 2025. Image copyright Planet Labs, used with permission. Image dated 10 July 2025.

And this is the same area after 19 July 2025:-

Planet Labs image of a part of the area affected by landslides during heavy rainfall in Sancheong County, South Korea on 19 July 2025.
Planet Labs image of a part of the area affected by landslides during heavy rainfall in Sancheong County, South Korea on 19 July 2025. Image copyright Planet Labs, used with permission. Image dated 23 July 2025.

And here is a slider to allow a comparison:-

Planet Labs image of a part of the area affected by landslides during heavy rainfall in Sancheong County, South Korea on 19 July 2025.Planet Labs image of a part of the area affected by landslides during heavy rainfall in Sancheong County, South Korea on 19 July 2025.
Images by Planet Labs.

Nguyen et al. (2026) have mapped 568 individual landslides triggered by this rainfall event, triggered by rainfall in the range of 498 – 619 mm over a c. 55 hour period. These landslides killed at least 10 people and caused damage to homes and infrastructure. It is estimated that the restoration costs are in the order of US$800 million.

In common with many other events of this type, the landslides are mainly shallow, translational failures in soil or regolith on steeper slopes. As I have frequently noted, such terrain is very susceptible to unusually intense rainfall events, which often trigger a cluster of landslides in close proximity. These often merge to form channelised debris flows. Nguyen et al. (2026) note however that their modelling indicates that it was a combination of the intensity of the rainfall and its duration that led to these failures.

As rainfall intensities increase due to climate change, we are seeing increasing numbers of these landslide clusters. I greatly welcome studies such as Nguyen et al. (2026) , which allow us to build understanding in each case.

Reference and acknowledgement

Nguyen, H.H.D., Song, C.H. & Kim, Y.T. 2026. Physically based data-driven analysis for large-scale investigation of the July 2025 rainfall-induced landslide in Sancheong, South KoreaLandslides. https://doi.org/10.1007/s10346-026-02778-x

Planet Team 20246. Planet Application Program Interface: In Space for Life on Earth. San Francisco, CA. https://www.planet.com/

Text © 2026. The authors. CC BY-NC-ND 3.0
Except where otherwise noted, images are subject to copyright. Any reuse without express permission from the copyright owner is prohibited.
  •  

Fatal landslides in April 2026

The landslide at Lamarain in Papua New Guinea

In April 2026 I recorded 36 fatal landslides causing 90 fatalities, the lowest monthly total for 2026 to date.

Image of a landslide partially covered with a transparent sand-colored overlay and the words “The Landslide Blog,” centered, in white

This is my regular update for the number of fatal global landslides, focusing on March 2026. As usual, this data has been collected in line with the methodology described in Froude and Petley (2018) and in Petley (2012). References are listed below – please cite these articles if you use this analysis. Data presented in these updates should be treated as being provisional at this stage as I will reanalyse them prior to formal publication, and other events will emerge.

The headline figures are as follows:

March 2026: 36 fatal landslides causing 90 fatalities;

This is an interesting result, unusually showing that fatal landslides in April were substantially lower than for any of the preceding months in 2026. This is the updated annual chart by month:-

The number of global fatal landslides in 2026 by month to the end of April.

Loyal readers will know that I like to present the running total using pentads (five day blocks). This is the cumulative total pentad graph to the end of Pentad 24 (which captures all of the events to the end of April):-

The cumulative total number of global fatal landslides in 2026 by pentad to the end of April.

Thus, whilst April 2026 was unexceptional compared with the previous months of this year, the number of fatal landslides was still above the long term mean. Overall, 2026 continues to run extremely hot, exceeding even the record-breaking year of 2024.

We now start to enter the crucial period of much higher global fatal landslide occurrence. Whilst in the long term dataset this acceleration typically occurs in June (or even July), in recent years it has happened in May, as the 2024 line shows. I will watch with great interest to see what happens this month.

As I always stress, the occurrence of fatal landslides prior to the South and East Asia rainy seasons is not a predictor of what will happen in that period. Interestingly, the WMO is forecasting a below average summer monsoon in South Asia.

References

Froude, M. and Petley, D.N. 2018.  Global fatal landslide occurrence from 2004 to 2016.  Natural Hazards and Earth System Sciences 18, 2161-2181.

Petley, D.N. 2012. Global patterns of loss of life from landslidesGeology 40 (10), 927-930.

Text © 2026. The authors. CC BY-NC-ND 3.0
Except where otherwise noted, images are subject to copyright. Any reuse without express permission from the copyright owner is prohibited.
  •  

Four days of extreme rain in Indonesia killed 7% of world’s rarest great apes, study finds

Critically endangered Tapanuli orangutan population falls after heavy rain and landslides, fuelled by climate crisis, in North Sumatra

Extreme rainfall and landslides fuelled by the climate crisis killed 7% of the remaining population of the world’s rarest great ape, a study has found, prompting fears for the species’ survival.

The research suggests 58 out of the remaining 800 critically endangered Tapanuli orangutans (Pongo tapanuliensis) were killed after more than 1,000mm (39in) of rain fell over four days in Indonesia’s North Sumatra province in November 2025. This equates to 11% of the local population and 7% of the entire species.

Continue reading...

© Photograph: Nature Picture Library/Alamy

© Photograph: Nature Picture Library/Alamy

© Photograph: Nature Picture Library/Alamy

  •  
❌