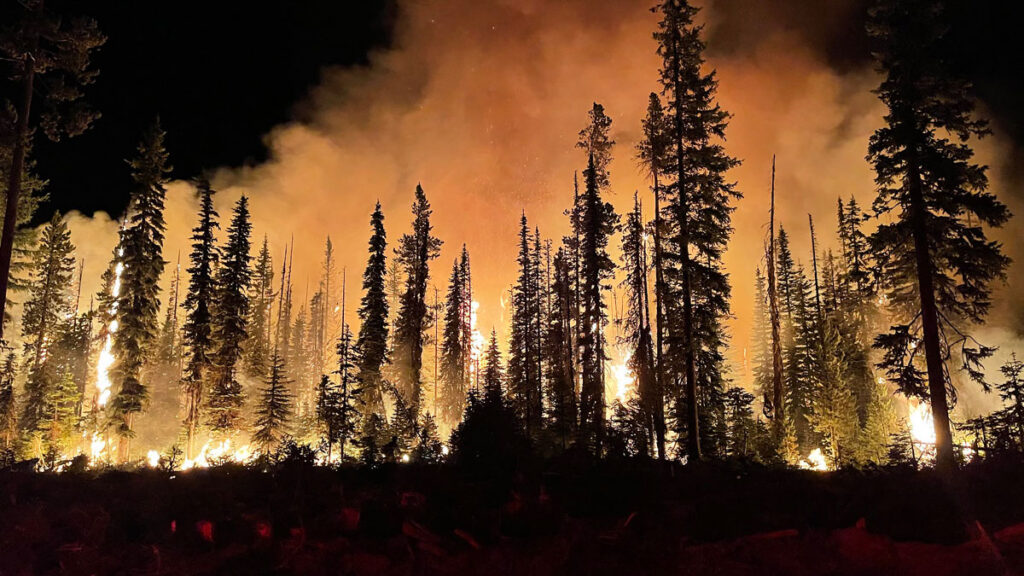
A warm, dry spring has set the stage for above-average significant wildland fire risk across much of the southern and western United States this summer, and no part of the United States will have below-average fire potential through the end of August.
“It’s not necessarily a foregone conclusion that we’re going to have a really busy season, but everything is pointing that way.”
These predictions are part of a 4-month outlook produced monthly by the National Interagency Fire Center (NIFC), a group of wildland fire experts from eight federal agencies that coordinates wildland fire resources across the country.
The most recent outlook, published 1 May, projects the likelihood of significant fires (defined as those that require an NIFC response) from May to August using long-term forecasts from NOAA’s Climate Prediction Center, current precipitation and drought conditions, and an assessment of the fuels available in different regions (like grasses, brush, and timber).
This year, 1,848,210 acres across the country have already burned—nearly twice the annual average over the past 10 years.
“It’s not necessarily a foregone conclusion that we’re going to have a really busy season, but everything is pointing that way,” said Jim Wallmann, a meteorologist for the U.S. Forest Service at the NIFC and one of the outlook’s authors.
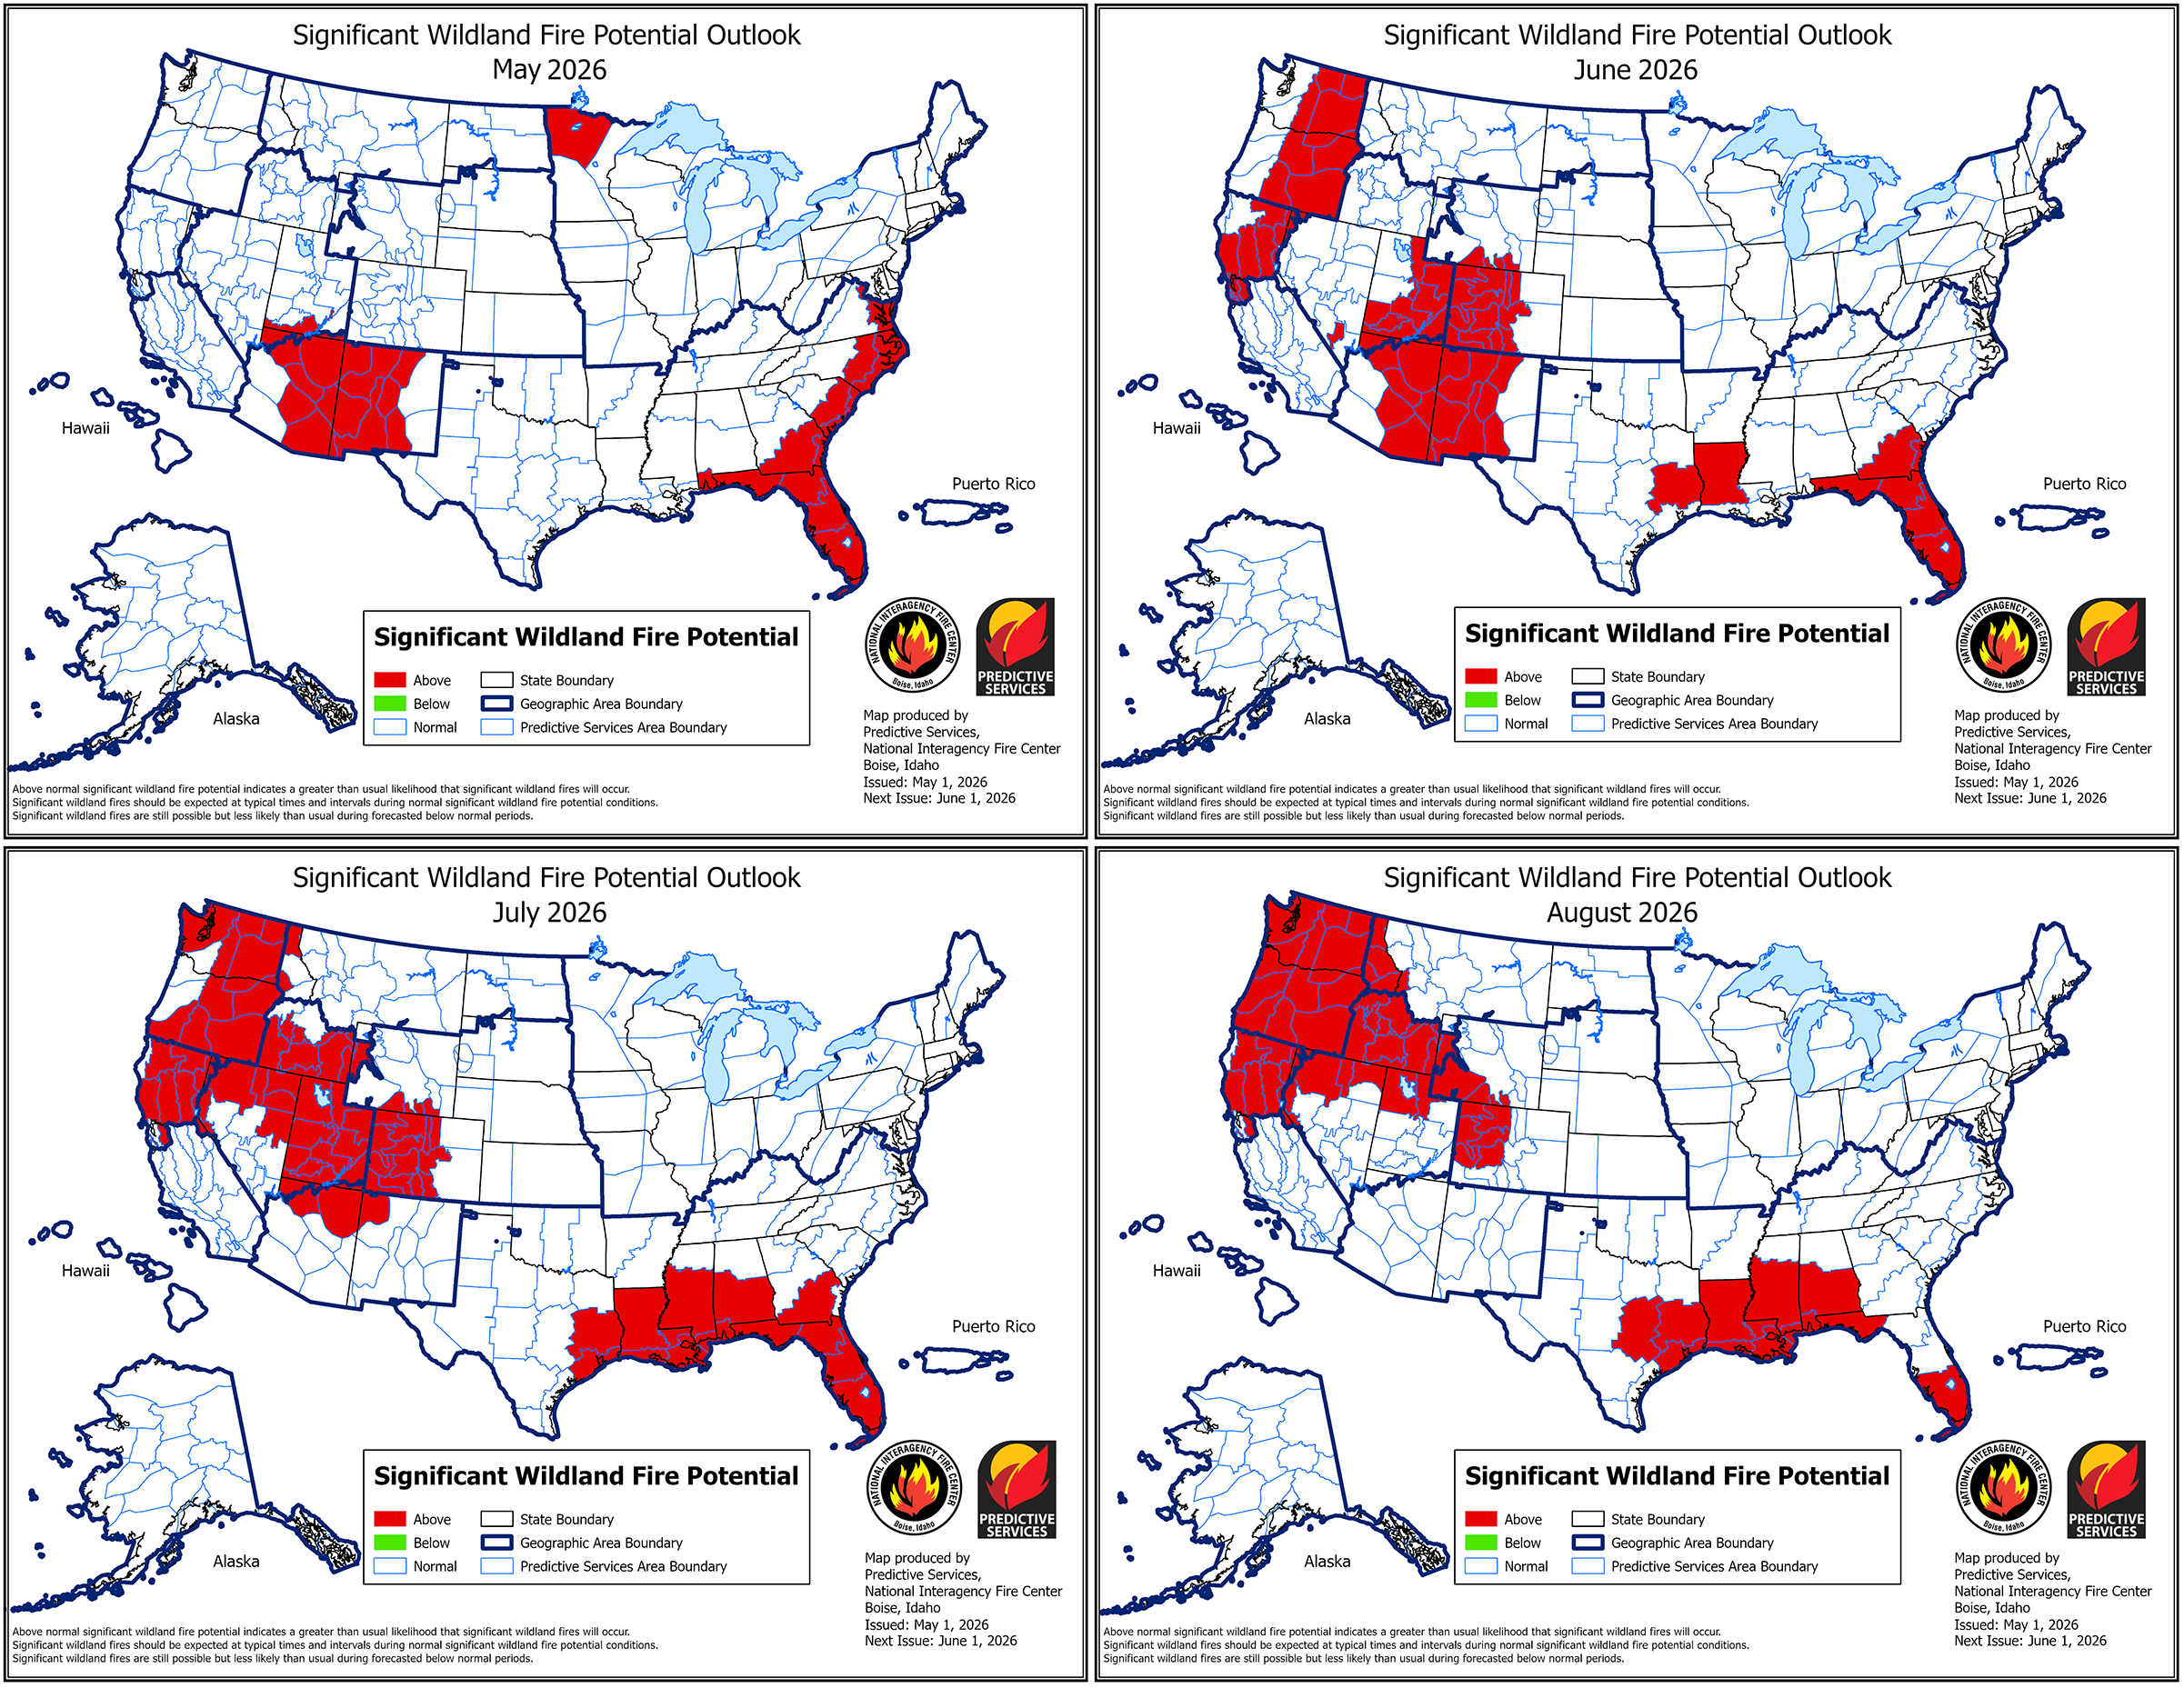
Significant wildland fire potential will be elevated across much of the West and Southeast this summer. Click image for larger version. Credit: National Interagency Coordination Center, Public Domain
Drought in the West
In the West, wildfire season typically peaks in late summer. This most recent outlook predicts an above-average significant fire potential for much of the West as the season peaks.
In May, the above-average risk is concentrated in eastern Arizona and western New Mexico, though that risk fades to normal by August as the Southwest’s monsoon season begins. In June, the above-average risk extends to western Colorado and parts of the Pacific Northwest. In July and August, that risk covers much of the Northwest, including Utah, Idaho, Oregon, Washington, and Northern California.
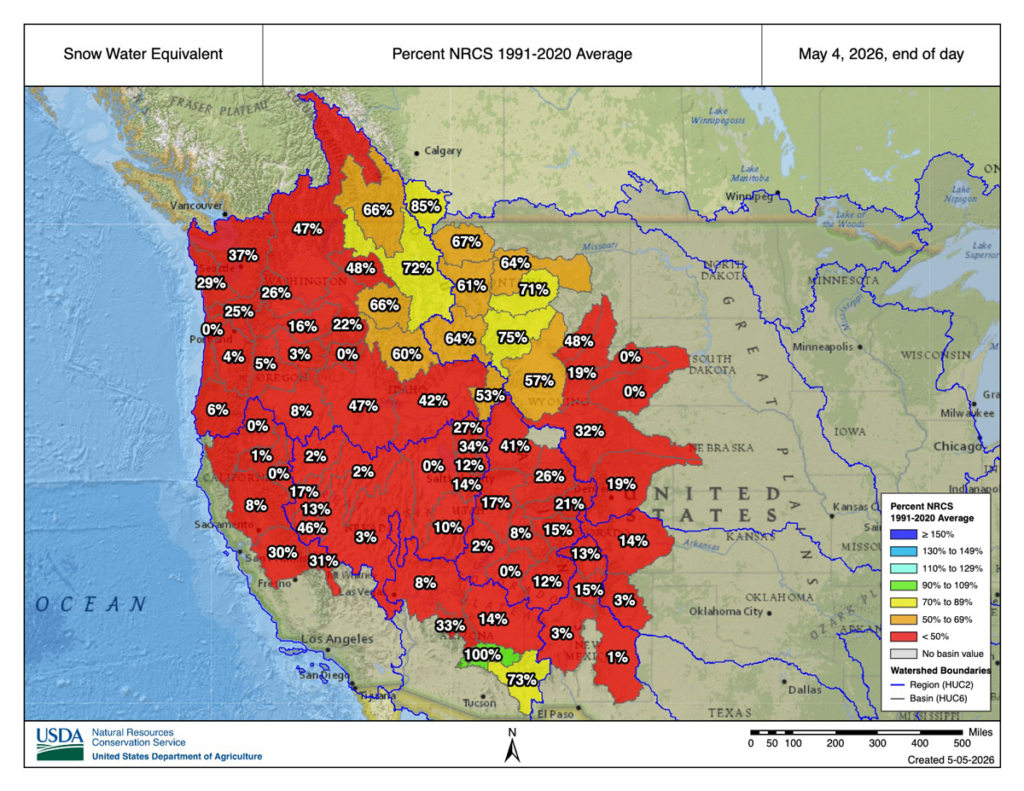
Above-average spring temperatures and a far-below-normal snowpack across the West are contributing to the elevated risk in Washington, Oregon, Idaho, and Northern California, in particular. Many river basins across the West contain less than 20% of their normal amount of snow, and some are already snow-free at all observed locations due to melting caused by warm temperatures in March.
As of May, many river basins in the West have a snow water equivalent—the amount of water held in their current snowpack—that is less than 50% (in red) of the 1991–2020 average level. Credit: USDA Natural Resources Conservation Service, Public Domain
“The snowpack being lower this time of year, and melting out, affects the soil moisture throughout the rest of the summer, which then affects the fuel moistures,” said Craig Clements, a meteorologist at San Jose State University’s Fire Weather Research Laboratory who was not involved in the outlook. Early snowmelt also uncovers fuels, like pine needles and leaf litter, that would typically be under snow, exposing them to the air to dry and catch fire.
Southern California and the Sierra Nevada mountain range, though, remain at an average significant fire risk throughout the summer, as a result of higher-than-average precipitation earlier in the year.
The Southeast and Beyond
Fire risk will also be elevated in the Southeast this summer. Florida, for example, remains at an above-average significant fire potential through the end of August. Southern Georgia, Mississippi, Louisiana, Arkansas, and the eastern halves of Virginia, North Carolina, and South Carolina will also have above-average significant fire potential.
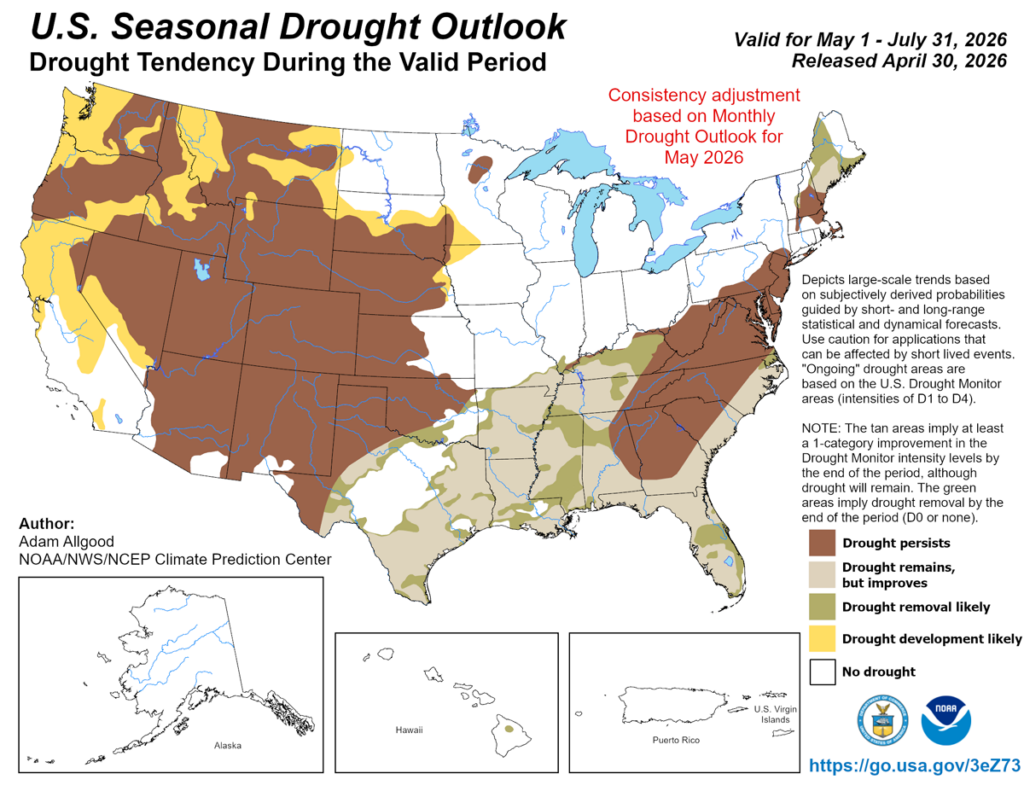
The above-average risk is fueled, in part, by a worsening drought affecting the Southeast alongside the drought in the West. As of 1 May, nearly 63% of the country was experiencing drought, and 19% of the country was experiencing extreme or exceptional drought, according to the U.S. Drought Monitor.
The Midwest and the Northeast will remain at an average significant fire potential from May to August, though northwestern Minnesota faces an above-average potential in May.
No place in the United States is projected to have a below-average significant fire potential through the end of August.
Preparing Amid Uncertainty
A developing El Niño—a climate phenomenon that affects heat storage in the ocean—could alter the fire risk projections. Scientists expect that a strong El Niño could lead to a below-normal hurricane season, worsening drought in the Southeast. In the Pacific, a strong El Niño could intensify the hurricane season, which may lower wildfire risk.
However, a stronger El Niño could drive more lightning strikes in the Sierra Nevada, which could increase fire risk there, Clements said. In 2020, for example—a strong El Niño year—Hurricane Elida in the Pacific contributed to a lightning outbreak that supercharged wildfires in the West.
“We’re still not sure exactly how [El Niño] is going to impact the season.”
“We’re still not sure exactly how [El Niño] is going to impact the season,” Wallmann said. As late summer approaches, meteorologists will better understand how El Niño will develop and affect wildfire risk.
Weather patterns can change, and day-to-day conditions still play a role in fire occurrence. “If the weather shifts, or we get a really big heat wave, it can modify [the forecast]. Or if it remains relatively moderate, that might lessen the fire danger,” Clements said. “We’ll just have to see how the weather plays out.”
Wallmann and Clements emphasized that those living in areas with elevated fire risk should be aware of their surroundings and think ahead about where they might go for safety should a wildfire occur. “Having that situational awareness ahead of time can help you make better decisions,” Wallmann said.
Citation: van Deelen, G. (2026), Most of the U.S. West will face above-normal wildfire risk this summer, Eos, 107, https://doi.org/10.1029/2026EO260145. Published on 11 May 2026.
As seismic waves travel through Earth, they gradually lose energy, a process called attenuation. That energy loss doesn’t happen uniformly—some features in the crust sap far more energy from seismic waves than others. Researchers can map underground features by watching where seismic waves lose more or less energy. The Southern Array for the Lithosphere and Uplift of Taiwan Experiment (SALUTE) is doing just that, providing information that could lead to improved seismic hazard planning in the country.
Lin et al. report attenuation results from SALUTE focused on the convergence between the Eurasian plate and the Luzon Arc, an understudied, geologically dynamic area where Earth’s crust is deforming. Using the overall attenuation rate and relative attenuation rates of P and S seismic waves, the authors imaged active faults, identified distinct lithologies, and better resolved the Luzon forearc block that sits just offshore of Taiwan.
The authors used data from the SALUTE high-density seismographic network, spanning December 2020 to December 2023, to construct both 2D and 3D attenuation models. They found clear changes in attenuation associated with major faults, as well as areas of high attenuation associated with fluid-rich, ductile zones in the lower crust that cause tectonic tremors. Their attenuation imaging additionally revealed that the Luzon forearc block, which had been poorly imaged in the past, dips northward and narrows as it nears the convergence zone.
The authors say their results agree well with previous velocity-based seismic imaging studies and show that attenuation can image features, such as transition zones, that were previously difficult to capture. Their data could also be useful for better understanding seismic hazard throughout the region, they note. (Geophysical Research Letters,https://doi.org/10.1029/2025GL121583, 2026)
Citation: Scharping, N. (2026), Seismic attenuation techniques reveal what lies beneath Taiwan, Eos, 107, https://doi.org/10.1029/2026EO260150. Published on 11 May 2026.
Thirty years ago, the blockbuster movie Twister featured a group of academics putting themselves at risk by chasing tornadoes in the name of science. Although the Hollywood story entailed a surfeit of sensationalism, special effects, and unrealistic stereotypes, the movie got a few things right. Specifically, the scientists were trying to study tornadoes using a large number of spatially distributed, home-built, low-cost (and potentially sacrificial) sensors.
Today, we commonly refer to the coordinated use of tens to hundreds of similar sensors that are spread out as “large-N” sensing. Such sensor distributions have led to important advances in seismology and infrasound science, where they have improved our understanding of seismic ground motion and helped shed light on volcanic eruption dynamics [e.g., Rosenblatt et al., 2022; Anderson et al., 2023].
The benefits of large-N networks and arrays include robust spatial sampling and signal extraction from noise. They are also advantageous for detecting small signals, sensing natural hazards in remote environments, and offering critical redundancies for sensors at risk from lava or debris flows, wildfire, weather, or even malicious mammals.
Since 2013, our research group in the Department of Geosciences at Boise State University (BSU) has worked to study infrasound from geophysical phenomena by capitalizing on the benefits of low-cost, large-N sensing technology [e.g., Slad and Merchant, 2021]. More than a decade on, this effort has yielded scientific successes from a variety of environments, and it is continuing to evolve.
Large-N Sensing for Infrasound
Many violent natural processes, including landslides, volcanic eruptions, earthquakes, avalanches, and meteors, produce infrasound.
Many violent natural processes, including landslides, volcanic eruptions, earthquakes, avalanches, and meteors, produce infrasound, defined as low-frequency sound below the threshold of human hearing (less than 20 Hertz). Such events may create audible sound as well, but the subaudible band is often much more energetic in terms of sound intensity, and it has long wavelengths that can propagate long distances with little attenuation. These characteristics make infrasound especially valuable for remote sensing of natural phenomena.
Our group at BSU grew more interested in developing our own inexpensive infrasound sensing solutions after costing out technology for commercial data logging systems, the compact electronic devices that record and store sensor data. These systems can be far more expensive than infrasound transducers—the sensors that actually detect sound—themselves.
The cost element became particularly relevant after we lost instrumentation deployed at the summit of Chile’s Villarrica volcano when it erupted a 2-kilometer-tall lava fountain on 3 March 2015 [Johnson et al., 2018]. In an instant, our hardware, including seismic and infrasonic sensors and their commercial multichannel data loggers, was entombed beneath falling lava. This financial loss incentivized our work to develop low-cost loggers that would match the technical specifications and fidelity of commercial systems.
The result was the customized Gem infrasound logger, which we created using the widely available and very economical Arduino open-source electronic prototyping platform and its low–power consumption microcontroller. The Gem is an all-in-one infrasound sensor and data logger with a high dynamic range (millipascals to 100 pascals), a 100-hertz sample rate appropriate for infrasound, and a built-in GPS for precise timing and synchronization [Anderson et al., 2018].
Although we initially conceived of the Gem as an alternative to commercial loggers to be deployed as single stations or in small arrays, we quickly realized its potential for use in high-density distributed sensing arrays that enabled new detection capabilities. In particular, its small package size (it has about the dimensions and weight of a paperback novel) and its ease of deployment—simply insert alkaline batteries, place it on the ground, and turn it on—have opened opportunities for rapid, large-N deployments in difficult-to-access environments.
Early Successes for the Gem
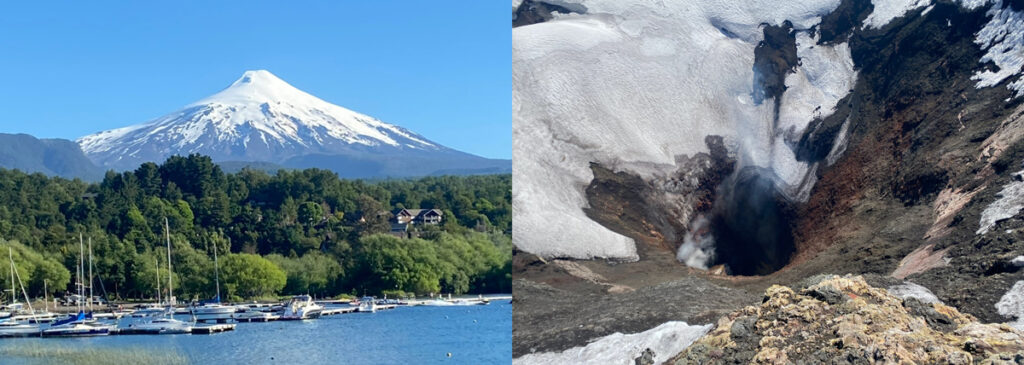
Volcán Villarrica, near Pucon, Chile, is seen in 2025 (left). The volcano regularly releases gas from a small lava lake recessed deep within the summit crater (right). Credit: Jeffrey B. Johnson
The Gem’s inaugural field mission came in January 2020 during a return to Villarrica, where activity had returned to normal following its 2015 paroxysmal eruption [Rosenblatt et al., 2022]. Typical activity in the volcano’s normal state includes open-vent degassing from a small lava lake recessed deep within the summit crater, which produces its famously powerful volcano infrasound [e.g., Johnson et al., 2012].
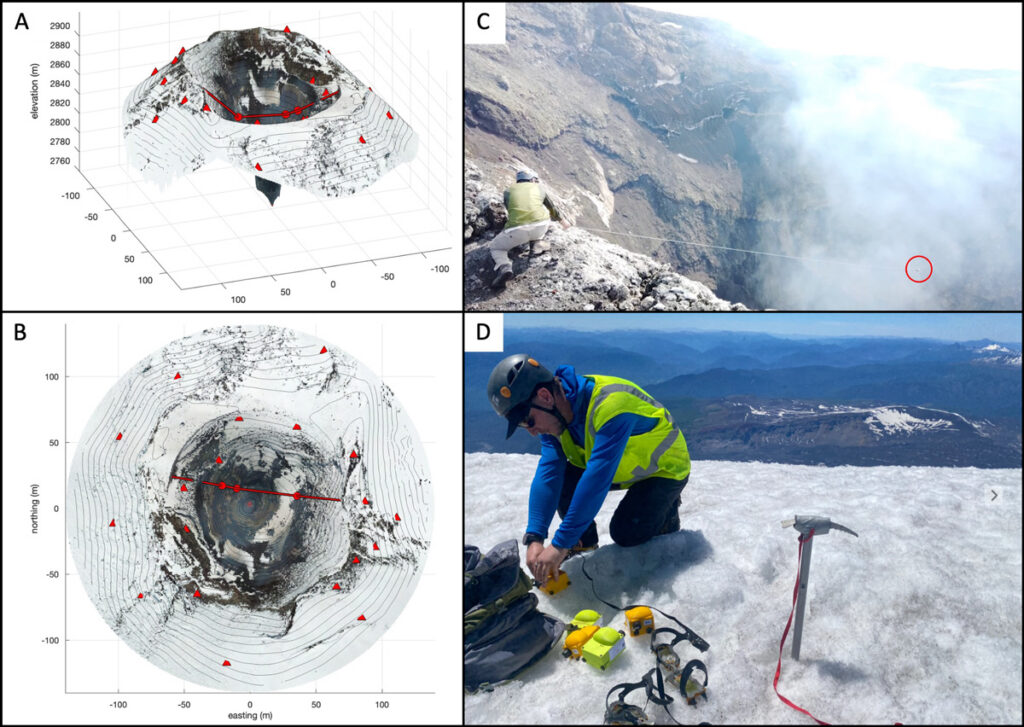
To capture Villarrica’s infrasound in detail, a four-person team from BSU climbed the 3,000-meter-tall glaciated volcano and quickly installed 16 sensors around the crater rim, as well as another 16 sensors along an 8-kilometer linear transect from the summit down the northern slope (Figure 1). This unique sensor distribution permitted us to capture the infrasound wavefield and how it interacts with topography in unprecedented detail.
Fig. 1. (a) Oblique and (b) plan views of Villarica’s summit region were created from structure-from-motion surveys in 2020. Red triangles and circles indicate locations of Gem sensing packages. (c) Also in 2020, Jake Anderson adjusts a cable suspended across the volcano’s crater that held a Gem sensor (circled). (d) In 2025, Jerry Mock unloads Gem systems at Villarica’s summit during another data collection campaign there. Click image for larger version. Credit: Jeffrey B. Johnson
Deploying such an array configuration using much heavier, larger, and power-intensive conventional instruments would have taken far more time and resources, as well as a bigger group. With the Gems, however, the installation was feasible for our small team, each member of which could easily carry eight instruments and the batteries needed to power them.
To monitor volcanoes with infrasound, it is necessary to understand the influence of atmospheric effects.
Once in place, these sensors collected continuous data during the 2-week study that were used to quantify the diffraction of sound coming out of the volcanic crater [Rosenblatt et al., 2022] and to measure the sound’s attenuation as it propagated away. Such studies are important for investigating time-varying atmospheric parameters such as changing temperatures and winds, which can affect infrasound transmission, diminishing its amplitude or even—in extreme cases—completely silencing it in an acoustic shadow zone [Johnson et al., 2012]. To monitor volcanoes with infrasound, it is necessary to understand the influence of atmospheric effects.
Months later, another opportunity arose to demonstrate the Gems’ capability for large-N infrasound sensing. During the early days of the COVID-19 pandemic, on 31 March 2020, a magnitude 6.5 earthquake occurred near Stanley, Idaho. The earthquake, the largest in the state since 1983, kicked off an energetic aftershock sequence, with more than 700 magnitude 3 or greater earthquakes occurring in 6 months. Most of these events produced significant local infrasound radiation, or “airquakes,” caused by ground-atmosphere coupling [e.g., Johnson et al., 2020].
Pandemic-related precautions inhibited a large team from venturing as a group into the field. However, a lone BSU researcher (coauthor Jacob Anderson), trudging through forest terrain and deep snow on skis, was able to deploy and activate 22 Gems in less than 4 hours in early April, thanks in part to the sensors’ compact size and ease of deployment.
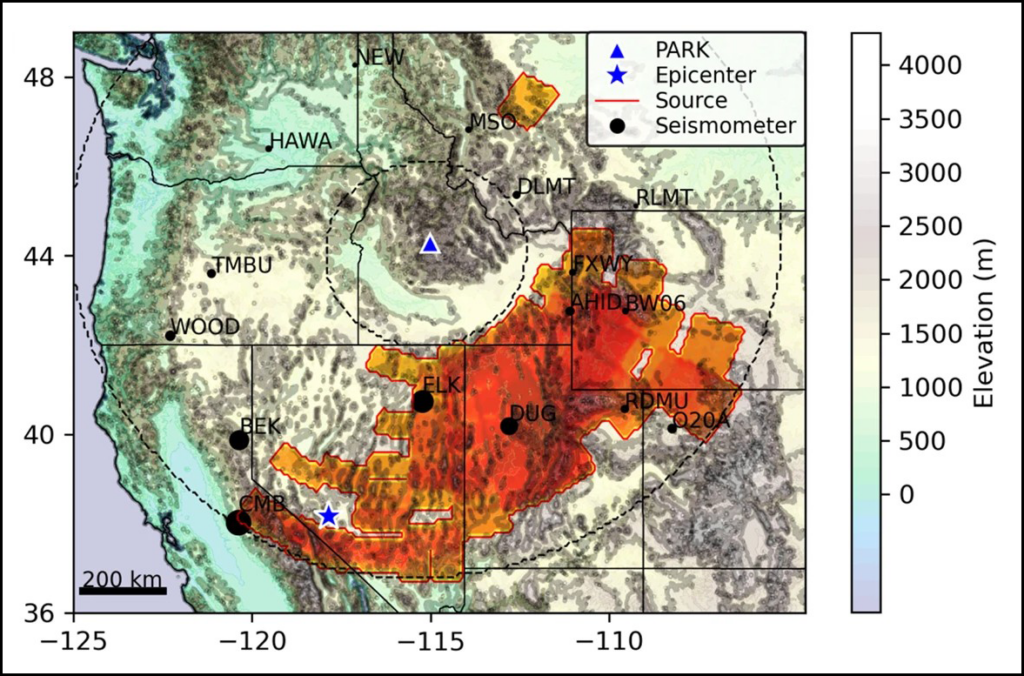
This array captured hundreds of local infrasonic aftershocks within about 25 kilometers of their epicenters. It also recorded a far larger event 700 kilometers away, the 15 May magnitude 6.5 Monte Cristo earthquake in Nevada. The array detected the epicentral infrasound from the distant earthquake source, as well as infrasound from numerous secondary sources, including mountain ranges throughout the western United States that reradiated the ground motion as infrasound (Figure 2) [Anderson et al., 2023].
Fig. 2. This map shows source region(s) of infrasound associated with the May 2020 Monte Cristo earthquake in Nevada that was detected by an array of Gem infrasound sensors deployed at the PARK site near Stanley, Idaho. Click image for larger version. Credit: Adapted from Anderson et al. [2023], CC BY 4.0
Detecting all these distinct signals was possible because of the enhanced array processing capabilities provided by the large number of sensors. Anderson et al. [2023] showed that when the data were processed from 3-sensor subsets of the 20+-sensor array—instead of from the whole array—it was possible to detect only the most intense earthquake infrasound arrivals. In other words, the larger array had much greater fidelity and sensing capabilities than smaller distributions of sensors.
During its 2-month deployment, the Stanley array also detected sounds from other distant nonearthquake sources, including waterfalls 195 kilometers away and thunder more than 900 kilometers away [Scamfer and Anderson, 2023]. Such enhanced detections, facilitated by large-N sensing, demonstrate an improved capacity to monitor a range of Earth phenomena continuously over a wide range of distances.
Putting Sensors in Harm’s Way
Since those proof-of-concept deployments, Gems have been used to monitor snow avalanches, lahars, river flow discharge, stratospheric sounds (while mounted aboard a solar balloon), and numerous volcanoes during field experiments [e.g., Tatum et al., 2023; Bosa et al., 2024; Rosenblatt et al., 2022; Brissaud et al., 2021]. Given their ease of use, small size, and low replacement cost, they’ve also been tested in hazardous environments where the risk to more expensive hardware could be considered unreasonable.
The motivation to put sensors in harm’s way is to gain insight into geophysical phenomena by recording subtle signals close to the source that may not be detectable from farther away.
The motivation to put sensors in harm’s way is to gain insight into geophysical phenomena by recording subtle signals close to the source that may not be detectable from farther away. For example, at Villarrica, Rosenblatt et al. [2022] suspended a Gem on a cable 100 meters above a lava lake to collect infrasound data from a unique, bird’s-eye perspective over the crater (Figure 1c). (Stringing the cable across the crater proved far more challenging than deploying the sensor itself, which slid down the cable until finding its resting place at the bottom of the cable’s arc.)
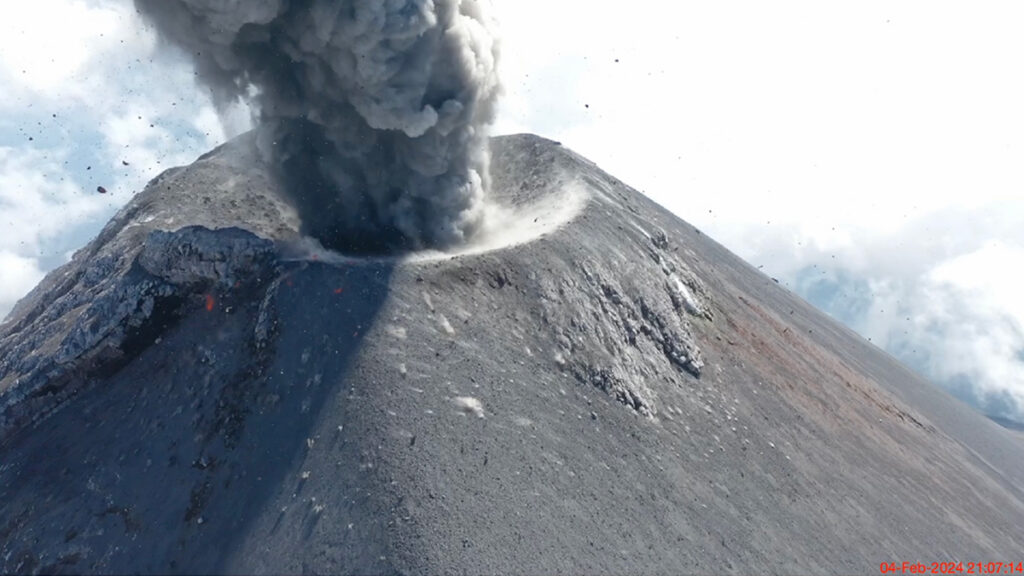
In another case, we landed a pair of Gems on the ground near a frequently exploding crater at Fuego volcano in Guatemala using a drone (see video below). We later retrieved one of the sensors from high on the volcano’s flanks. Another was lost because high winds initially posed too great a risk to fly the drone back for it. Then the following day after the wind subsided, we could not locate the stranded Gem, which was probably a casualty of a nighttime explosion.
Drone footage and infrasound recordings were collected during an explosion of Fuego volcano on 4 February 2024. Pa = pascals. Credit: video: Jerry C. Mock; animation and infrasound: Jeffrey B. Johnson
Our group at BSU also has nascent interest in using Gems to study fire in natural environments. Wildfires produce infrasound from a spatially extensive source region corresponding to actively burning areas. Because of the source complexity and the fact that fire infrasound is low amplitude and tremor-like [Johnson et al., 2025], enhancing signal-to-noise ratios in recorded infrasound is critical. This enhancement is enabled by using large-N monitoring networks, making infrasound wildfire surveillance a promising area of investigation.
Low-cost, rapid infrasound deployments could one day be used as an effective operational tool.
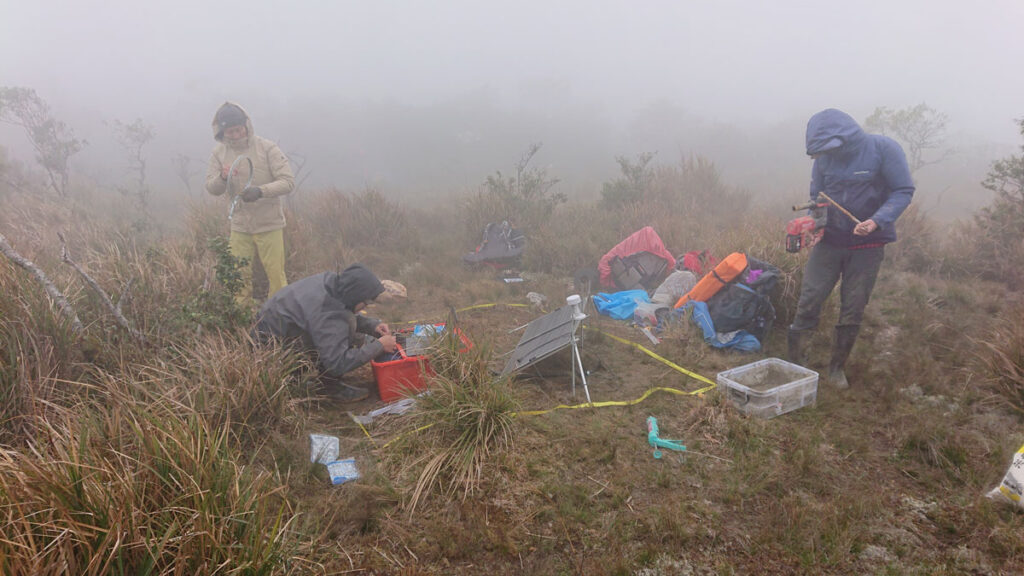
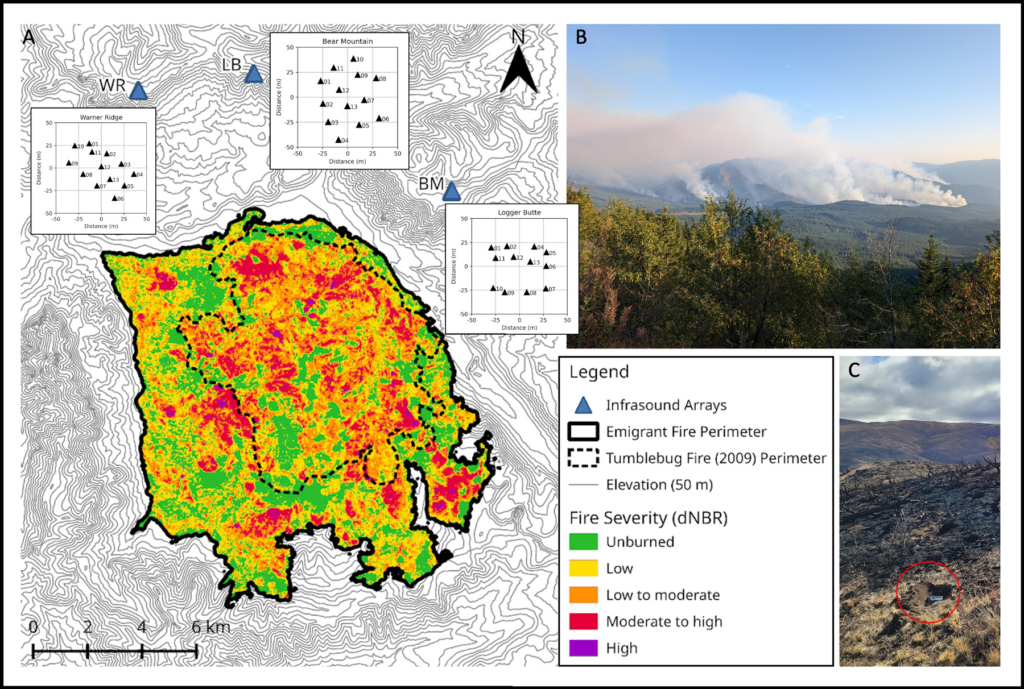
Toward this objective, our group installed 76 sensors ahead of a prescribed burn in Reynolds Creek, Idaho, in October 2023 to begin developing infrasound as a tool for monitoring and mapping wildfire. We have also deployed Gems for infrasound studies of naturally occurring wildfires, such as the Emigrant wildfire in Oregon in August and September 2025 (Figure 3). During that active wildfire response, a team safely and quickly installed tens of sensors within a matter of hours in an area facing dynamic hazards from the rapidly expanding fire, which eventually covered 33,000 acres (about 13,354 hectares). Luckily, no instruments were lost, and the data have shown the potential to track a wildfire as it advances.
Preliminary results suggest that low-cost, rapid infrasound deployments could one day be used as an effective operational tool. For example, in firefighting responses, infrasound might complement intermittent aerial observations, from aircraft or drones, because it provides a continuous record of fire activity. Infrasound surveillance might also be able to “hear” combustion sources within a burn area that is obscured to optical sensing because of clouds or nightfall.
Fig. 3. (a) The spread and severity of the 2025 Emigrant Fire in Oregon, as calculated from prefire (21 August) and postfire (18 October) Sentinel-2 satellite images, are shown. Inset maps show the distribution of 37 Gem sensors rapidly deployed in three arrays. (b) Smoke from the fire rises from the landscape on 31 August during deployment of the sensors. (c) Following the fire, one sensor that had been melted by the fire was recovered with its data card still intact (red circle). dNBR = differenced normalized burn ratio. Click image for larger version. Credit: (a) and (b): Madeline A. Hunt; (c): Jacob F. Anderson
The Evolution of Low-Cost Sensors
Five years ago, the single-sensor Gem was a cutting-edge infrasound logging solution. While it remains a powerful and economical tool for large-N arrays and for sensing in hostile environments, it is evolving.
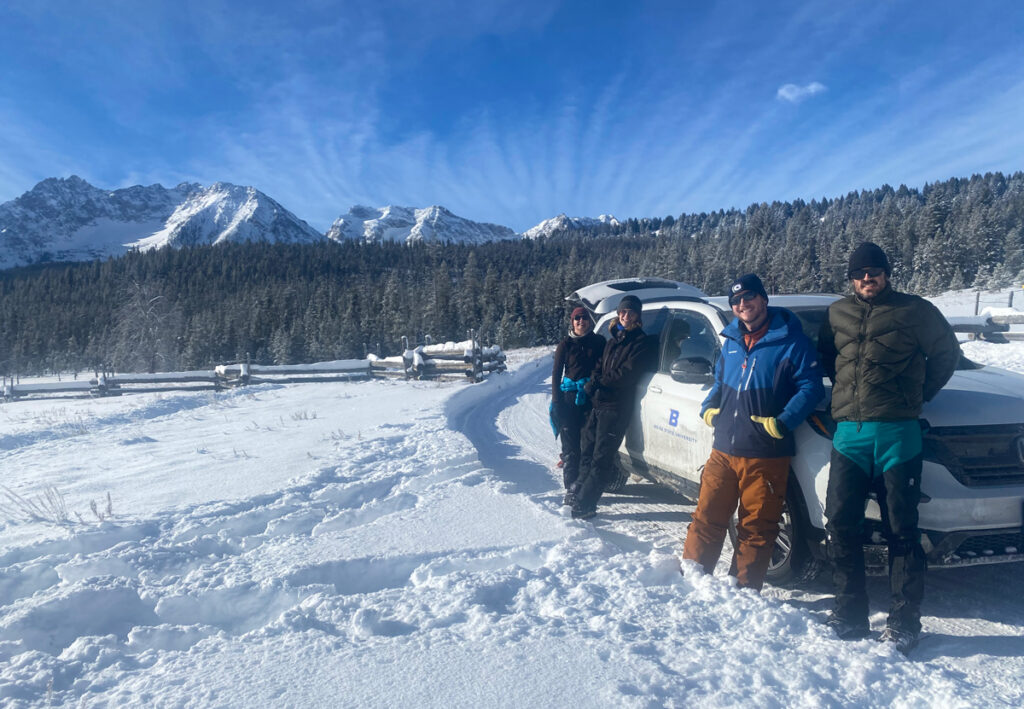
Boise State University researchers (left to right) Madeline Hunt, Owen Walsh, Jerry Mock, and Jacob Anderson prepare to deploy Gem sensors in Idaho’s Sawtooth Mountains in January 2024. Credit: Jeffrey B. Johnson
We have now developed the Gem into an even more versatile version called the Aspen, which can log four independent sensors at a sample rate of 200 hertz, double that of the Gem. The Aspen retains the small size, low weight, low power consumption, and low cost of the Gem, but with the capability to record higher-resolution 24-bit, time-synchronized data from a triaxial seismic sensor and an infrasound transducer.
Recording synchronous seismoinfrasonic data on the same logging platform offers the advantage of sensing both ground shaking and infrasonic oscillations. The ability to measure waves propagating in the ground and in the air simultaneously could facilitate work in the growing field of environmental seismology, which focuses on geophysical sources at Earth’s surface like debris flows and volcanoes.
Although we have focused on seismoacoustic geophysical measurements in our work, the concept of gathering data with low-cost instrumentation in harm’s way or from coordinated arrays of numerous sensors holds promise across Earth and environmental sciences. Such approaches could be used, for example, with tiltmeters (which measure slope changes), gravity meters, or near-infrared thermometers (e.g., optical pyrometers), all of which would offer additional data streams complementing seismoacoustic observations in geophysical studies of volcanoes.
With the diversity of emerging uses, it’s clear that large-N sensing—infeasible or cost prohibitive in many cases until recently—could transform how we measure many facets of Earth, helping to reveal the inner workings of volatile volcanoes, twisting tornadoes, and more.
Acknowledgments
More information about low-cost infrasound sensing solutions can be found at https://sites.google.com/boisestate.edu/infravolc/home. Development of the Gem infrasound logging platform was supported by a grant from the National Science Foundation (EAR-2122188).
References
Anderson, J. F., et al. (2018), The Gem infrasound logger and custom‐built instrumentation, Seismol. Res. Lett., 89(1), 153–164, https://doi.org/10.1785/0220170067.
Anderson, J. F., et al. (2023), Remotely imaging seismic ground shaking via large-N infrasound beamforming, Commun. Earth Environ., 4(1), 399, https://doi.org/10.1038/s43247-023-01058-z.
Bosa, A. R., et al. (2024), Dynamics of rain-triggered lahars and destructive power inferred from seismo-acoustic arrays and time-lapse camera correlation at Volcán de Fuego, Guatemala, Nat. Hazards, 121, 3,431–3,472, https://doi.org/10.1007/s11069-024-06926-1.
Brissaud, Q., et al. (2021), The first detection of an earthquake from a balloon using its acoustic signature, Geophys. Res. Lett., 48, e2021GL093013, https://doi.org/10.1029/2021GL093013.
Johnson, J. B., et al. (2012), Probing local wind and temperature structure using infrasound from Volcan Villarrica (Chile), J. Geophys. Res., 117, D17107, https://doi.org/10.1029/2012JD017694.
Johnson, J. B., et al. (2018), Forecasting the eruption of an open-vent volcano using resonant infrasound tones, Geophys. Res. Lett., 45, 2,213–2,220, https://doi.org/10.1002/2017GL076506.
Johnson, J. B., et al. (2020), Mapping the sources of proximal earthquake infrasound, Geophys. Res. Lett., 47, e2020GL091421 , https://doi.org/10.1029/2020GL091421.
Rosenblatt, B. B., et al. (2022), Controls on the frequency content of near-source infrasound at open-vent volcanoes: A case study from Volcán Villarrica, Chile, Bull. Volcanol., 84(12), 103, https://doi.org/10.1007/s00445-022-01607-y.
Scamfer, L. T., and J. F. Anderson (2023), Exploring background noise with a large‐N infrasound array: Waterfalls, thunderstorms, and earthquakes, Geophys. Res. Lett., 50, e2023GL104635, https://doi.org/10.1029/2023GL104635.
Slad, G., and B. Merchant (2021), Evaluation of Low Cost Infrasound Sensor Packages, Sandia Rep. SAND2021-13632, Sandia Natl. Lab., Albuquerque, N.M., https://doi.org/10.2172/1829264.
Tatum, T., J. F. Anderson, and T. J. Ronan (2023), Whitewater sound dependence on discharge and wave configuration at an adjustable wave feature, Water Resour. Res., 59, e2023WR034554, https://doi.org/10.1029/2023WR034554.
Author Information
Jeffrey B. Johnson (jeffreybjohnson@boisestate.edu), Jacob F. Anderson, Madeline A. Hunt, Owen A. Walsh, and Jerry C. Mock, Department of Geosciences, Boise State University, Idaho
Citation: Johnson, J. B., J. F. Anderson, M. A. Hunt, O. A. Walsh, and J. C. Mock (2026), Sensing the sounds from Earth’s hazardous environments, Eos, 107, https://doi.org/10.1029/2026EO260142. Published on 8 May 2026.
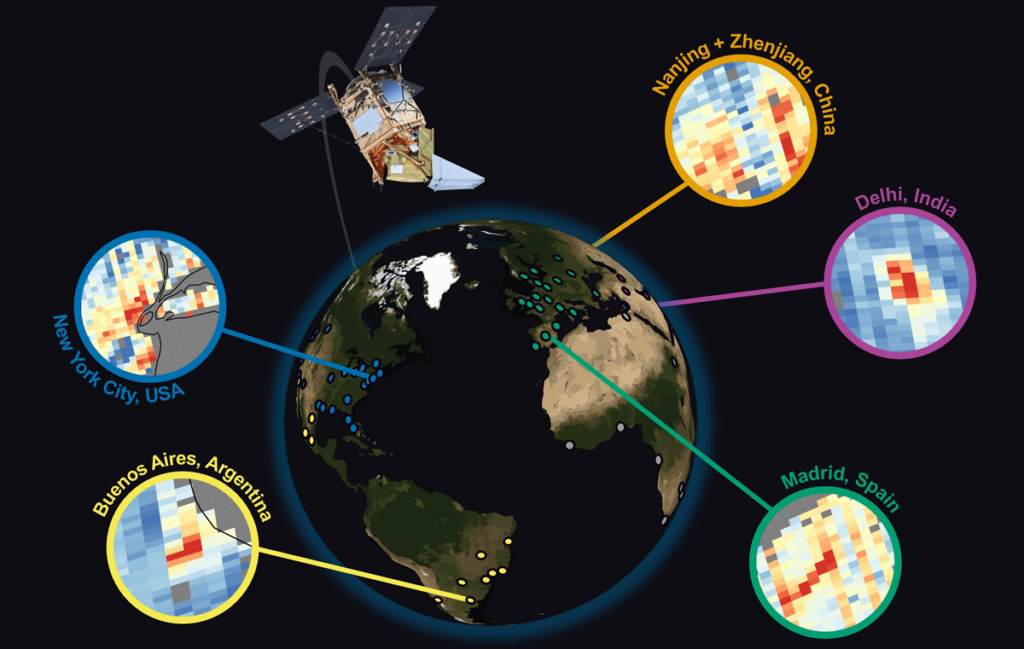
Emissions from urban areas account for about a tenth of the global methane budget, according to a new analysis of satellite data published in the Proceedings of the National Academy of Sciences of the United States of America. And those emissions grew by about 10% from 2020 to 2023, despite cities’ pledges to slash them.
Methane is a potent greenhouse gas, and it’s shorter lived in the atmosphere than carbon dioxide. That means cutting methane emissions would have great benefits for the climate over the short term. Oil and gas operations and agriculture are major sources of methane, but so are cities and their infrastructure.
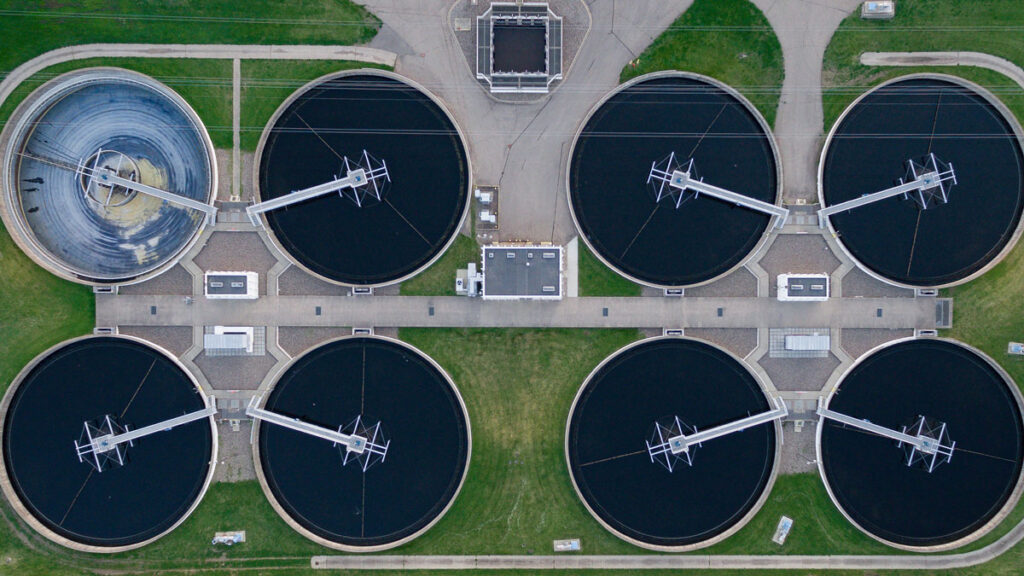
“Cities have started attempting to reduce their methane emissions, and we hope to be able to monitor this,” said Erica Whiting, a graduate student in climate and space science at the University of Michigan. Most efforts to account for urban methane emissions—from wastewater treatment plants, landfills, leaky natural gas infrastructure, and other sources—have relied on ground-based measurements and on inventories that estimate emissions on the basis of activities, said Whiting. Most of these studies have looked at a handful of cities, typically in North America and Europe.
In contrast, Whiting said her team’s study is one of the first to use satellite data to monitor urban methane emissions over time. Satellite monitoring offers long-term, often global, measurements and can provide a clearer picture of how mitigation efforts are developing.
Falling Short
A growing number of cities are aiming to reduce carbon emissions, and the new data show many of them are not on track.
A growing number of cities are aiming to reduce carbon emissions, and the new data show many of them are not on track. Whiting’s study included 92 cities around the world, including 51 members of a coalition called C40, which was founded in 2005. This 96-country coalition is working toward the goal of cutting greenhouse gas emissions by half by 2030, including a 34% decrease in methane emissions. These numbers are aligned with the goal of limiting global warming to 1.5°C over preindustrial levels.
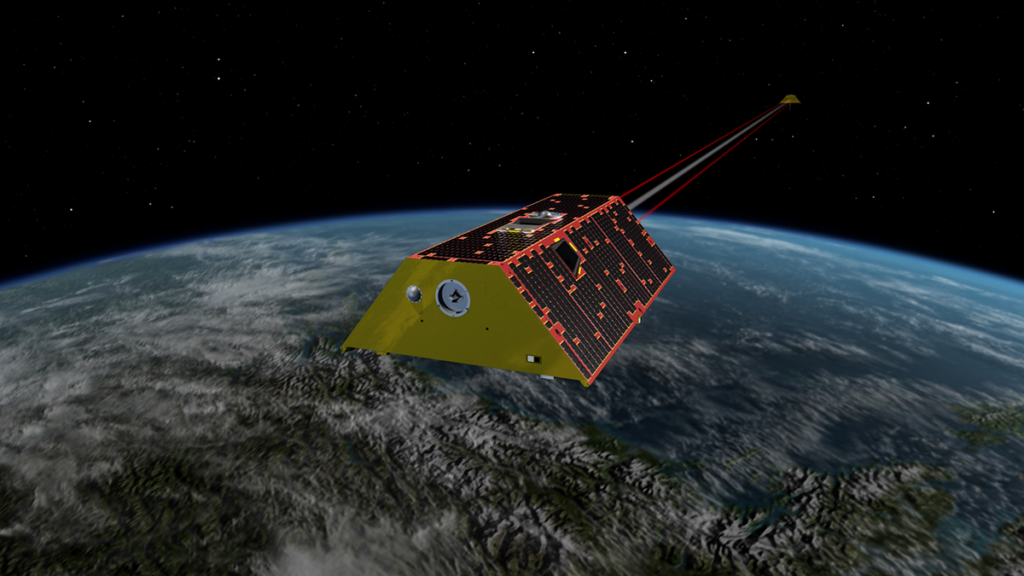
Whiting’s team analyzed methane data from the satellite-based TROPOMI (Tropospheric Monitoring Instrument) from 2019 to 2023. TROPOMI launched in 2017, making it possible to continuously monitor methane and other gas concentrations around the world. TROPOMI data showed that from 2019 to 2020, urban methane levels fell. But from 2020 to 2023, emissions grew 10% in C40 cities and 12% in non-C40 cities. The study focuses not just on urban centers but also on their outlying areas, where known methane sources such as landfills and wastewater treatment plants are often located.
The Tropospheric Monitoring Instrument (TROPOMI) aboard the Sentinel-5P satellite measures the potent greenhouse gas methane. In snapshots over urban areas, higher methane concentrations are depicted in warmer colors. Credit: Erica Whiting
The current study can’t point to what accounts for these trends, said Whiting. However, she said, urban populations grew during the study period, which could be a contributor to the cities’ growing emissions.
“In most regions of the world, there is no evidence that methane emissions from cities are decreasing at all.”
Rob Jackson, an Earth system scientist at Stanford University and chair of the Global Carbon Project, noted that it’s hard to know how to interpret the increase in emissions because the study period includes the era of the COVID-19 pandemic lockdowns, which caused major changes in people’s behavior and associated drops in anthropogenic emissions in 2020. (However, counterintuitively, the early 2020s actually saw a spike in overall methane emissions, which some scientists attribute to wetlands and changes in atmospheric chemistry.) Nevertheless, he said the data show that the world is not on track to decrease urban methane emissions. “In most regions of the world, there is no evidence that methane emissions from cities are decreasing at all,” he said.
“This work clearly shows that major cities worldwide are not reducing methane emissions at a rate consistent with the Global Methane Pledge,” Jackson said. This international agreement, made in 2021, has reduction goals that align with those of the C40 coalition: decrease global methane emissions by at least 30% relative to 2020 levels by 2030. The European Commission and 159 countries are participating in the pledge.
Whiting hopes better data will help. City and regional governments can use data from satellites to support and monitor ongoing efforts to lower methane emissions. “We’re excited to have this approach to monitor changes, and it should be useful for urban planning,” she said.
Zachary Tofias, director of food and waste at C40 Cities, noted via email that the organization was not involved with the design of the study. He pointed to several recent large-scale composting and other waste management facilities recently commissioned by member cities that should help bring down methane emissions going forward. The increasing availability of satellite and aerial monitoring data, he said, “provides an amazing additional tool for cities and facility managers to understand and address methane leaks from waste-disposal sites.”
Citation: Bourzac, K. (2026), Urban methane emissions are rising, despite cities’ pledges, Eos, 107, https://doi.org/10.1029/2026EO260143. Published on 8 May 2026.
Source: Journal of Geophysical Research: Earth Surface
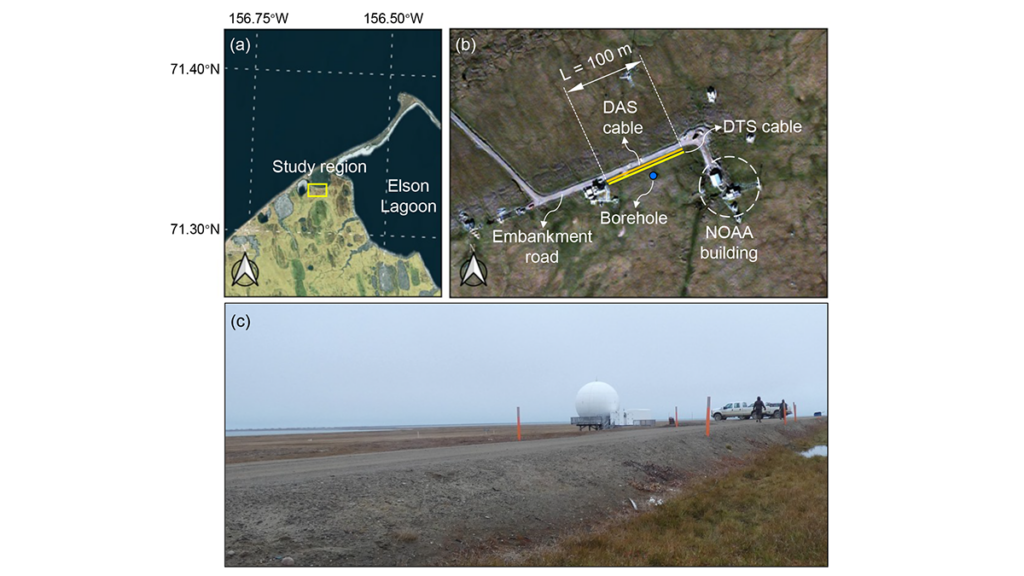
Permafrost beneath Arctic roads is warming and becoming less stable, creating growing risks for northern infrastructure. Yet predicting how frozen ground will evolve remains difficult because subsurface conditions vary sharply over short distances, observations are sparse, and conventional process-based models are not easy to update as new field data arrive. In a new study, Gou et al. [2026] address that challenge at an embankment road in Utqiaġvik, Alaska, using fiber-optic temperature measurements collected along a 100-meter transect to track how shallow ground conditions change through time. Rather than treating monitoring and modeling as separate tasks, the authors link them in a framework designed to evolve with the physical system itself.
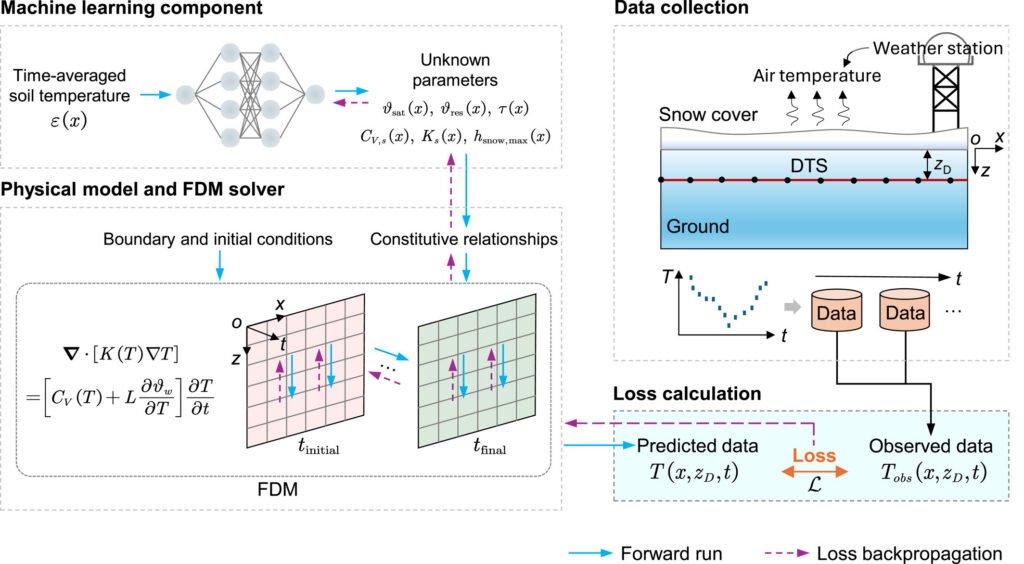
What stands out here is not simply the use of machine learning, but the way the authors build a physics-informed digital twin for permafrost under infrastructure. Their framework embeds a neural network within a heat-transfer solver, so the governing physics remain central while the model can still update uncertain soil properties as new observations arrive. This study moves beyond black-box prediction toward an interpretable, updateable system that can reconstruct subsurface temperature fields, infer thermodynamic properties such as unfrozen water content and thermal conductivity, and then test those inferences against independent DAS data, borehole temperatures, and laboratory measurements. This makes the work more than a site-specific modeling exercise; it offers a credible pathway toward near-real-time permafrost forecasting and infrastructure monitoring in a rapidly warming Arctic.
Framework of the proposed digital twin model. The neural network (NN) takes soil temperature at each lateral position as input and outputs six unknown parameters that vary laterally with distance. These parameters are embedded in the heat‐transfer equation through constitutive relationships, and the resulting system is solved using a finite difference method (FDM). The difference between predicted and observed temperatures is computed and defined as “loss,” and the loss gradients are backpropagated to update the NN parameters. Credit: Gou et al. [2026], Figure 2
Citation: Gou, L., Xiao, M., Zhu, T., Martin, E. R., Wang, Z., Rocha dos Santos, G., et al. (2026). Physics-informed digital twin for predicting permafrost thermodynamic characteristics under an embankment road in Utqiaġvik, Alaska. Journal of Geophysical Research: Earth Surface, 131, e2025JF008787. https://doi.org/10.1029/2025JF008787
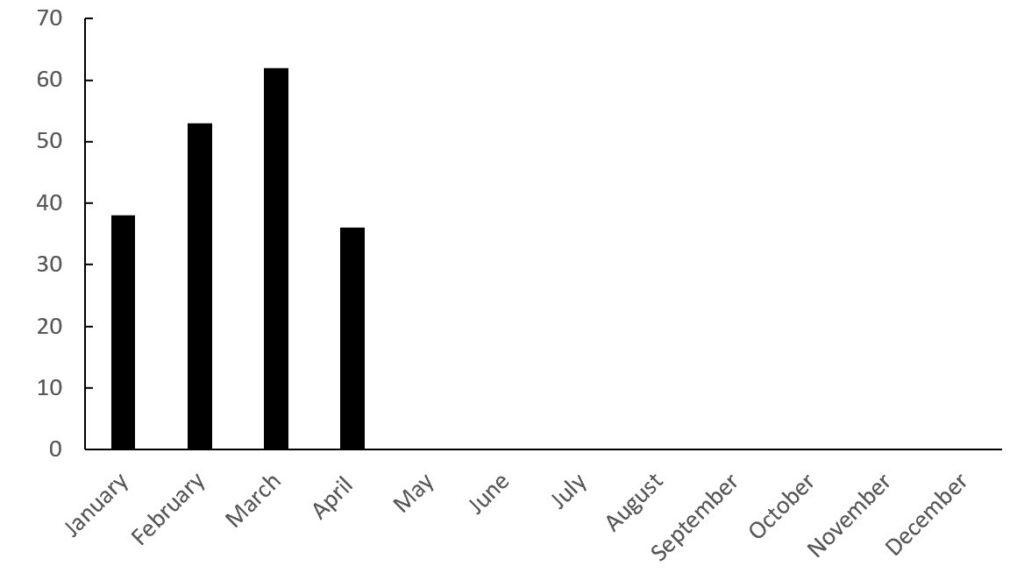
In April 2026 I recorded 36 fatal landslides causing 90 fatalities, the lowest monthly total for 2026 to date.
This is my regular update for the number of fatal global landslides, focusing on March 2026. As usual, this data has been collected in line with the methodology described in Froude and Petley (2018) and in Petley (2012). References are listed below – please cite these articles if you use this analysis. Data presented in these updates should be treated as being provisional at this stage as I will reanalyse them prior to formal publication, and other events will emerge.
The headline figures are as follows:
March 2026: 36 fatal landslides causing 90 fatalities;
This is an interesting result, unusually showing that fatal landslides in April were substantially lower than for any of the preceding months in 2026. This is the updated annual chart by month:-
The number of global fatal landslides in 2026 by month to the end of April.
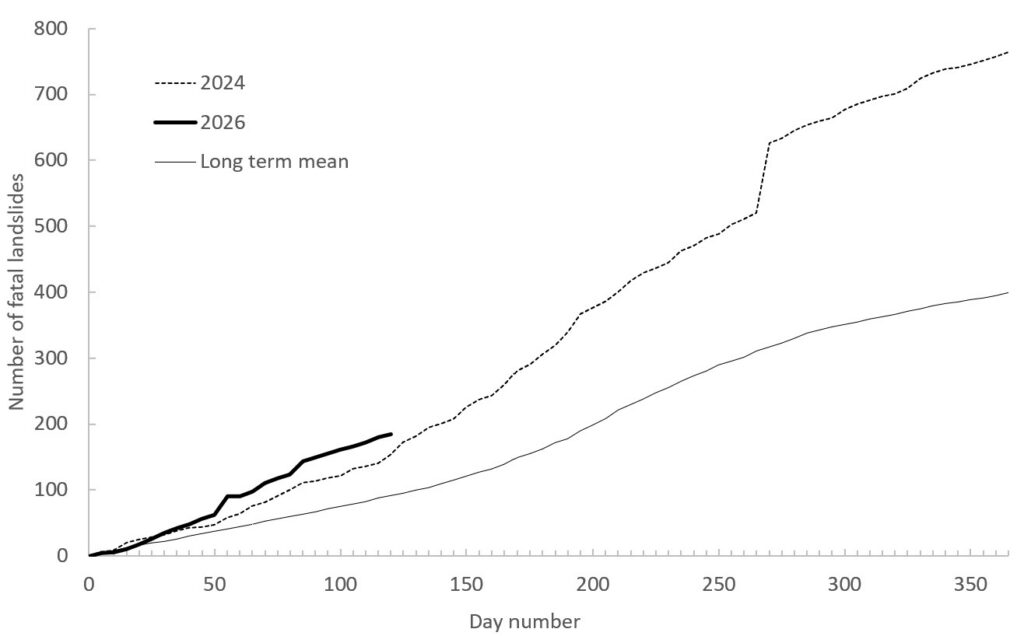
Loyal readers will know that I like to present the running total using pentads (five day blocks). This is the cumulative total pentad graph to the end of Pentad 24 (which captures all of the events to the end of April):-
The cumulative total number of global fatal landslides in 2026 by pentad to the end of April.
Thus, whilst April 2026 was unexceptional compared with the previous months of this year, the number of fatal landslides was still above the long term mean. Overall, 2026 continues to run extremely hot, exceeding even the record-breaking year of 2024.
We now start to enter the crucial period of much higher global fatal landslide occurrence. Whilst in the long term dataset this acceleration typically occurs in June (or even July), in recent years it has happened in May, as the 2024 line shows. I will watch with great interest to see what happens this month.
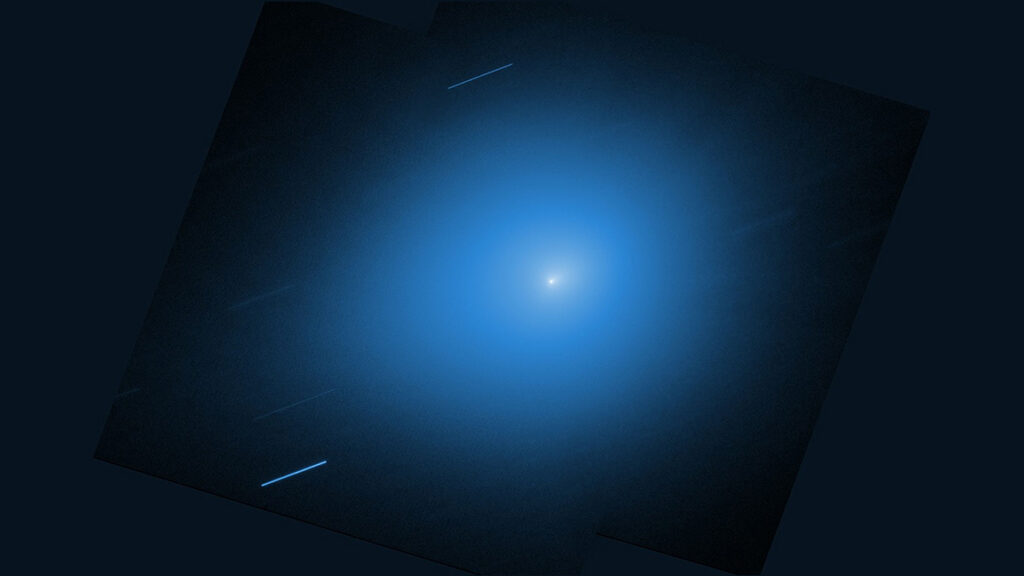
In late 2025, astronomers spotted an interstellar comet making a quick trip through the solar system. 3I/ATLAS was discovered in July when it was just inside Jupiter’s orbit. It’s now about halfway between Jupiter and Saturn and getting farther away every day.
The European Space Agency’s Jupiter Icy Moons Explorer (ESA JUICE) mission, on its way to Jupiter, imaged 3I/ATLAS on 5 November 2025 when the comet was 64 million kilometers from the spacecraft. Credit: ESA/Juice/JANUS, CC BY-SA 3.0 IGO
Astronomers have been observing 3I/ATLAS throughout its journey inward toward the Sun and back out again, compiling the most comprehensive and detailed view thus far of an interstellar object, including the chemistry of the gases that sublimated from its surface and formed its coma and tail.
In a first-of-its-kind observation of an interstellar object (ISO), researchers have discovered that the ratio of deuterium to hydrogen in 3I/ATLAS’s outgassed water is 30–40 times higher than in solar system objects. That suggests that the comet formed in a much colder environment than our own solar system did.
“It is always hard to really pinpoint where these objects form,” said Luis E. Salazar Manzano, the lead researcher on these observations and a doctoral student at the University of Michigan in Ann Arbor. “We know that they were formed in different parts of the galaxy, but it’s hard to connect what we measure with how they were formed. These types of measurements, such as the relative abundance of deuterium to hydrogen in water, are one of the best ways we have to actually [learn] about their forming conditions and their evolution.”
Coming In from the Cold
Water appears to be ubiquitous throughout the universe, sprinkled within distant galaxies and in star-forming nebulae. But there are different flavors of water: heavy, semiheavy, and plain old H2O. In the molecular clouds where stars form, the cold environment favors a chemical reaction that increases the amount of gaseous deuterium (D), an isotope of hydrogen, relative to regular hydrogen atoms. That deuterium then bonds with hydrogen and oxygen atoms to create semiheavy water, or HDO.
By measuring the quantity of semiheavy water relative to regular water in an object, scientists can infer the object’s ratio of deuterium to hydrogen, or D/H, and decode the physical conditions in which that water formed. Astronomers have made such measurements for baby stars, planet-forming disks, solar system comets, and meteorites, as well as Earth’s ocean.
“What is fundamentally important about ISOs is that they are physical leftovers of the process of forming another planetary system and they can give us clues to that process,” said Karen Meech, an astrobiologist at the University of Hawaiʻi at Mānoa who was not involved with this research.
“The conditions in the stellar system in which 3I/ATLAS formed may have been quite different from the one in the solar system.”
The team observed 3I/ATLAS with the Atacama Large Millimeter/submillimeter Array (ALMA) in Chile on November 2025 when the comet was 335 million kilometers (208 million miles) from Earth. It had just passed its closest approach to the Sun and was as bright as it was ever going to be. This timing was critical for the measurements the team wanted to make because the signal for HDO is very subtle, especially when it has to compete with the much more abundant H2O in the comet and within Earth’s atmosphere, Salazar Manzano explained.
Those measurements showed that for every 1,000 hydrogen atoms in 3I/ATLAS, there were about 5–7 deuterium atoms. While that’s not a lot, the ratio is still at least 40 times more than what’s found in ocean water and at least 30 times the average value in solar system comets.
“The conditions in the stellar system in which 3I/ATLAS formed may have been quite different from the one in the solar system,” said Paul Hartogh, a physicist and atmospheric science researcher at the Max Planck Institute for Solar System Research in Göttingen, Germany.
The first interstellar object, 1I/ʻOumuamua, did not outgas any material, and although the second object, 2I/Borisov, did, it was not bright enough to detect deuterium. 3I/ATLAS was the first opportunity astronomers had to measure the D/H ratio of an interstellar comet. Those measurements suggest that 3I/ATLAS formed in a much colder galactic environment than the solar system did, less than 30°C above absolute zero. The team published these results in Nature Astronomy in April.
Planning for the Next Interstellar Visitor
Hartogh, who was not involved with this research, said that on the one hand, 3I/ATLAS’s high deuterium enrichment is surprising because it is higher than that of any known comet. On the other hand, he added, some scientists predicted such high values for cometary water several decades ago.
Meech said she found these results “really interesting.” She never expected all other solar systems to have formed just like ours, and 3I/ATLAS fits with that idea.
“This gives us an intriguing look into the processes of planetary system formation—and that there are differences from our own solar system,” Meech said. “It is too early to tell what this implies for the formation of planets or habitable worlds. We are just at the beginning of an exciting story.”
“The fact that we were able to make this measurement with 3I will allow us to better prepare what to expect with the next generation of interstellar objects.”
3I/ATLAS is getting harder to see with telescopes, but astronomers still have a lot of data from when it was much brighter to go through, Salazar Manzano said. Teams around the world are working on creating a holistic picture of the comet’s chemistry and evolution.
What’s more, “the fact that we were able to make this measurement with 3I will allow us to better prepare what to expect with the next generation of interstellar objects,” Salazar Manzano said.
Scientists expect that the Vera C. Rubin Observatory could discover between 6 and 51 interstellar objects within the next 10 years. If objects are detected early enough in their journey through the solar system, “there may be enough time to coordinate observations with ground-based and spaceborne telescopes, taking advantage of the recent experience gained by the multiple 3I/ATLAS observations,” Hartogh said.
“These are rare opportunities to study another planetary nursery up close, and we have to take advantage of each new ISO to learn as much as we can,” Meech said. “It may be harder for a large number of individual teams to get all the data they want, so I think coordination and collaboration is needed more than ever.”
Citation: Cartier, K. M. S. (2026), Interstellar comet was born in a very cold place, Eos, 107, https://doi.org/10.1029/2026EO260141. Published on 7 May 2026.
Scientists agree that to have a chance of keeping the world’s warming below the Paris Agreement limit of 1.5°C (2.7°F), humanity needs most oil, gas, and coal to remain in the ground. This “unburnable” or “unextractable” carbon would not contribute to global carbon emissions.
But where, exactly, should we prioritize shutting down or banning fossil fuel activities? A new study published in PLoS One provides an answer for the Arctic with an atlas showing where oil and gas activities overlap with vulnerable ecosystems, important wildlife species, and Indigenous land.
“We’re investigating the idea of unburnable carbon with a geographical perspective,” said Daniele Codato, a geographer at the Università de Padova in Italy and lead author of the new study. “We focus on where to keep oil and gas underground.”
The atlas is meant to help decisionmakers prioritize areas where it is essential to avoid opening new frontiers or where current oil and gas extraction should be halted because of social, cultural, ecological, or climate justice criteria, he said.
Overlaps, Mapped
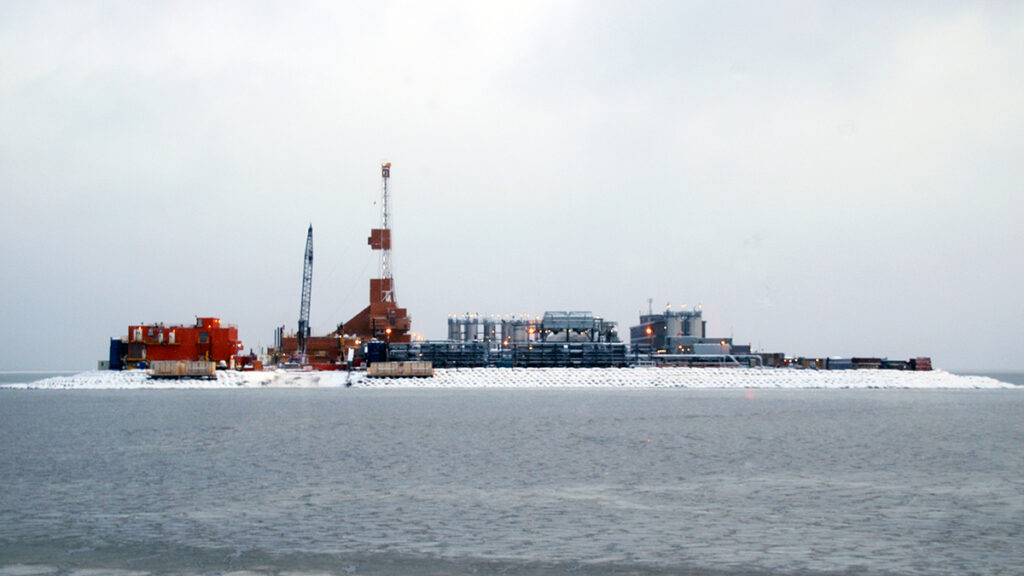
Codato and a team of researchers created their Arctic atlas with dozens of public datasets from five Arctic polities known to have oil and gas activities (Alaska (United States), Canada, Greenland (Denmark), Norway, and Russia). Though various geographic definitions of the Arctic exist, the team chose a boundary used to evaluate wildlife and conservation by the Conservation of Arctic Flora and Fauna (the biodiversity working group of the Arctic Council, an intergovernmental organization focused on Arctic governance) to include the largest possible portion of vulnerable ecosystems.
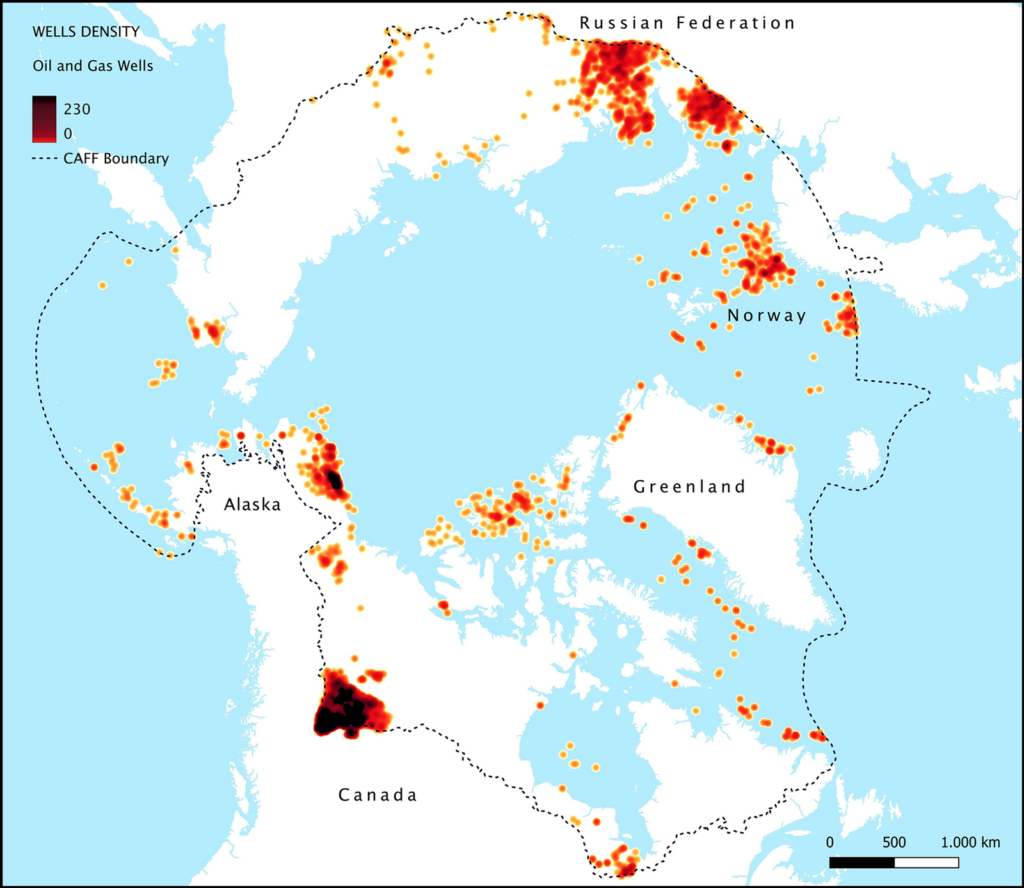
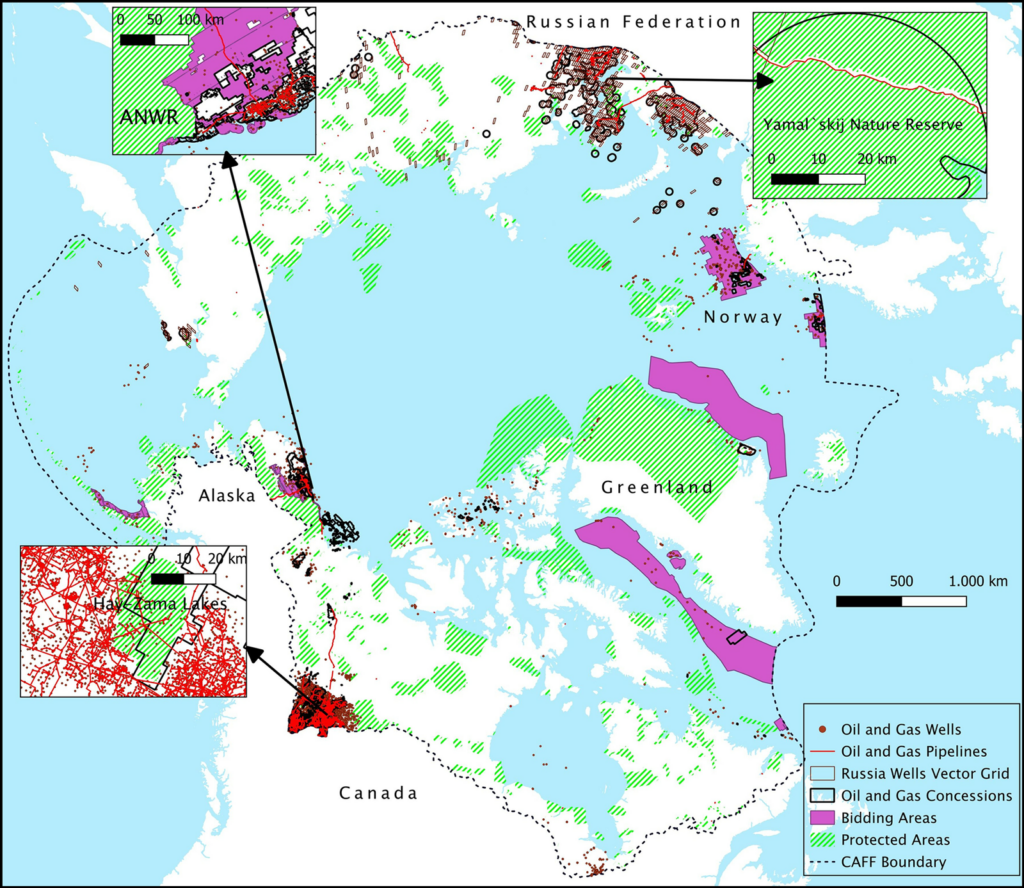
The resulting maps revealed more than 512,000 square kilometers—an area about the size of Spain—of Arctic territory with existing or planned fossil fuel activities, including leases, areas under bid, exploration licenses, and infrastructure. Within those areas, the researchers counted 44,539 active wells and nearly 40,000 kilometers (about 25,000 miles) of pipelines.
Oil and gas wells in the Arctic are highly concentrated in northwestern Canada, northern Alaska, and northern Russia. The CAFF boundary identifies the Arctic region as defined by the Conservation of Arctic Flora and Fauna (the biodiversity working group of the Arctic Council). Click image for larger version. Credit: Codato et al., 2026, https://doi.org/10.1371/journal.pone.0345775
Next, the researchers determined how oil and gas activities overlapped with protected areas defined by the International Union for Conservation of Nature and conservation priority areas defined by three other nongovernmental organizations. Fossil fuel activities threaten wildlife by altering habitats, disrupting migratory routes, and releasing pollutants.
Of the area containing oil and gas activities, more than 7% overlapped with ecologically protected areas, and more than 13% overlapped with the ranges of all of the three key Arctic species considered in the study: polar bears, yellow-billed loons, and caribou. The highest concentrations of oil and gas activities were in the Yamal Peninsula of Russia, northwestern Canada, and the North Slope of Alaska, all home to fragile ecosystems.
Seven percent of Arctic fossil fuel extraction areas mapped by the research team overlapped with ecologically protected areas. In some cases, such as in the Yamal`skij Nature Reserve in Russia (top right), protected area borders have been cut or delimited to avoid overlapping with protected area boundaries, possibly indicating that protected areas have been downsized or redesigned to accommodate fossil fuel infrastructure. ANWR = Arctic National Wildlife Refuge. Click image for larger version. Credit: Codato et al., 2026, https://doi.org/10.1371/journal.pone.0345775
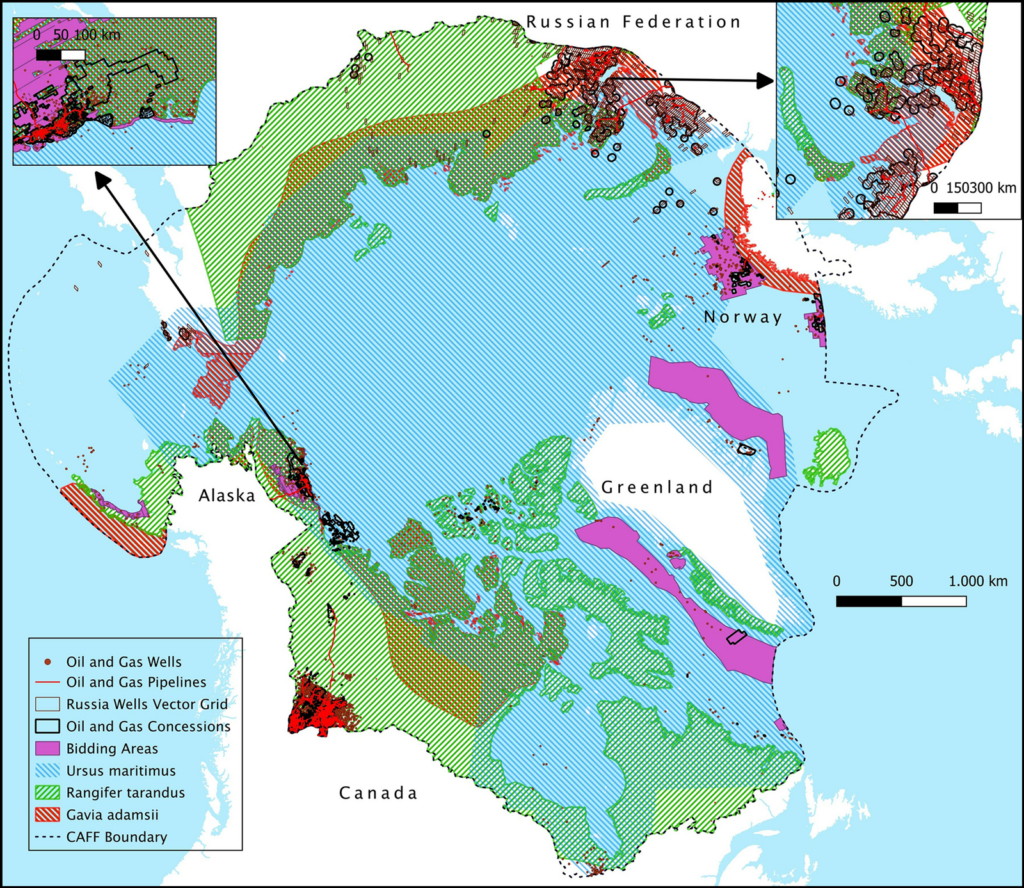
Mapping revealed that 87.21% of leases in Alaska and more than 13% of total Arctic concessions for fossil fuel activities overlapped with the ranges of all three of the key Arctic species considered in the study (polar bears (Ursus maritimus), caribou (Rangifer tarandus), and yellow-billed loons (Gavia adamsii)). Click image for larger version. Credit: Codato et al., 2026, https://doi.org/10.1371/journal.pone.0345775
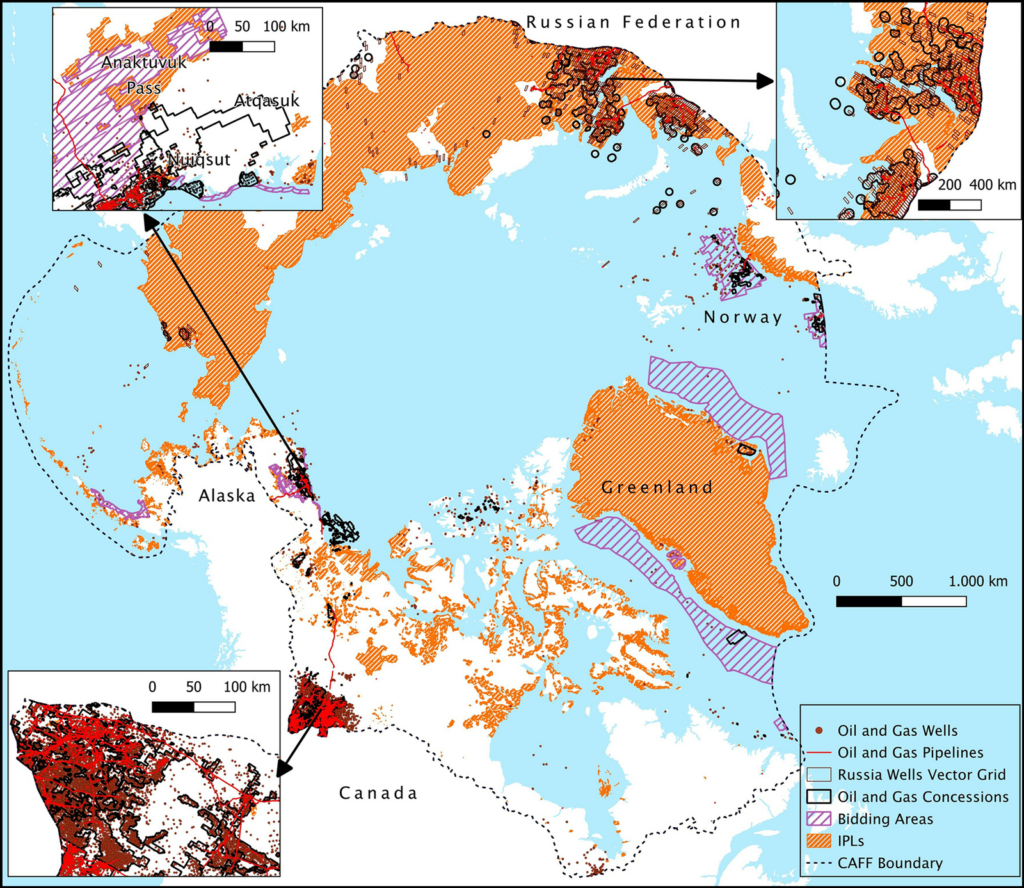
The researchers also discovered that 73% of land with oil and gas activities overlapped with Indigenous Peoples’ lands, defined in the study as lands where Indigenous communities maintain significant influence over land management. Fossil fuel activities can threaten Indigenous communities’ health and ways of life, though the authors note that overlaps between Indigenous Peoples’ lands and fossil fuel activities do not necessarily indicate an opposition between the two.
Oil and gas concessions cover more than 4% of Indigenous Peoples’ lands (IPLs) in the Arctic. Click image for larger version. Credit: Codato et al., 2026, https://doi.org/10.1371/journal.pone.0345775
“It’s a really interesting idea to create an atlas of unburnable carbon and try to make visible where tensions might occur between Indigenous land, ecosystems, [and fossil fuel activities],” said Mariel Kieval, a researcher at the Arctic Institute, a nonprofit research organization. The overlaps noted in the atlas are an “initial indicator” providing opportunities for further research that zooms in on specific areas, she said.
Kieval also said the atlas could be helpful for local communities trying to identify where extraction activities are occurring nearby.
Policy Paradigm
The atlas’s effort to express the urgency of action to the public and policymakers is useful, said Paul Ekins, an economist at University College London who was part of the team that coined the term “unburnable carbon.” “Any way in which atlases or discussions or slogans can up the political ante so that politicians become braver in seeking to address this issue is to be welcomed.”
In particular, Codato hopes the atlas will fuel a “paradigm shift” in global policy that would ultimately ban the proliferation of fossil fuel activities in the Arctic.
The need for an intergovernmental ban on fossil fuel activities is evidenced by the Arctic National Wildlife Refuge in Alaska, Codato said: The refuge received temporary protections against drilling under the Biden administration, but the Trump administration plans to open the refuge for oil and gas leases this summer. “We need something stronger” to avoid such administration-by-administration changes in Arctic protections, he said.
“If we don’t start to ban fossil fuels in the Arctic now, it could become another sacrifice zone.”
Such a paradigm shift will be more important than ever as warming in the Arctic provides new access to resources and opportunities for trade that may accelerate ecological and cultural disruptions. “If we don’t start to ban fossil fuels in the Arctic now, it could become another sacrifice zone,” like some parts of the Amazon rainforest, Codato said.
Policy actions have fallen far behind the science, Ekins said. “There should have been an agreement not to exploit fossil fuels in the Arctic well before the ice had melted to a sufficient extent to make that a practical possibility.”
In 2023, the research team published a similar atlas identifying unburnable carbon in the Ecuadorian Amazon and plans to continue to expand their atlas to include the rest of the world. The team is currently working on projects that cover Brazil, Italy, Nigeria, and the United Kingdom.
Citation: van Deelen, G. (2026), This Arctic atlas shows where oil and gas activities overlap with wildlife and Indigenous communities, Eos, 107, https://doi.org/10.1029/2026EO260139. Published on 7 May 2026.
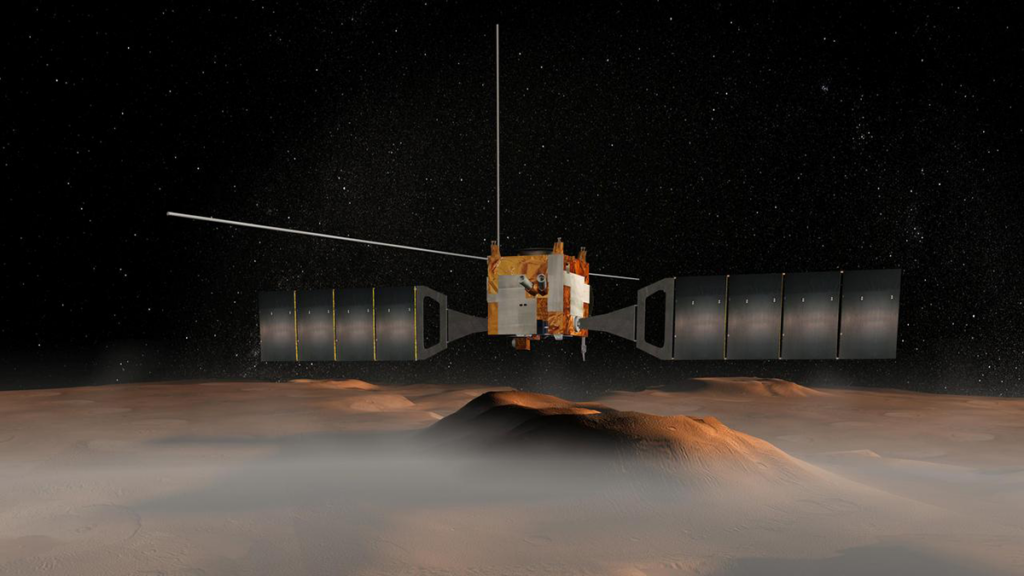
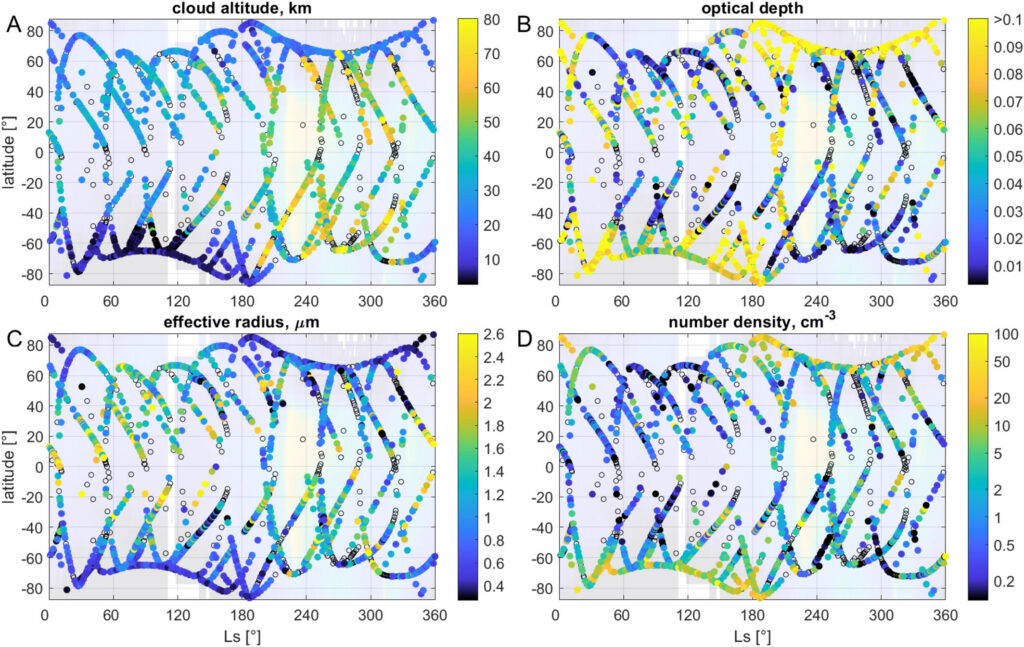
Dust and water ice clouds are ubiquitous on Mars; they regulate the planet’s climate and can affect measurements of other atmospheric components. Constraining their spatial and temporal variability is also essential for improving Martian general circulation models.
Fedorova et al. [2026] use solar occultation measurements from the SPICAM infrared spectrometer on board the Mars Express orbiter to characterize nine Martian years (MY 28 through 36) of dust and water ice clouds. Because the spectrometer could not distinguish between these particles’ types, the researchers employ a new method integrating Mars Climate Sounder data and general climate model predictions to identify them.
The analysis reveals that the particles can reach altitudes up to 80 kilometers during perihelion, while their size remains relatively uniform with height. This suggests that Martian dust distribution is driven more by atmospheric dynamics and horizontal transport, capable of lifting and moving particles over vast distances, rather than by turbulent mixing against gravity alone.
The study also provides a detailed seasonal and spatial climatology of major Martian atmospheric features, including the Polar Hood Clouds, the Aphelion Cloud belt, and the Mesospheric Clouds. The detection of high-altitude clouds (70–90 km) during dust events confirms enhanced transport of water vapor into the upper atmosphere during both global and regional storms. These findings are consistent with simultaneous observations from the Atmospheric Chemistry Suite on the Trace Gas Orbiter.
These observations show that large-scale atmospheric dynamics, rather than local mixing alone, control how aerosols are distributed vertically on Mars, with important implications for the transport of water to the upper atmosphere and the planet’s climate evolution.
The figure shows how the water ice cloud layers vary with latitude and season (Ls), based on SPICAM observations. (a) altitude of the cloud layer in kilometers; (b) thickness of the cloud (optical depth); (c) average size of the ice particles in micrometers; and (d) number of particles within the layer (number density. The background color is the amount of dust in the atmosphere from Montabone et al. [2015]: red areas indicate high dust levels, while dark blue areas indicate low dust. Black open circles mark locations where no clear water ice clouds were detected. Credit: Fedorova et al. [2026], Figure 12
Citation: Fedorova, A. A., Luginin, M., Montmessin, F., Korablev, O. I., Bertaux, J.-L., Stcherbinine, A., & Lefèvre, F. (2026). Multiyear monitoring of aerosol vertical distribution on Mars by SPICAM IR/MEX. Journal of Geophysical Research: Planets, 131, e2025JE009388. https://doi.org/10.1029/2025JE009388
—Arianna Piccialli, Associate Editor, and Beatriz Sanchez-Cano, Editor, JGR: Planets
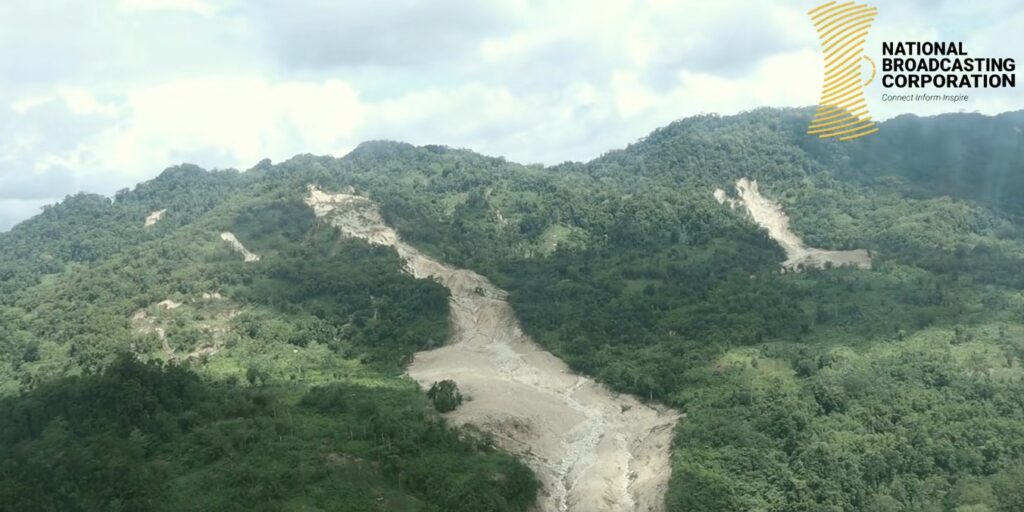
A wonderful new paper on the huge Tracy Arm landslide and tsunami will have profound but challenging implications for the management of risk in an age of increased tourism and rapid climate change.
The journal Science has published an excellent new paper (Shugar et al. 2026) that examines the extraordinary 10 August 2025 landslide and tsunami at Tracy Arm fjord in Alaska. The paper is open access, so you can read it for yourself (it is very accessible), and there has been a plethora of media coverage (quite rightly).
That large landslides occur in fjords is not a surprise, and that they can generate enormous displacement waves is also not news. We know that landslide occurrence in these environments in general is increasing, and specifically so in Alaska. However, this paper is the most comprehensive and systematic analysis of such an event, and it has shown the remarkable threat that these events can generate. The tsunami created by this landslide had a 481 metre run-up; it is remarkable that there were no fatalities. If a large cruise ship had been in the area, with passengers being ferried ashore on small boats and exploring the shoreline, the consequences would have been catastrophic. It is unsurprising then that cruise companies are now amending their itineraries.
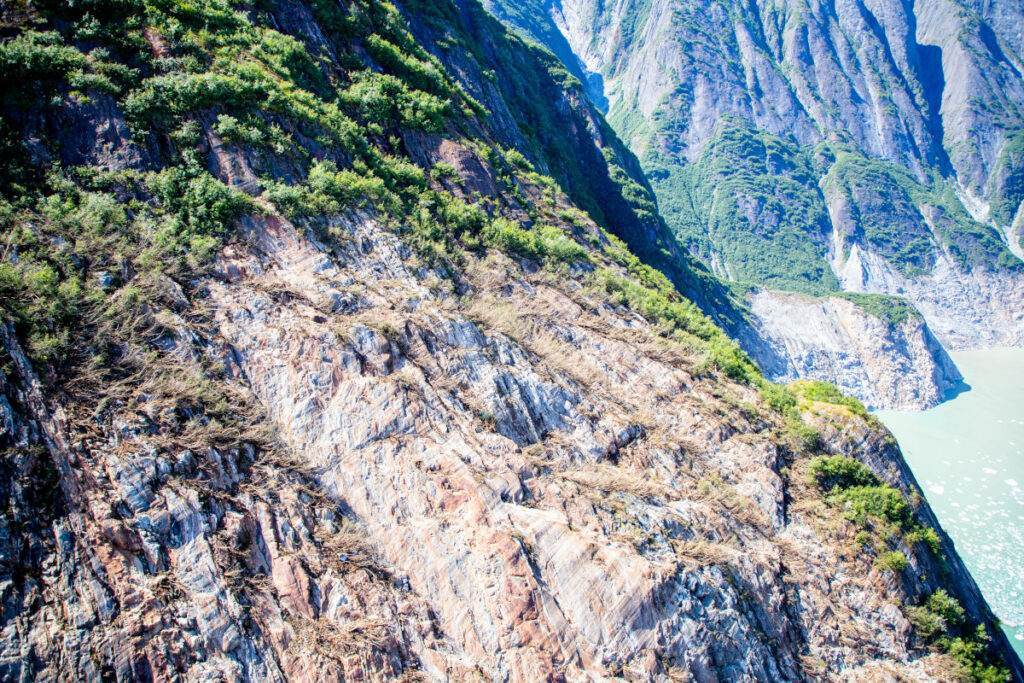
The USGS released the image below of the aftermath of the landslide and tsunami – scale is hard to understand in such images, but the crown of the landslide is over 1,000 metres above the level of the fjord, and the landslide had a subaerial volume of over 63 million cubic metres.
This aerial photo shows the north side of Alaska’s Tracy Arm Fjord in the aftermath of the 2025 landslide and tsunami. The lighter-colored rock is the exposed surface, where the mountainside collapsed and fell into the water. The foot of South Sawyer Glacier is visible at lower right; in decades past, the ice extended much farther and was thick enough to hold the rock slopes in place. Credit: Cyrus Read/U.S. Geological Survey
Shugar et al. (2026) has a brief section that examines the implications of this event, and of the understanding that it provides of the hazards posed by very large landslides in fjord settings. These are locations with extensive human activity – local communities, trade, fishing and tourism. There is some evidence that these landsldies are more likely to occur in the spring and summer months, when human occupation is higher. Our resilience to a tsunami wave that starts off being hundreds of metres high is low.
A case in point lies in Milford Sound in New Zealand, where (for example) an earthquake on the Alpine Fault has the potential to trigger a large landslide that could result in a major tsunami. Milford Sound is an extremely popular tourism location. Should such an event occur, and mass fatalities result, there is no doubt that the public inquiry would find that the societal risk was known and that it was probably unacceptable. However, to ban tourism, including cruise ships, in this area would carry heavy risks in its own right – it would profoundly impact the vital tourist economy of the area, on which many livelihoods depend. This is a substantial risk in its own right, and of course politics plays a major part too. Balancing these risks is a major challenge for any society.
Some hope is offered by the fact that this landslide showed substantial precursory seismic activity, which might represent a route to providing a warning for at least some of these rock slope failures. But research in this area is immature at the moment, and of course there will be no warning for a landslide triggered by a major earthquake.
So, the landslide at Tracy Arm fjord presents us with a host of major challenges, but it also represents a big step forward in our understanding of these events. Well done to Dan and his colleagues for another brilliant paper. I shall watch the debate with great interest.
This massive landslide produced a tsunami that reached 481 meters on the opposite side of the fjord—higher than all but the world’s 14 tallest buildings—and registered on seismic detectors around the globe. For days after the slope collapsed, the waters of the fjord churned with a standing wave known as a seiche.
This drone video shows a man paddling through the iceberg-filled Tracy arm fjord in the aftermath of a landslide. Credit: Bill Billmeier
This event was the second-largest tsunami ever recorded and the largest not linked to an earthquake. A new paper published in Science presented strong evidence that the Tracy Arm landslide was instead the result of the rapid retreat of South Sawyer Glacier, itself a consequence of global climate change.
“It’s like if you have a kid and they said they cleaned their room but really all they did was throw everything in the closet. As soon as you open that door, everything falls out.”
Nobody was harmed by the rockslide or tsunami, but cruise ships were scheduled to visit the fjord later that morning. If the collapse had happened just a few hours later, it could have been disastrous.
“While the [South Sawyer] Glacier is in the fjord, it’s supporting those valley walls, like the buttresses on a cathedral,” said Daniel Shugar, a geomorphologist at the University of Calgary who led the study. “As that glacier retreated over the last few decades, it retreated just past the spot that did fail. It’s like if you have a kid and they said they cleaned their room but really all they did was throw everything in the closet. As soon as you open that door, everything falls out.”
This animation shows an overhead view of the 10 August 2025 Tracy Arm landslide. Credit: Patrick Lynett, University of Southern California
In other words, the glacier that carved the fjord in the first place was also holding its slopes in place, and the ice’s retreat under warming temperatures exposed rock that became vulnerable to crumbling. The proximate cause of the landslide might have been something else—as Shugar noted, rainfall is plentiful in that part of Alaska, which could have weakened the fjord’s walls further—but it might also have been a combination of small, individually insignificant factors. In any case, the removal of that glacial “closet door” was what made the collapse and tsunami possible.
“We know that steep slopes are very sensitive to the things that climate [change] is exacerbating, whether it’s losing permafrost, glacier retreating, or more water in the soil,” said glaciologist Leigh Stearns of the University of Pennsylvania, who was not involved with the Tracy Arm study. “Often, we think of glacier retreat as a long and continuous thing, but [it] can trigger sudden catastrophic events.”
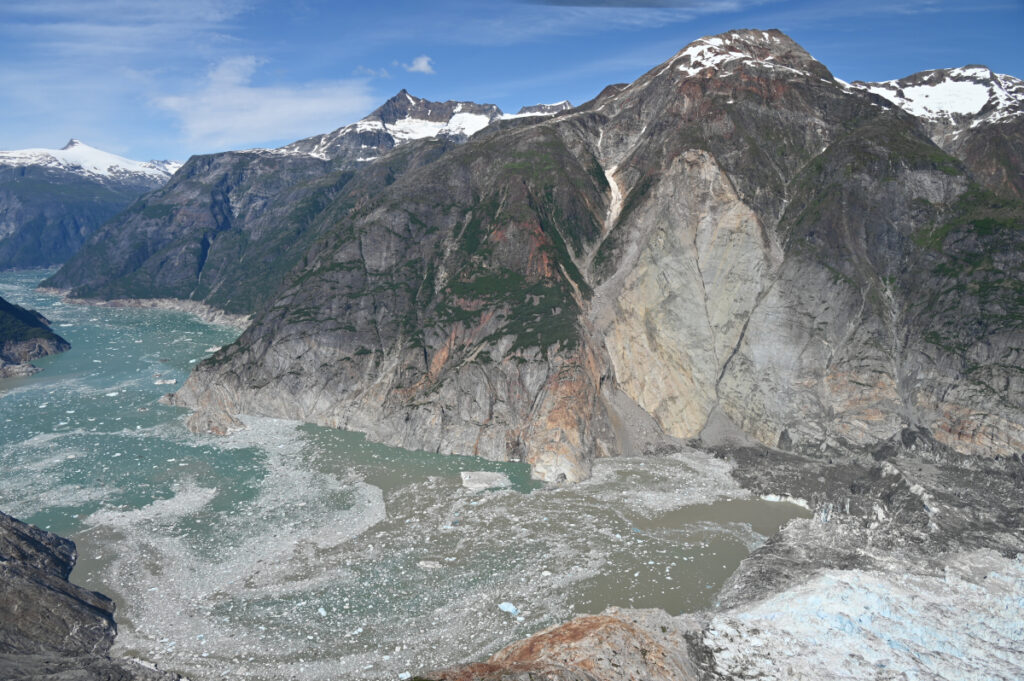
This aerial photo shows the highest run-up resulting from the 10 August 2025 landslide-triggered tsunami in Tracy Arm. It was captured during a U.S. Geological Survey field reconnaissance overflight on 13 August 2025. Credit: John Lyons/U.S. Geological Survey.
The Tracy Arm tsunami, like the record-setting Lituya Bay 524-meter megatsunami in 1958, was so dramatic in part because it happened in a fjord. The steep sides of the relatively narrow channel concentrated the energy generated by the rockfall into water.
A drone video shows the tsunami-affected part of the fjord, including the highest run-up area and the landslide itself. Credit: Bill Billmeier
Unlike Lituya Bay, which resulted from an earthquake, Tracy Arm provided very little seismic warning before the slope collapsed, requiring forensic work to determine what caused it.
Shugar noted that South Sawyer Glacier had retreated by roughly 500 meters in the spring of 2025 alone, on top of the general trend of shrinking and thinning over the decades. And it’s not alone: Interferometric synthetic aperture radar (InSAR) images taken by satellites indicate that many slopes in Alaska and beyond are in motion, pointing to potential future danger.
“Not every single one, but it seems like a huge majority of [shifting slopes] are above the lower parts of thinning glaciers,” Shugar said. He described this phenomenon as “debuttressing,” as in losing the glacial buttress holding a slope up. He added, “I think in the next 5 years or so, we’ll probably have a much better understanding of just how and how quickly slopes respond to that debuttressing.”
Threats, Hazards, and Climate Change
“We were unbelievably lucky that the [tsunami] occurred with the timing that it did, and not 5 hours later.”
Most tsunamis are set in motion by earthquakes and travel across the open ocean, wreaking their destruction when they reach shallower water near coasts; the word “tsunami” means “harbor wave” in Japanese. The Tracy Arm tsunami joined the ranks of other landslide-driven tsunamis, like the ones in Taan Fiord (Alaska) and Dixon Fjord (Greenland), in being linked to human-driven climate change. Beyond the immediate impact of the waves, this category of hazard requires rethinking potential risks from abrupt catastrophes like debuttressing as well as slower effects such as sea level rise.
“The risk to any particular cruise ship [from a tsunami] on any particular day is very low,” Shugar said. “We were unbelievably lucky that the [tsunami] occurred with the timing that it did, and not 5 hours later. The risk certainly still could be increasing as we build new settlements, new mining camps, or new oil and gas infrastructure.”
Both Shugar and Stearns highlighted the importance of learning lessons from Tracy Arm and related events.
“Climate is a threat multiplier, and the research is really forcing us to look at these cascading hazards,” Stearns said. Tracy Arm “is one example of this: Small slow changes can trigger big events. Hopefully, we don’t need so many disasters to spur some change.”
A drone video shows Sawyer Island in the Tracy Arm Fjord and evidence of the tsunami on the fjord walls. Credit: Bill Billmeier
This aerial photo shows the north side of Alaska’s Tracy Arm Fjord in the aftermath of the 2025 landslide and tsunami. The lighter-colored rock is the exposed surface, where the mountainside collapsed and fell into the water. The foot of South Sawyer Glacier is visible at lower right; in decades past, the ice extended much farther and was thick enough to hold the rock slopes in place. Credit: Cyrus Read/U.S. Geological Survey
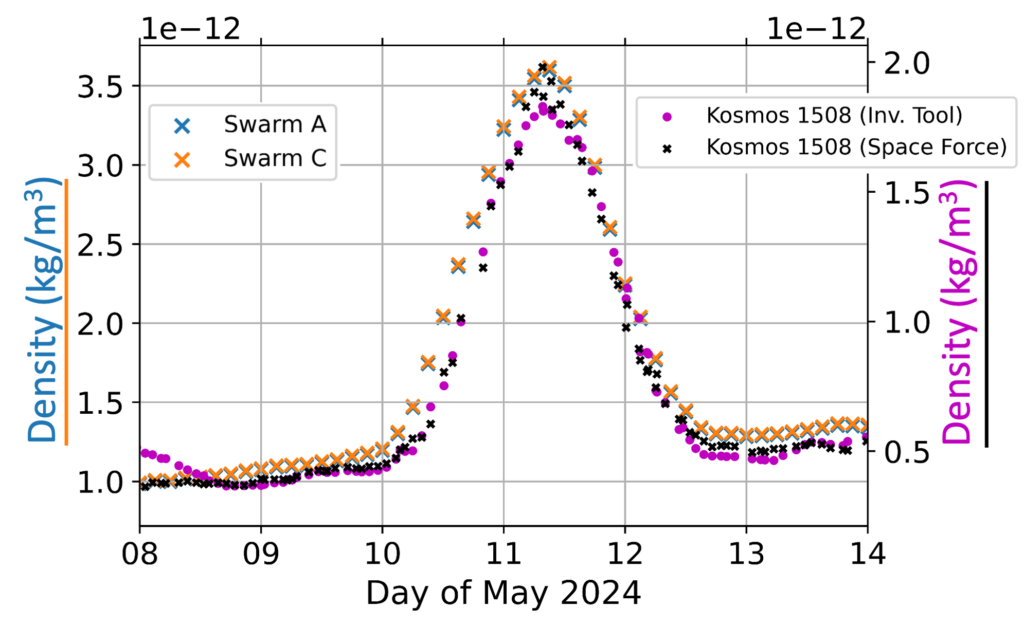
In low Earth orbit (typically below about 700 kilometers altitude), atmospheric drag is the primary source of uncertainty when predicting the trajectories of satellites. These prediction errors largely arise from limitations and inaccuracies in the models used to estimate the density of the upper atmosphere, particularly within the thermosphere.
Mutschler et al. [2026] introduce a new method for estimating atmospheric density along the path of an individual satellite by using Energy Dissipation Rates (EDRs). The derived single-satellite density measurements provide valuable insight into variations in thermospheric density and can help characterize how the upper atmosphere responds to disturbances such as geomagnetic storms. Incorporating these observations can contribute to ultimately improving the accuracy of satellite orbit predictions.
Effective density and Space Force effective density estimated by the Kosmos 1508 satellite (plotted on the right-hand y axes) compared to estimates from satellites Swarm-A and Swarm-C (plotted on the left-hand y-axes). Credit: Mutschler et al. [2026], Figure 17a
Citation: Mutschler, S., Pilinski, M., Zesta, E., Oliveira, D. M., Delano, K., Garcia-Sage, K., & Tobiska, W. K. (2026). First results of a new inversion tool for thermospheric neutral mass density computations during severe geomagnetic storms. AGU Advances, 7, e2025AV002079. https://doi.org/10.1029/2025AV002079