The study also points to broader lessons: as glaciers retreat in warming regions, the risk of related hazards can increase, and improved monitoring may help reduce some of those dangers.
This massive landslide produced a tsunami that reached 481 meters on the opposite side of the fjord—higher than all but the world’s 14 tallest buildings—and registered on seismic detectors around the globe. For days after the slope collapsed, the waters of the fjord churned with a standing wave known as a seiche.
This drone video shows a man paddling through the iceberg-filled Tracy arm fjord in the aftermath of a landslide. Credit: Bill Billmeier
This event was the second-largest tsunami ever recorded and the largest not linked to an earthquake. A new paper published in Science presented strong evidence that the Tracy Arm landslide was instead the result of the rapid retreat of South Sawyer Glacier, itself a consequence of global climate change.
“It’s like if you have a kid and they said they cleaned their room but really all they did was throw everything in the closet. As soon as you open that door, everything falls out.”
Nobody was harmed by the rockslide or tsunami, but cruise ships were scheduled to visit the fjord later that morning. If the collapse had happened just a few hours later, it could have been disastrous.
“While the [South Sawyer] Glacier is in the fjord, it’s supporting those valley walls, like the buttresses on a cathedral,” said Daniel Shugar, a geomorphologist at the University of Calgary who led the study. “As that glacier retreated over the last few decades, it retreated just past the spot that did fail. It’s like if you have a kid and they said they cleaned their room but really all they did was throw everything in the closet. As soon as you open that door, everything falls out.”
This animation shows an overhead view of the 10 August 2025 Tracy Arm landslide. Credit: Patrick Lynett, University of Southern California
In other words, the glacier that carved the fjord in the first place was also holding its slopes in place, and the ice’s retreat under warming temperatures exposed rock that became vulnerable to crumbling. The proximate cause of the landslide might have been something else—as Shugar noted, rainfall is plentiful in that part of Alaska, which could have weakened the fjord’s walls further—but it might also have been a combination of small, individually insignificant factors. In any case, the removal of that glacial “closet door” was what made the collapse and tsunami possible.
“We know that steep slopes are very sensitive to the things that climate [change] is exacerbating, whether it’s losing permafrost, glacier retreating, or more water in the soil,” said glaciologist Leigh Stearns of the University of Pennsylvania, who was not involved with the Tracy Arm study. “Often, we think of glacier retreat as a long and continuous thing, but [it] can trigger sudden catastrophic events.”
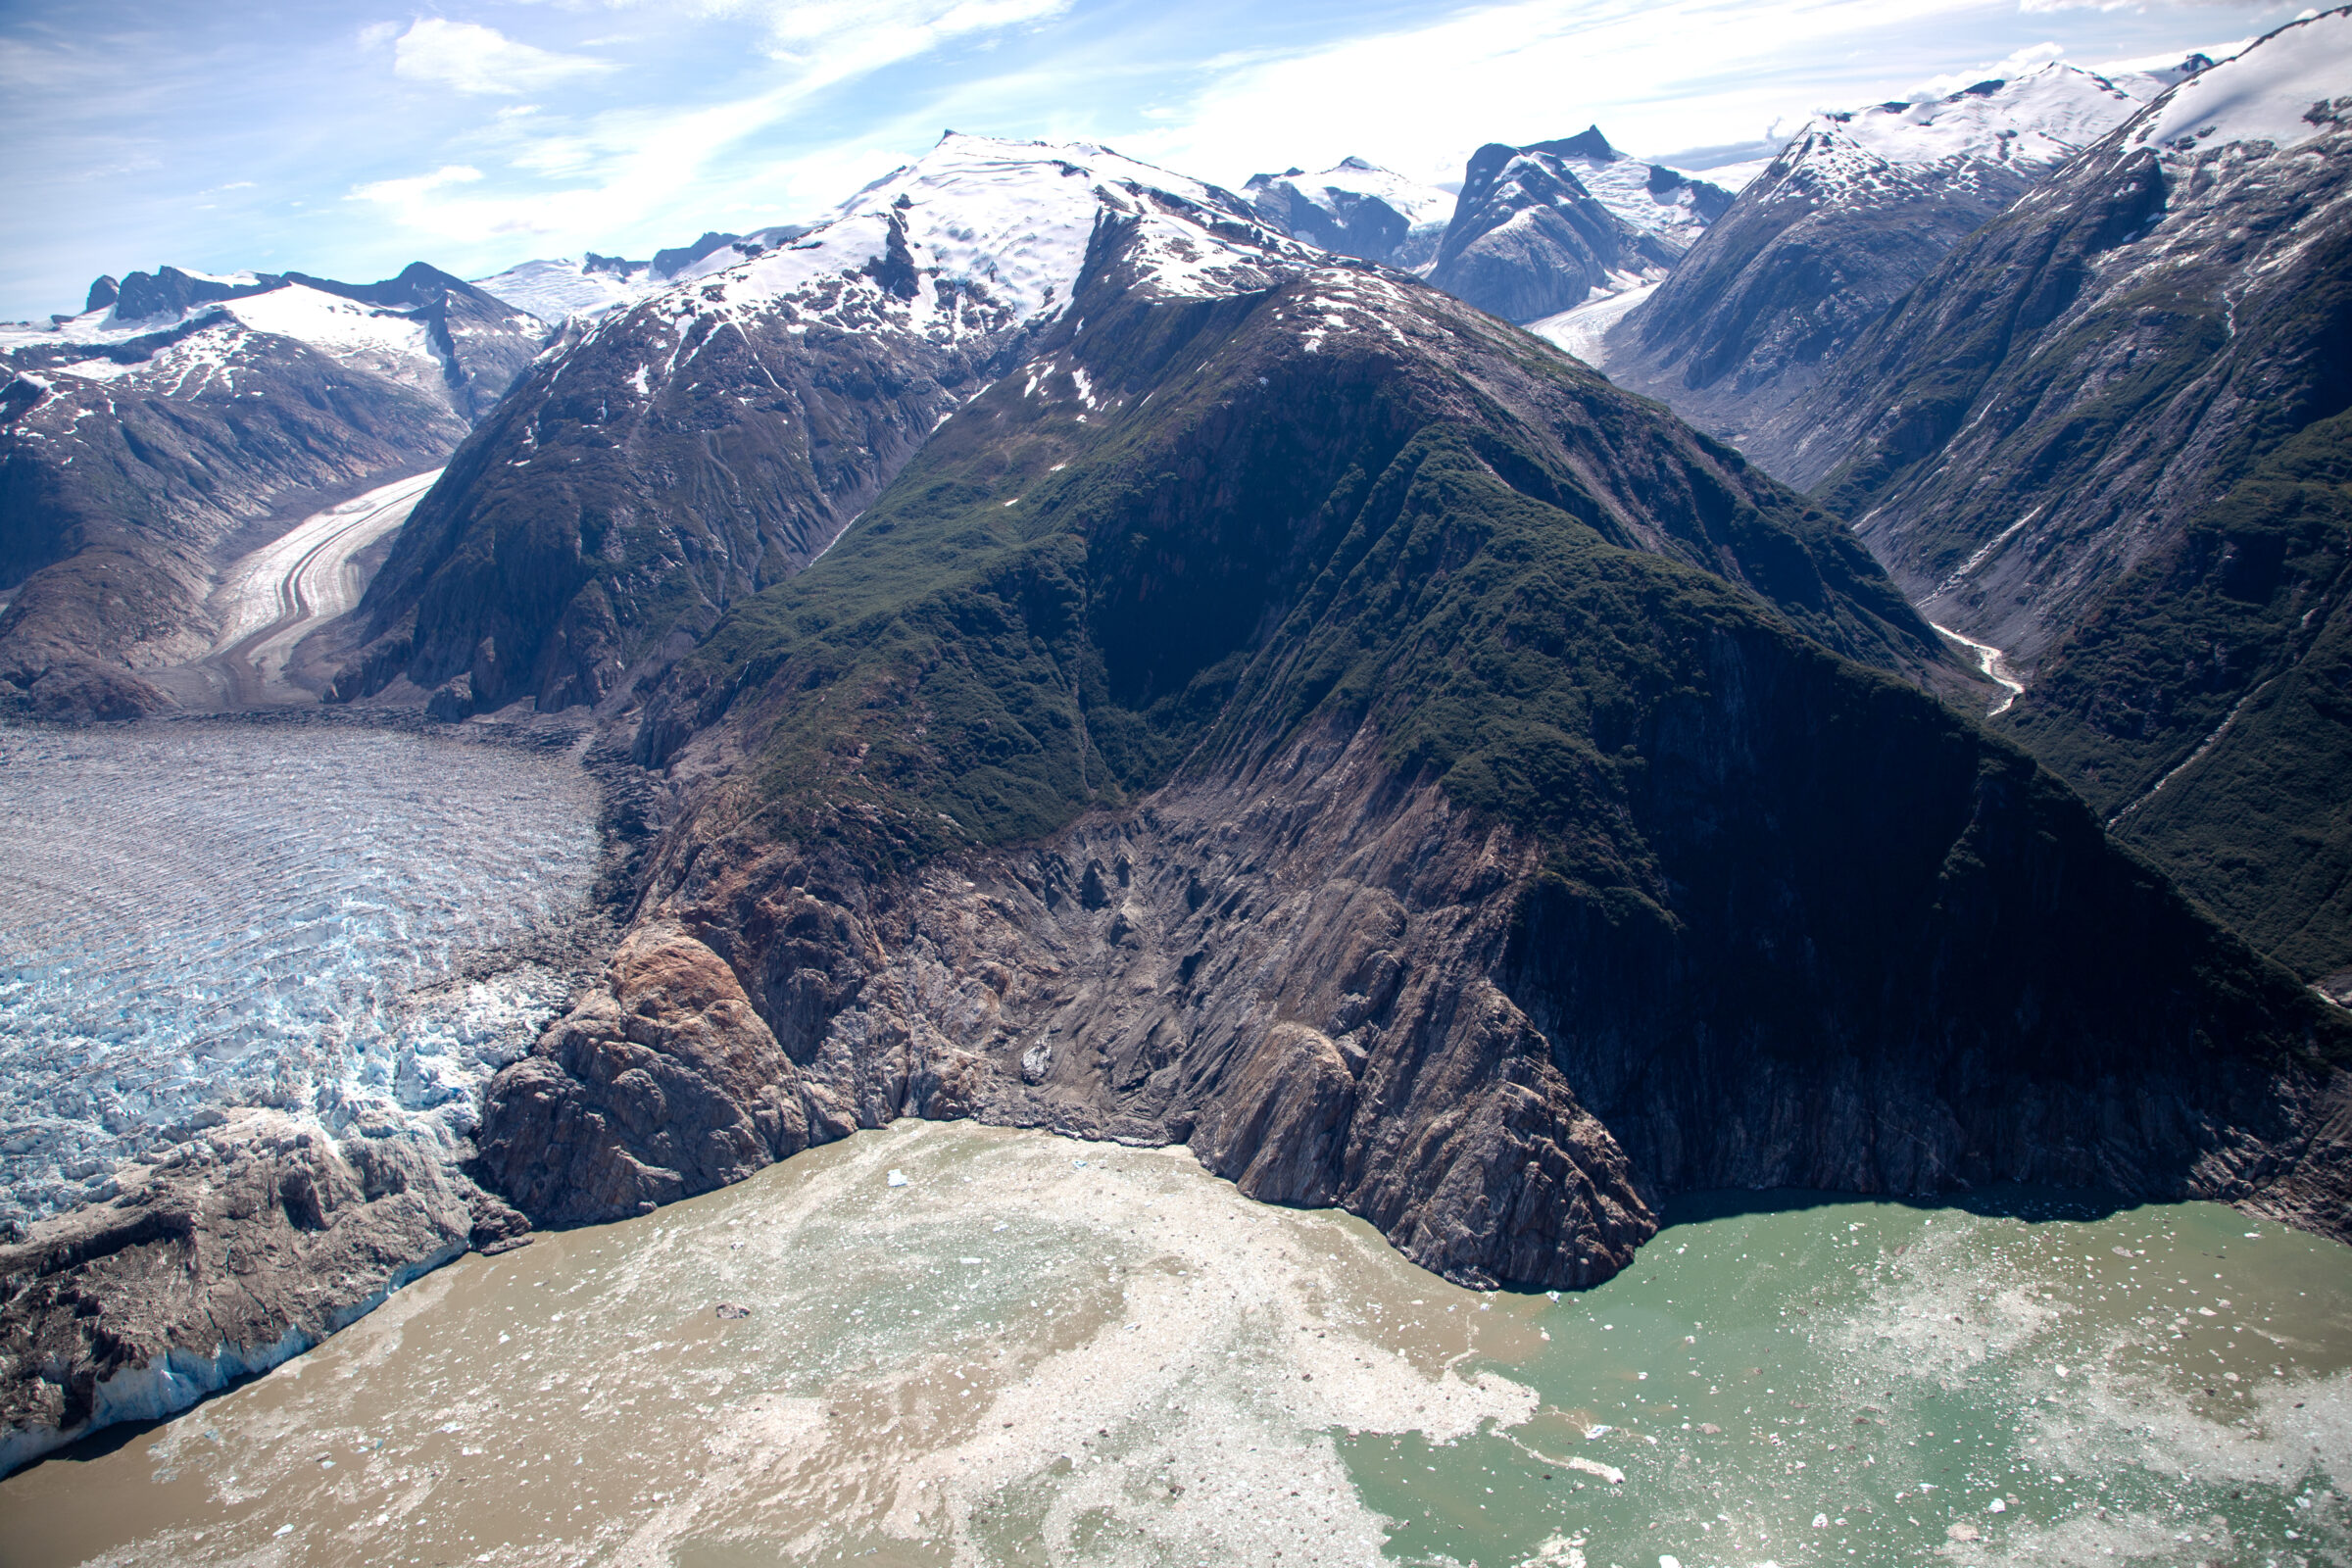
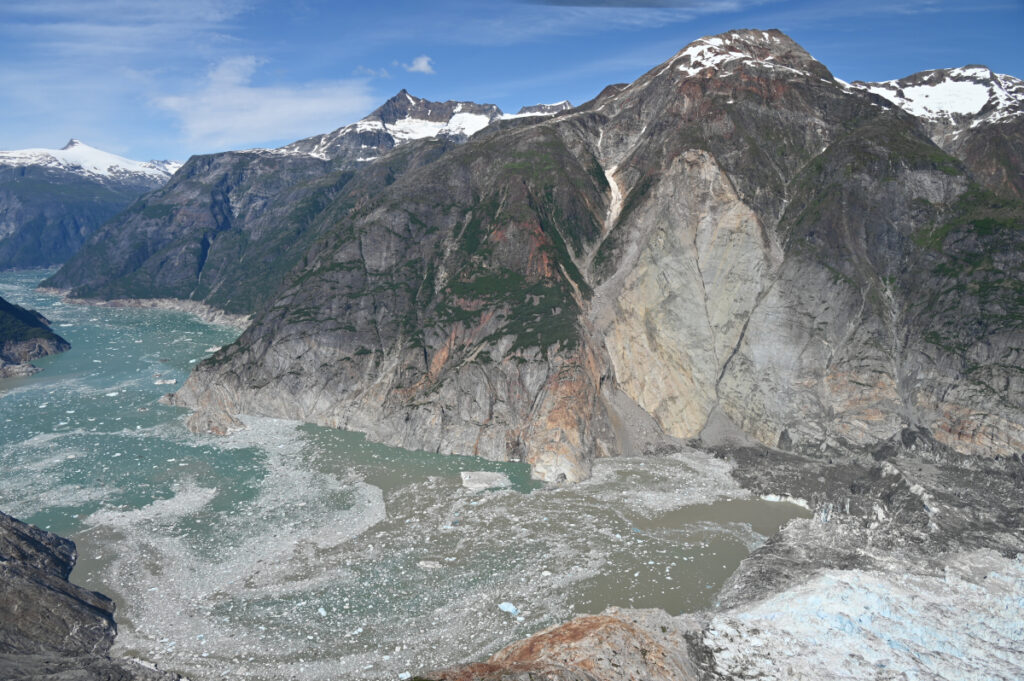
This aerial photo shows the highest run-up resulting from the 10 August 2025 landslide-triggered tsunami in Tracy Arm. It was captured during a U.S. Geological Survey field reconnaissance overflight on 13 August 2025. Credit: John Lyons/U.S. Geological Survey.
The Tracy Arm tsunami, like the record-setting Lituya Bay 524-meter megatsunami in 1958, was so dramatic in part because it happened in a fjord. The steep sides of the relatively narrow channel concentrated the energy generated by the rockfall into water.
A drone video shows the tsunami-affected part of the fjord, including the highest run-up area and the landslide itself. Credit: Bill Billmeier
Unlike Lituya Bay, which resulted from an earthquake, Tracy Arm provided very little seismic warning before the slope collapsed, requiring forensic work to determine what caused it.
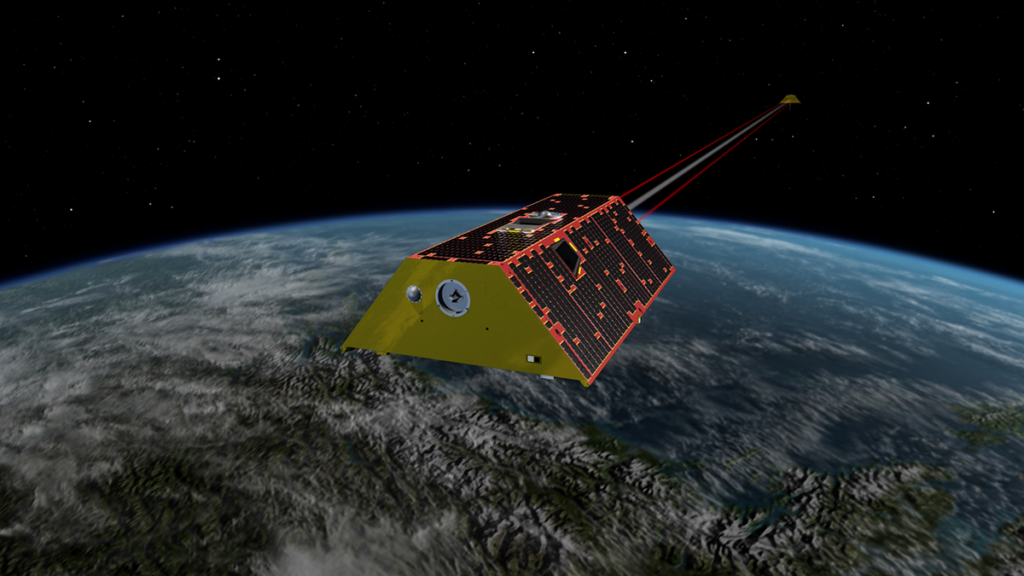
Shugar noted that South Sawyer Glacier had retreated by roughly 500 meters in the spring of 2025 alone, on top of the general trend of shrinking and thinning over the decades. And it’s not alone: Interferometric synthetic aperture radar (InSAR) images taken by satellites indicate that many slopes in Alaska and beyond are in motion, pointing to potential future danger.
“Not every single one, but it seems like a huge majority of [shifting slopes] are above the lower parts of thinning glaciers,” Shugar said. He described this phenomenon as “debuttressing,” as in losing the glacial buttress holding a slope up. He added, “I think in the next 5 years or so, we’ll probably have a much better understanding of just how and how quickly slopes respond to that debuttressing.”
Threats, Hazards, and Climate Change
“We were unbelievably lucky that the [tsunami] occurred with the timing that it did, and not 5 hours later.”
Most tsunamis are set in motion by earthquakes and travel across the open ocean, wreaking their destruction when they reach shallower water near coasts; the word “tsunami” means “harbor wave” in Japanese. The Tracy Arm tsunami joined the ranks of other landslide-driven tsunamis, like the ones in Taan Fiord (Alaska) and Dixon Fjord (Greenland), in being linked to human-driven climate change. Beyond the immediate impact of the waves, this category of hazard requires rethinking potential risks from abrupt catastrophes like debuttressing as well as slower effects such as sea level rise.
“The risk to any particular cruise ship [from a tsunami] on any particular day is very low,” Shugar said. “We were unbelievably lucky that the [tsunami] occurred with the timing that it did, and not 5 hours later. The risk certainly still could be increasing as we build new settlements, new mining camps, or new oil and gas infrastructure.”
Both Shugar and Stearns highlighted the importance of learning lessons from Tracy Arm and related events.
“Climate is a threat multiplier, and the research is really forcing us to look at these cascading hazards,” Stearns said. Tracy Arm “is one example of this: Small slow changes can trigger big events. Hopefully, we don’t need so many disasters to spur some change.”
A drone video shows Sawyer Island in the Tracy Arm Fjord and evidence of the tsunami on the fjord walls. Credit: Bill Billmeier
This aerial photo shows the north side of Alaska’s Tracy Arm Fjord in the aftermath of the 2025 landslide and tsunami. The lighter-colored rock is the exposed surface, where the mountainside collapsed and fell into the water. The foot of South Sawyer Glacier is visible at lower right; in decades past, the ice extended much farther and was thick enough to hold the rock slopes in place. Credit: Cyrus Read/U.S. Geological Survey
Raymo received the award for her pioneering development of hypotheses that explain climate change across Earth’s history, and her educational leadership in the Earth system sciences.
The Great Sapphirewing’s arrival at Tambo Cóndor felt like a shift in the very air—an immense, jewel‑toned hummingbird shaped by altitude and silence, revealing its rare beauty in a moment that seemed carved directly from the high Andes.
This blog series chronicles Jim Gain's experiences with a birding tour in Ecuador.
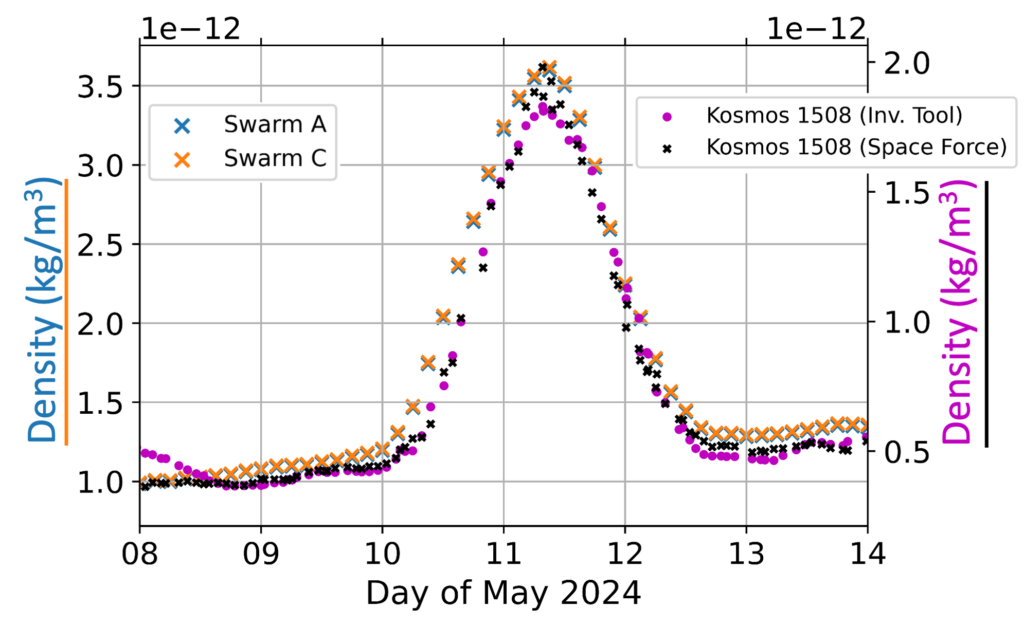
In low Earth orbit (typically below about 700 kilometers altitude), atmospheric drag is the primary source of uncertainty when predicting the trajectories of satellites. These prediction errors largely arise from limitations and inaccuracies in the models used to estimate the density of the upper atmosphere, particularly within the thermosphere.
Mutschler et al. [2026] introduce a new method for estimating atmospheric density along the path of an individual satellite by using Energy Dissipation Rates (EDRs). The derived single-satellite density measurements provide valuable insight into variations in thermospheric density and can help characterize how the upper atmosphere responds to disturbances such as geomagnetic storms. Incorporating these observations can contribute to ultimately improving the accuracy of satellite orbit predictions.
Effective density and Space Force effective density estimated by the Kosmos 1508 satellite (plotted on the right-hand y axes) compared to estimates from satellites Swarm-A and Swarm-C (plotted on the left-hand y-axes). Credit: Mutschler et al. [2026], Figure 17a
Citation: Mutschler, S., Pilinski, M., Zesta, E., Oliveira, D. M., Delano, K., Garcia-Sage, K., & Tobiska, W. K. (2026). First results of a new inversion tool for thermospheric neutral mass density computations during severe geomagnetic storms. AGU Advances, 7, e2025AV002079. https://doi.org/10.1029/2025AV002079
Revisit a classic episode of Sustainability In Your Ear. Mitch Ratcliffe talks with Jake Felser, chief technology officer at Freight Farms, about the company’s “complete farming system inside a box.” It’s a very big box that includes climate controls and monitoring systems to make farming easy for anyone to do. Freight Farms builds and delivers shipping containers converted into highly efficient hydroponic farms that use LED lighting to grow and deliver fresh produce year-round.
Jake discusses the cost of getting started, how many people are needed to run the farm, and how the built-in automation helps farmers plan a profitable business. Grocers, restaurants, communities, and small farms are using Freight Farms installations at 350 farms in 49 states and 32 countries. The company says most of its customers are new to agriculture and operate right in the urban and rural communities they serve.
Jake Felser, CTO at Freight Farms, visits Sustainability in Your Ear to talk about automated hydroponic gardening in shipping containers.
Growing and distributing vegetables locally is one of the most effective ways to lower our society’s carbon footprint. While agriculture contributes about 10% of the U.S. greenhouse gas emissions each year, the majority of that is from raising animals. By increasing our consumption of locally grown vegetables, we can improve local health and reduce overall emissions from transportation. It’s not easy to grow food in most cities using traditional methods. The introduction of container farms and vertical farming inside buildings can reshape food deserts and create economic opportunities.
Research & Developments is a blog for brief updates that provide context for the flurry of news regarding law and policy changes that impact science and scientists today.
The number of peer-reviewed scientific studies authored by scientists at the EPA has declined since the beginning of Donald Trump’s second administration, according to a new analysis.
The analysis was published by Public Employees for Environmental Responsibility (PEER), a nonprofit organization that advocates for public employees in the natural resource and environmental professions. The report tracks the number of peer-reviewed scientific studies authored by EPA scientists since 1977.
According to PEER’s analysis, 61 peer-reviewed publications by EPA scientists have been published so far this year, putting the agency on track to publish 183 articles by the end of 2026. That would be 67% of the number of articles published the previous year and 54% of the number of articles published in 2024.
“These numbers represent a diminution of scientific contributions from the fewer, remaining EPA scientists,” Kyla Bennett, a science policy director at PEER and a former EPA attorney, said in a statement. “The net result is that the scientific contribution of EPA to a greater understanding of what affects human health and the environment will be diminished.”
The number of peer-reviewed publications authored by EPA scientists in 2026 will be just over half of the number published in 2024, if current publication rates continue. As of 5 May, 2026, EPA authors have published 61 peer-reviewed articles for the year. Credit: PEER, Grace van Deelen
Peer-reviewed publications can take years to review and publish, meaning the work for a publication may have occurred during a previous administration. But the decline in publications may indicate a shift away from long-term basic research at the agency, according to PEER.
Since Trump took office, hundreds of scientists have been terminated from the EPA or have chosen to resign, and scientists working within at least one of its research office have been told to pause efforts to publish research, representing “millions of dollars of research, potentially, that’s now being stopped,” one EPA employee told The Washington Post anonymously.
In February, the EPA took final steps to eliminate the Office of Research and Development, the arm of the agency responsible for conducting research. In its place, Administrator Lee Zeldin announced that a new office, called the Office of Applied Science and Environmental Solutions, would be formed but would not operate as a separate division.
Six EPA scientists who signed an open letter expressing frustration about changes to the agency, including the elimination of the Office of Research and Development, were terminated and have filed claims with the federal government arguing that their terminations were illegal retaliation.
These updates are made possible through information from the scientific community. Do you have a story about how changes in law or policy are affecting scientists or research? Send us a tip at eos@agu.org.
About 600 million years ago, the continents wandered Earth, yet to settle into their current positions. Their locations during the Ediacaran (as this time is called) have been tough for scientists to pin down. Earth’s magnetic field appears to have behaved in erratic ways, and applying standard techniques to calculate the continents’ positions based on records of the magnetic field yields implausible results. In particular, scientists debate the location of an ancient continent called Baltica, which is now part of Europe.
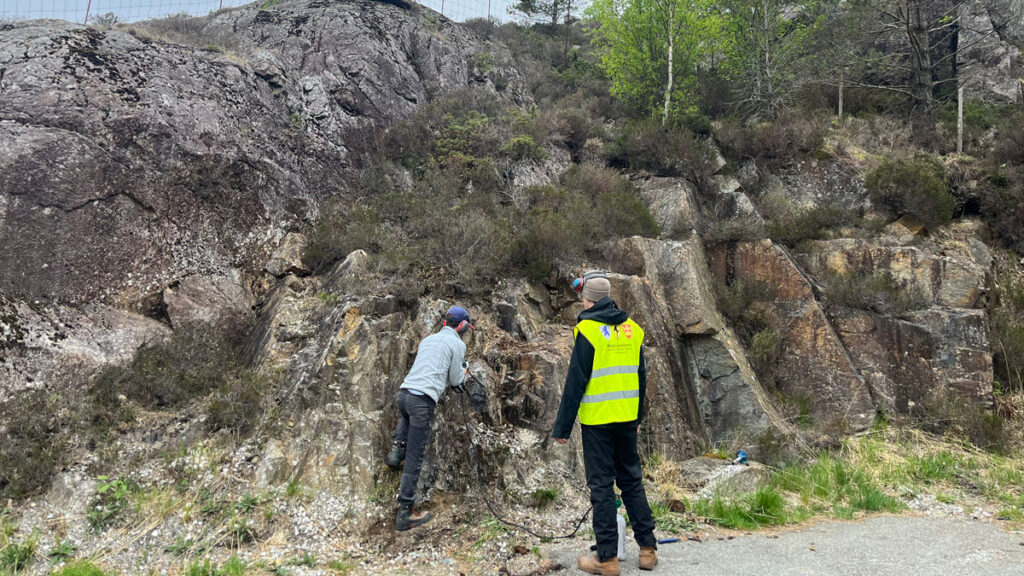
To investigate, Xue et al. traveled to Egersund, Norway, to collect samples of rock that formed during a time when Baltica’s crust was being pulled apart, allowing magma to percolate up from below. As that magma hardened, it recorded snapshots of Earth’s magnetic field, storing information about Baltica’s position in the process.
The results of studying these samples revealed a much more complex picture of the ancient rocks than the scientists initially envisioned. The rocks contained a messy mix of at least six magnetic signals. Several appeared to have formed when more modern geological processes altered the original rocks. Three distinct signals may have survived from the Ediacaran period, two of which diverge from the most plausible Ediacaran signal, which places Baltica near the equator. These conflicting signals further support the idea that Earth’s magnetic field was behaving strangely at the time, adding new complexity to an already puzzling picture.
On the basis of the new results, the researchers place the Egersund paleomagnetic pole at 20.8°N, 89.0°E during the Ediacaran—which diverges from previous results—and suggest that Baltica was located near the equator, adjacent to the ancient continent Laurentia, but rotated slightly clockwise relative to previous reconstructions. The study demonstrates the convoluted nature of the magnetic signals preserved in ancient rocks and the importance of dissecting those records into their constituent components. Doing so, the researchers suggest, can shed new light on the enigmatic behavior of Earth’s magnetic field during the Ediacaran. (Geochemistry, Geophysics, Geosystems, https://doi.org/10.1029/2025GC012730, 2026)
Columbia Climate School is thrilled to announce that Melanie Nakagawa, Chief Sustainability Officer at Microsoft, will deliver the keynote address at the Climate School’s Class Day ceremony.
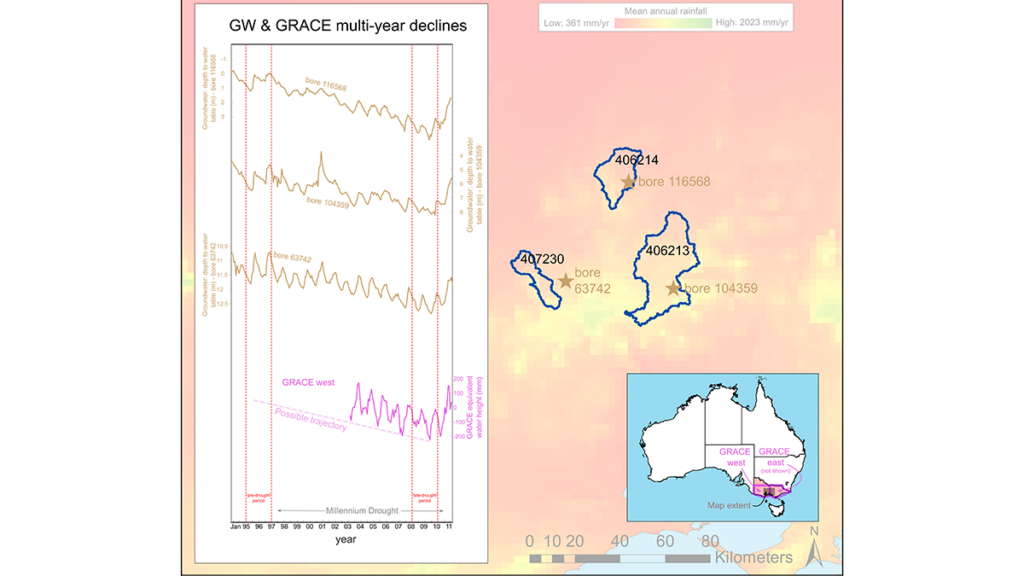
In the March 2026 issue of Water Resources Research, Zhang et al. [2026] interrogate conceptual hydrologic models’ ability to capture prolonged drought dynamics. The Australian Millennium drought serves as an example in the study. The results are quite sobering because the vast majority of more than 40 models fail. Unfortunately, calibration doesn’t generally help either and might result in massive overfitting. In essence, conceptual models miss deep aquifer storage components and associated hydrodynamic processes leading to a lack of time scales important in drought modeling. The study is a constructive reminder that model parsimony is not necessarily a good thing and that detailed representation of complex physical processes is part of hydrologic sciences.
Citation: Zhang, Z., Fowler, K., & Peel, M. (2026). Can conceptual rainfall-runoff models capture multi-annual storage dynamics? Water Resources Research, 62, e2025WR042226. https://doi.org/10.1029/2025WR042226