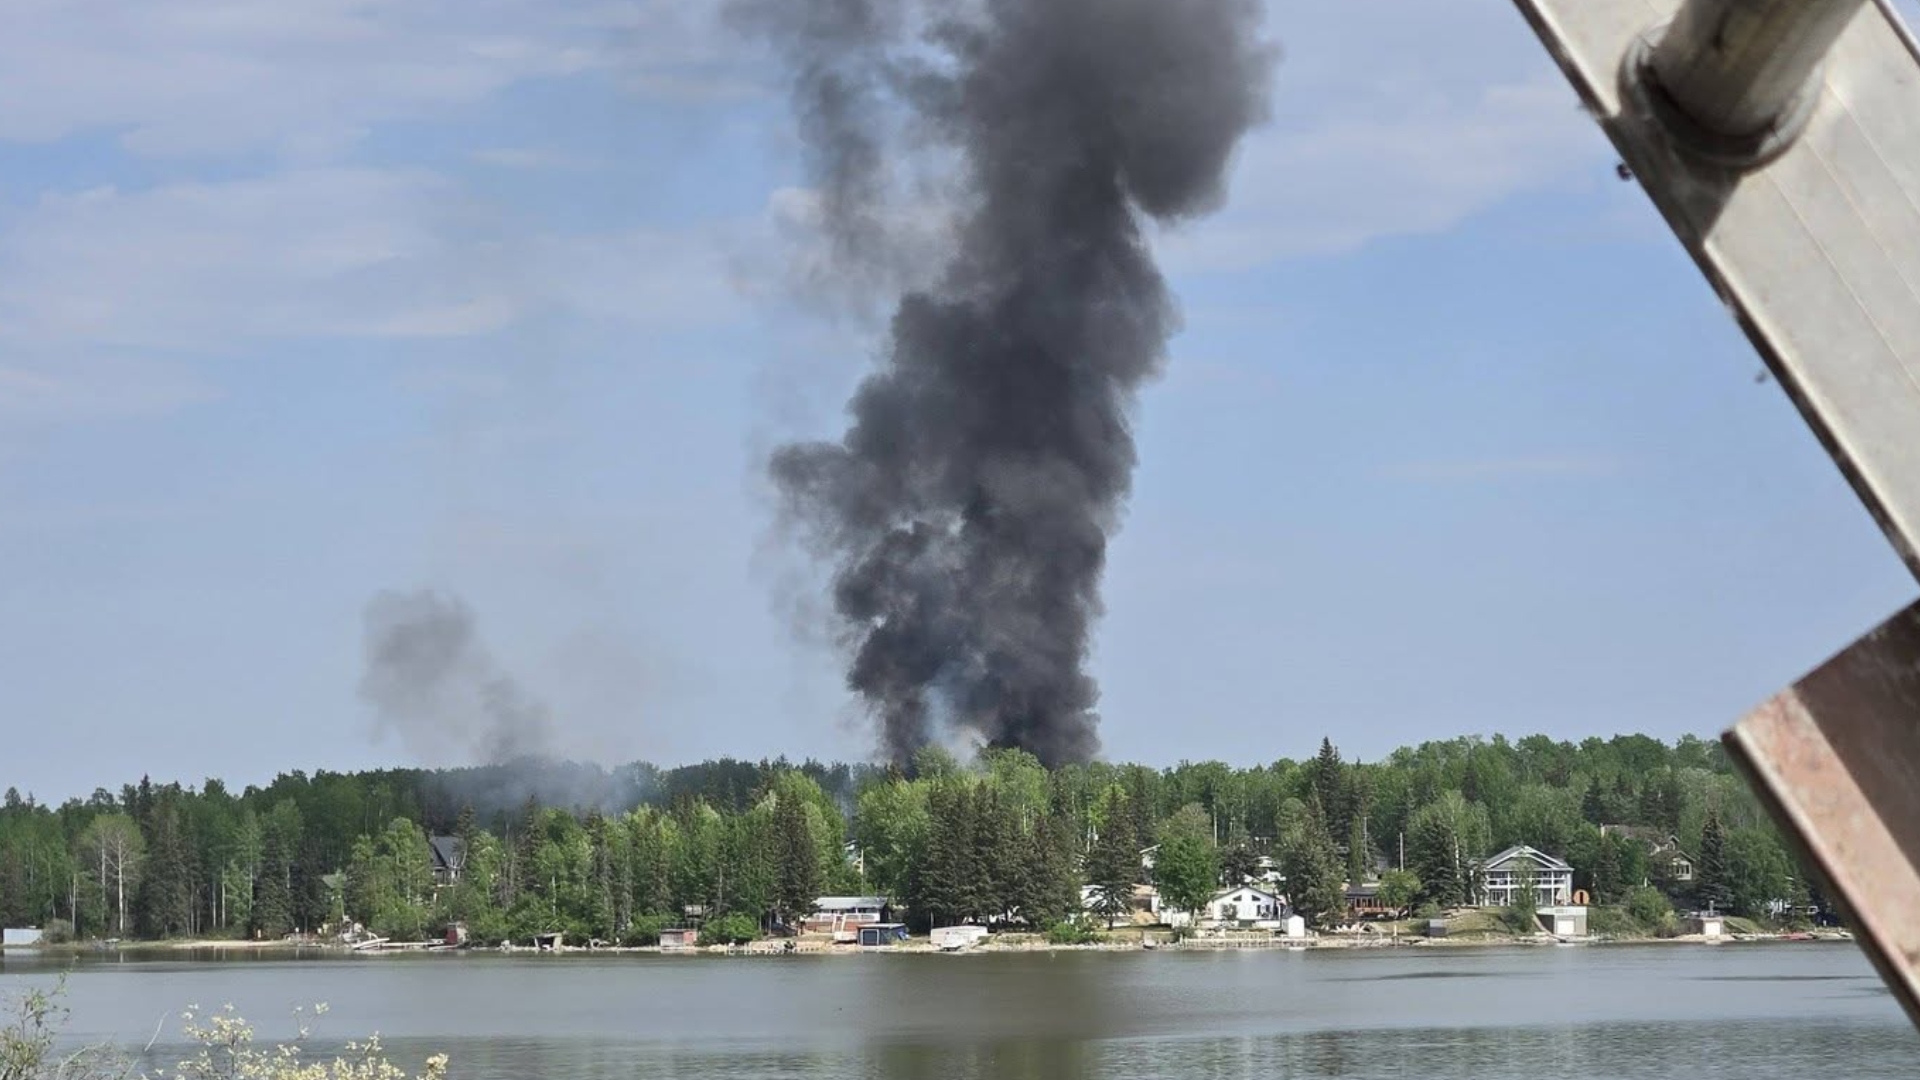
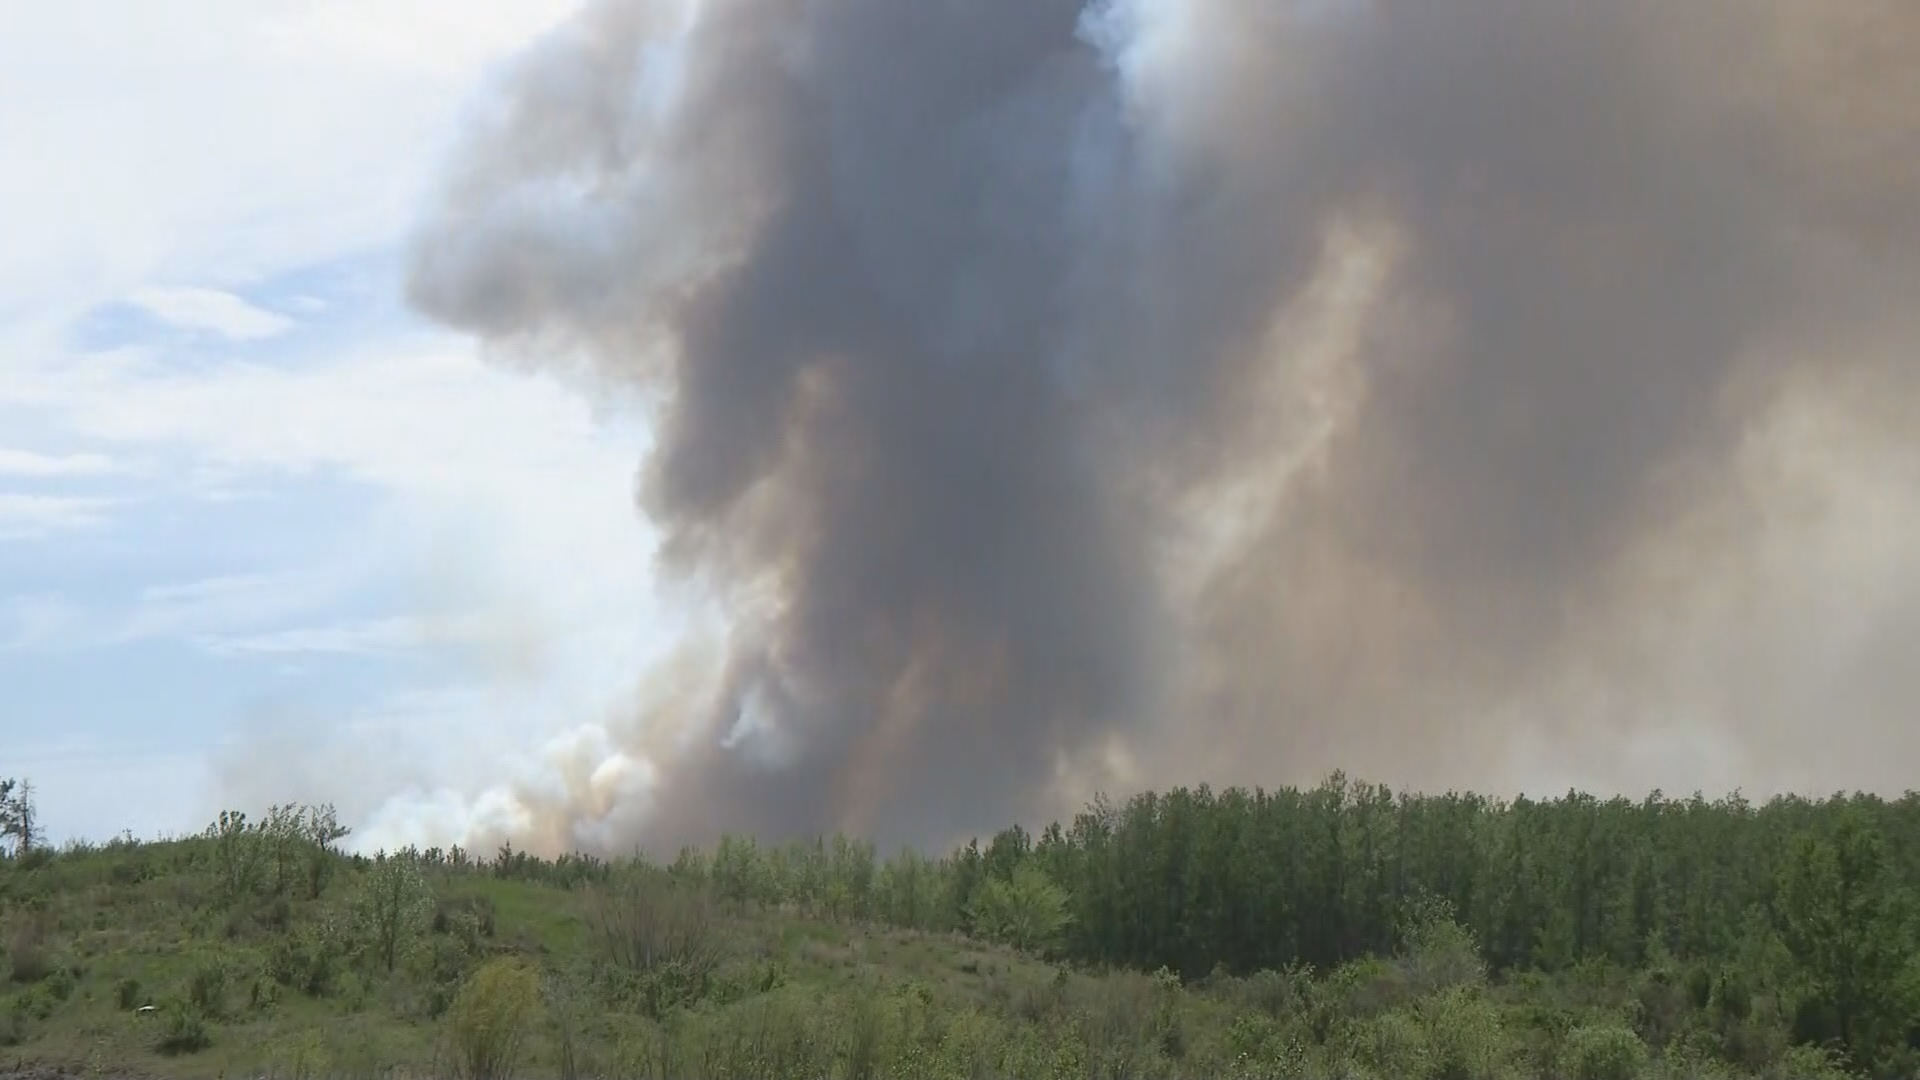
Residents of a rural area northwest of Edmonton in the County of Barrhead are being ordered to get out of their homes as a wildfire in the area has set buildings ablaze.
Residents of a rural area northwest of Edmonton in the County of Barrhead are being ordered to get out of their homes as a wildfire in the area has set buildings ablaze.
Source: Earth’s Future
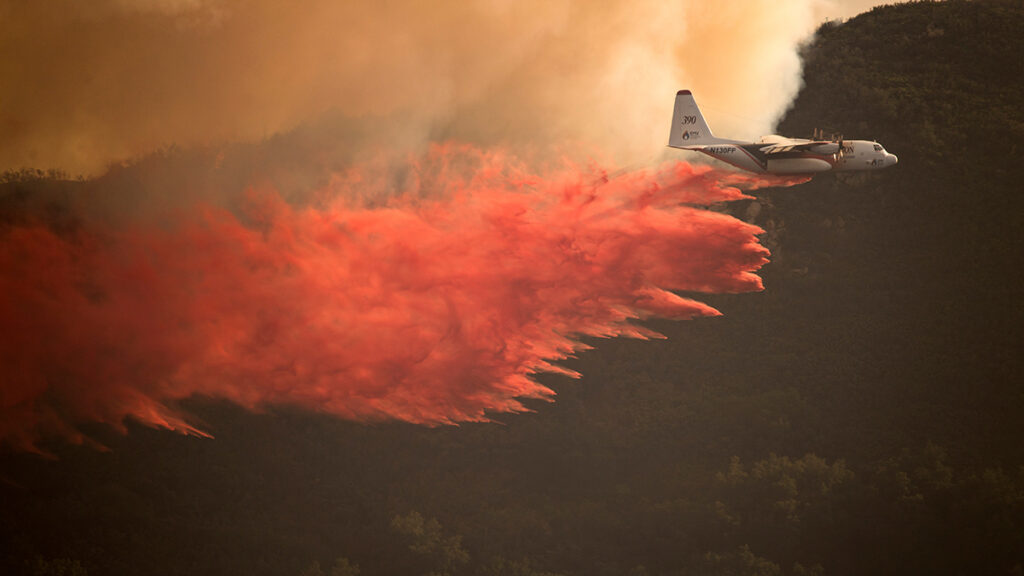
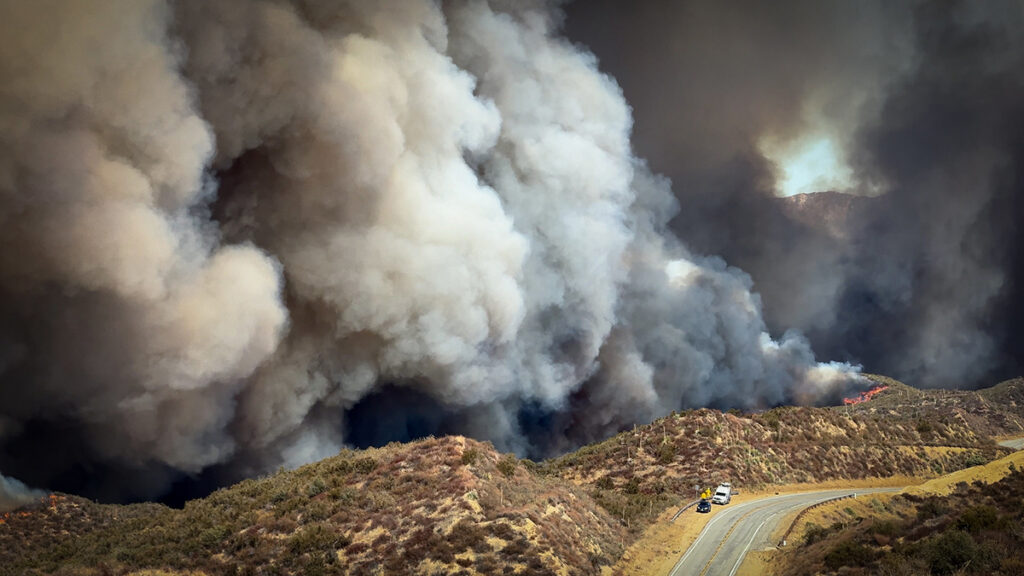
Hotter, drier conditions in the western United States have led to a rise in wildfire activity that has damaged or destroyed infrastructure, natural ecosystems, and entire towns across the region. As fires grow larger and more destructive, the cost of managing them rises as well.
Fire management agencies in the United States have been feeling the pressure. Between 2014 and 2023, fire management agencies across all levels of government experienced a 131% increase in t
Hotter, drier conditions in the western United States have led to a rise in wildfire activity that has damaged or destroyed infrastructure, natural ecosystems, and entire towns across the region. As fires grow larger and more destructive, the cost of managing them rises as well.
Fire management agencies in the United States have been feeling the pressure. Between 2014 and 2023, fire management agencies across all levels of government experienced a 131% increase in total area burned and a 268% increase in total fire spending adjusted for inflation compared to the period between 1985 and 1994.
Today, federal agencies like the Department of the Interior (DOI) and the U.S. Department of Agriculture Forest Service (USFS) continue to invest in aiding states and managing hazardous fuel growth on public land, as well as suppressing active fires. Policymakers and federal agencies alike must decide how to manage limited budgets while protecting people, property, and natural resources.
Prestemon et al. built statistical models based on historical data to examine the potential increase in spending by the DOI and the USFS between now and 2100. Their models link wildfire activity to climate variables such as temperature and water vapor deficit and then connect fire activity to suppression costs. To capture a range of possible future conditions on federal lands, the study predicts 10 fire and suppression spending scenarios by applying five different climate models to two different warming pathways (the moderate Representative Concentration Pathways (RCP) 4.5 scenario and the high-emissions RCP 8.5 scenario).
The results varied by region and scenario, but each of the 10 scenarios suggested a rise in area burned as well as inflation-adjusted fire suppression spending, with higher fire activity translating to higher costs. Projected changes in DOI and USFS land burned increased 80% by mid-century and 208% by late century.
By the middle of the century, both agencies are projected to see spending increases: about 0.65% per year for DOI spending and about 0.87% per year for USFS spending from 2020 to 2100. Although uncertainty increased with time and outcomes varied across climate models and warming pathways, the largest increases in both cost and wildfire activity were consistently projected for the northwestern United States. (Earth’s Future, https://doi.org/10.1029/2025EF007985, 2026).
Citation: Owen, R. (2026), As wildfires increase in the West, so does suppression spending, Eos, 107, https://doi.org/10.1029/2026EO260187. Published on 10 June 2026.
Source: Water Resources Research
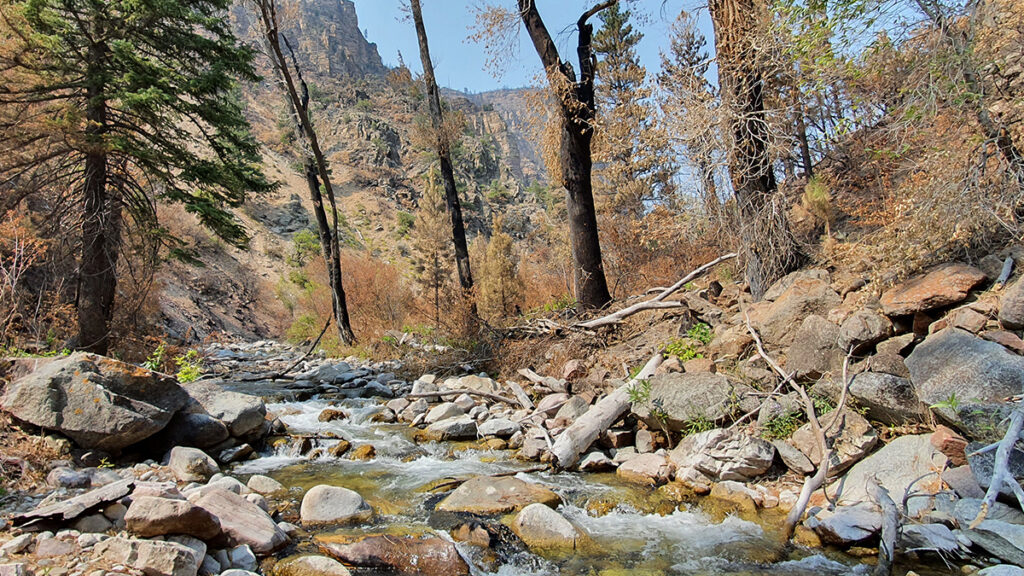
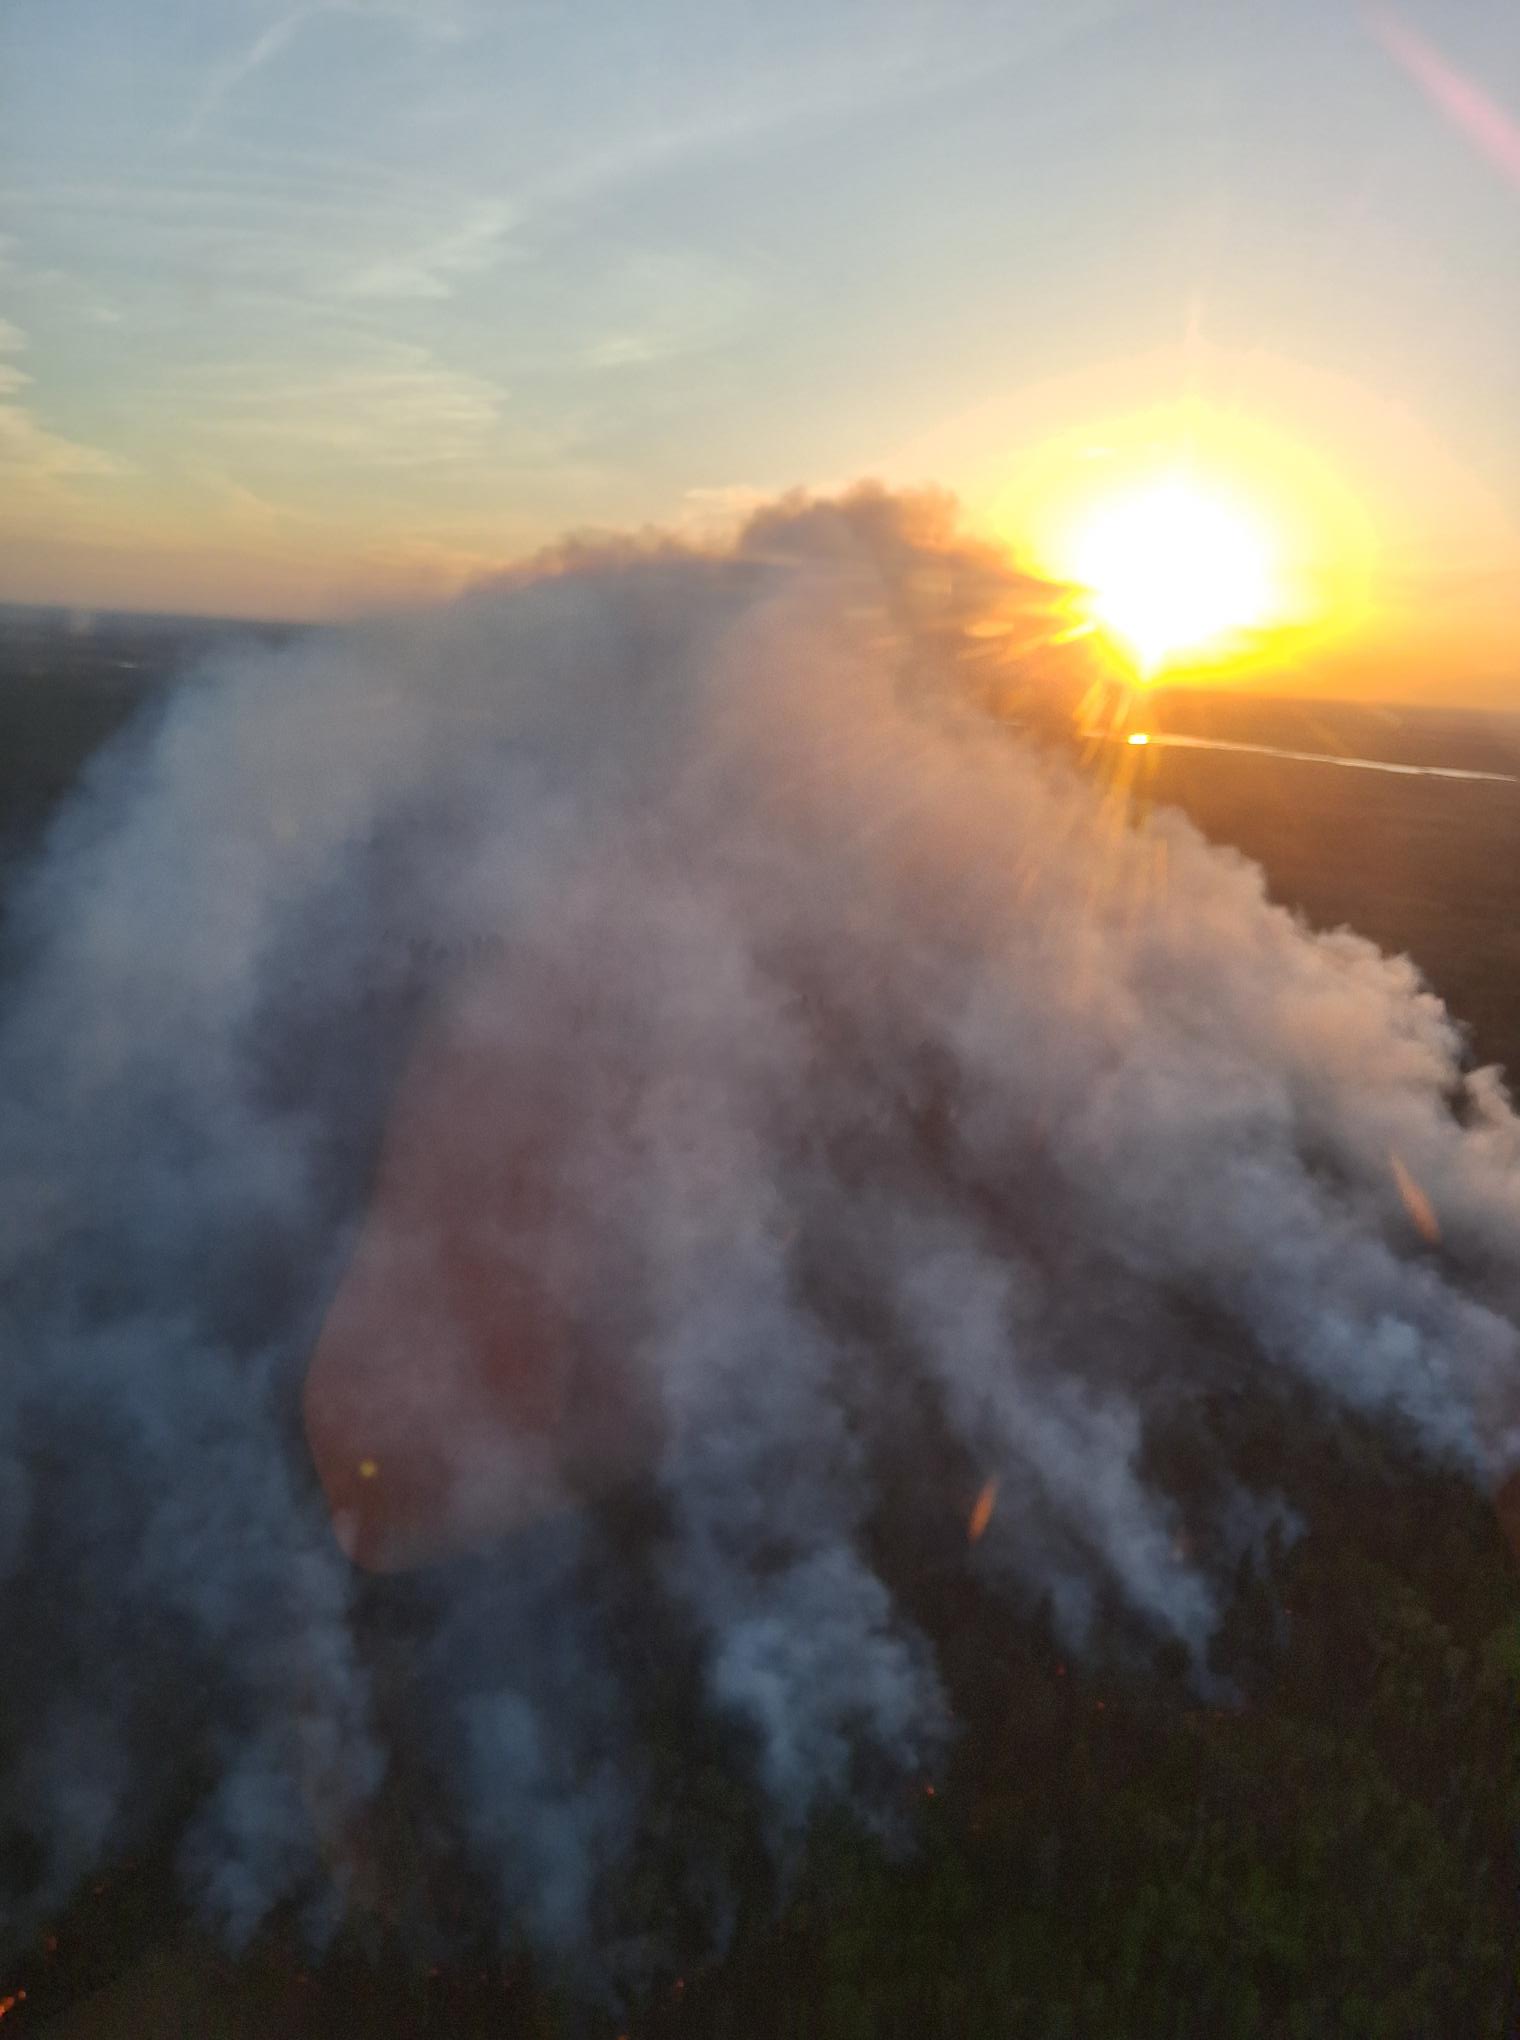
Wildfires can increase flooding risks in and downstream of burned areas by removing vegetation and disturbing hydrologic processes. As the climate changes, the severity of both wildfires and heavy rainfall events is increasing, meaning flooding is likely to become more severe in the near future. Better understanding how, and by how much, wildfires change flood risk is important for disaster and infrastructure planning for communities around the country.
Ca
Wildfires can increase flooding risks in and downstream of burned areas by removing vegetation and disturbing hydrologic processes. As the climate changes, the severity of both wildfires and heavy rainfall events is increasing, meaning flooding is likely to become more severe in the near future. Better understanding how, and by how much, wildfires change flood risk is important for disaster and infrastructure planning for communities around the country.
To make the most of the limited data on flooding in the years following wildfires, the researchers created a paired-storms framework: They identified postfire peak flows (PFPFs), defined as the five highest peak flows within 3 years of a wildfire across seven watersheds. Then, for each precipitation event causing a PFPF, they looked for storms with similar characteristics (or paired storms) that occurred before the wildfire. Storm characteristics used for pairing included the season in which the storm occurred, recent precipitation, and precipitation depth, duration, and peak intensity.
The researchers found significantly elevated peak flows after wildfires in many cases, underlining the risks to communities following wildfires and validating their approach for use elsewhere.
Altogether, the authors found 26 PFPF events, including 20 with paired storms occurring before wildfires. For 75% of the postfire storms, their peak flows were 2 or more times greater than prefire peak flows. PFPFs were most likely to happen in the first year after a wildfire and typically occurred following storms that were centered upstream of the watershed centroid, were uniform in shape, and fully covered the watershed and burned area, the authors reported. They also found some evidence that the first storm in the year immediately following a fire has a higher-than-expected chance of producing a PFPF.
Future work could look more deeply at the characteristics of storms occurring over burned areas, such as storm direction and watershed recovery, and could apply the automated methods to more burned watersheds and storm events to enhance the robustness of the work, the authors say. (Water Resources Research, https://doi.org/10.1029/2025WR040693, 2026)
Last year's record-breaking wildfire season exposed flaws in Saskatchewan's fire preparedness, a report published Friday found. Premier Scott Moe said the province must do better.
Last year's record-breaking wildfire season exposed flaws in Saskatchewan's fire preparedness, a report published Friday found. Premier Scott Moe said the province must do better.
California is no stranger to the hot, dry summer weather that makes wildfires more likely. But wildfire season in the state is now stretching into the heart of winter, when it has historically been protected by cool, wet weather. In January 2025, Southern California experienced some of the deadliest and costliest wildfires in the state’s history.
Now, a new study published in Nature Communications shows that the climatic changes that increase the risk of these winter wildfires could be drive
California is no stranger to the hot, dry summer weather that makes wildfires more likely. But wildfire season in the state is now stretching into the heart of winter, when it has historically been protected by cool, wet weather. In January 2025, Southern California experienced some of the deadliest and costliest wildfires in the state’s history.
Now, a new study published in Nature Communications shows that the climatic changes that increase the risk of these winter wildfires could be driven by low autumn snow levels thousands of miles away, in western Eurasia. The authors said that tracking snowfall in Eurasia could help forecast winters in California that will have higher chances of wildfires.
The researchers were motivated by the catastrophic 2025 wildfires to search for climate drivers of winter wildfire conditions in California. First, they looked for correlations between winter wildfires and ocean temperatures, especially La Niña events that are associated with drier-than-average conditions in California. They also examined variability in sea ice, which can affect global weather patterns. But they saw only weak connections.
Compared to oceans and sea ice, the influence of snow cover on global weather patterns is less studied, said Shineng Hu, a climate scientist at Duke University and lead author of the paper. But another climate researcher in Hu’s lab, Shizuo Liu (first author of the study), had previously studied the connection between snow cover and weather patterns and suggested the team look for connections between snow and fires. That’s when they found significant correlations between the winter wildfires in California and low snow cover in western Eurasia.
“When I saw the result, I was suspicious,” Hu said, “because we all know that correlation doesn’t mean causality.” But they ran hundreds of climate model simulations reducing snow cover in Eurasia and saw an increased probability of winter fires in California. “At that point, we were pretty much convinced that there could be something interesting happening over there,” Hu said.
Propagating Pressure
“I’m glad to see this group saying snow can do something similar to what ocean temperature anomalies can do.”
The scientists determined that this intercontinental link starts because the land absorbs more energy when snow cover is low, disturbing the atmosphere above it. This disturbance, like a stone thrown into water, generates large waves of air called Rossby waves that travel eastward along the jet stream across the Pacific Ocean. The Rossby waves drive the formation of a high-pressure zone that creates the hot, dry, windy conditions conducive to wildfires.
“I’m glad to see this group saying snow can do something similar to what ocean temperature anomalies can do,” said Judah Cohen, a climatologist at the Massachusetts Institute of Technology who was not involved in the study but has also studied the links between snow in North America and Eurasia. “I’ve been surprised by how important this mechanism is for U.S. weather in the winter and how little there is about it in the literature.”
“This is just one missing gap that people didn’t even realize. We want to add that to the table.”
But Cohen suggested the study tells only part of the story. In North America, dry winters in the west are paired with wet, cold winters in the east. The same is true in Eurasia, and according to Cohen’s past research, when snow levels are low in western Eurasia but high in eastern Eurasia, a temperature and pressure gradient is created across the continent. The energy released as the atmosphere works to equalize that pressure drives the Rossby waves. Cohen said the disparity between snow levels in eastern and western Eurasia would likely strengthen the Rossby waves and then the warming in California. “If all of Eurasia [had] below normal [snow levels], I don’t think you could easily excite this wave energy that propagates across the hemisphere.” He also stressed that Rossby waves don’t just travel eastward. They also travel upward into the stratosphere, where they bounce back down over North America and intensify the high pressure over the western United States.
Both Cohen and the study authors insisted that many other factors influence whether wildfires ignite in winter. “This is just one missing gap that people didn’t even realize. We want to add that to the table,” said Hu. But monitoring snow levels in Eurasia could offer signs of bad wildfire winters to come. The January 2025 Southern California fires were preceded by low snow levels in November and December in Eurasia, Hu said. “So there’s a 1‑month lag, which gives us some hope that we can use that for prediction.”
Citation: Chapman, A. (2026), Low snow in Eurasia linked to wildfires in California, Eos, 107, https://doi.org/10.1029/2026EO260138. Published on 13 May 2026.
Source: AGU Advances
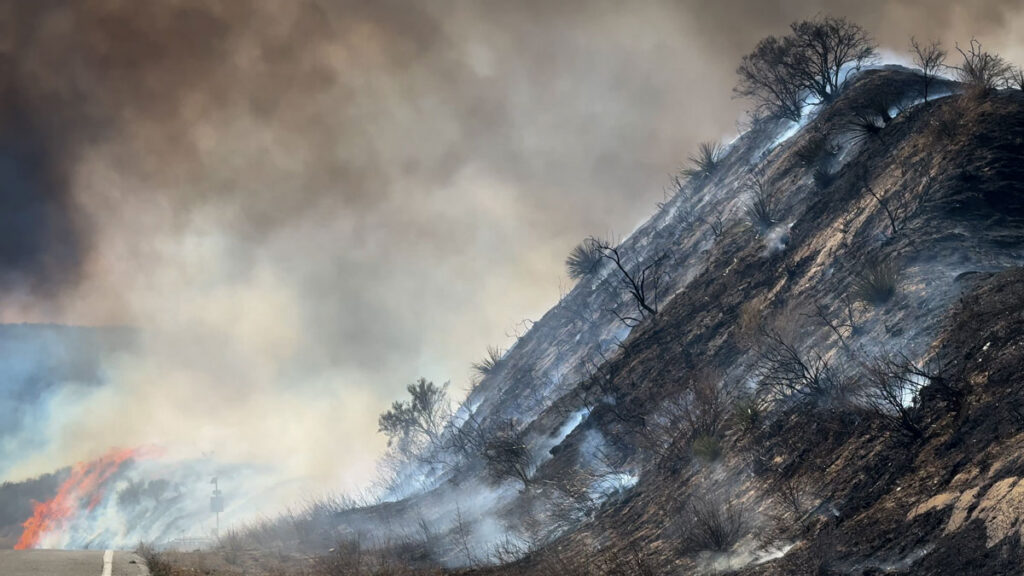
Urbanization, climate change, and fire suppression practices are contributing to increased wildfire risk at the densely populated wildland-urban interface. These factors make fires more unpredictable and harder to manage. In January 2025, this was made devastatingly clear in Los Angeles, when massive wildfires engulfed entire hillsides and canyons, destroying neighborhoods and damaging surrounding ecosystems.
The Mediterranean climate region of California, which stret
Urbanization, climate change, and fire suppression practices are contributing to increased wildfire risk at the densely populated wildland-urban interface. These factors make fires more unpredictable and harder to manage. In January 2025, this was made devastatingly clear in Los Angeles, when massive wildfires engulfed entire hillsides and canyons, destroying neighborhoods and damaging surrounding ecosystems.
The Mediterranean climate region of California, which stretches up most of the state’s coastline, is a naturally fire-prone landscape because its dry conditions support vegetation growth and also allow for fire to spread easily. As wildfires become more intense, better modeling and understanding of their drivers is crucial in efforts to predict risk.
Ward-Baranyay et al. looked at three of the January 2025 Los Angeles wildfires by analyzing preburn conditions, such as fuel characteristics, topography (including elevation and slope), and wind speed. Satellite observations gathered from the Ecosystem Spaceborne Thermal Radiometer Experiment on Space Station (ECOSTRESS) and the Earth Surface Mineral Dust Source Investigation (EMIT)—precursors to a recently announced NASA mission, the Explorer for Artemis Geology Lunar and Earth (EAGLE)—provided detailed information about the vegetation’s condition before the fires began. The researchers then built a random forest regression model to predict burn severity based on these conditions, ultimately demonstrating that prefire fuel conditions were a key driver of the destructive wildfires’ immediate effects on wildlands.
The model used in the study was able to accurately capture about 60% of the patterns in burn severity. It was most accurate for the Palisades and Hughes fires, but less accurate for the Eaton Fire. This discrepancy could be because the area burned by the Eaton Fire was more topographically variable, meaning its burn severity drivers may not have been fully captured by the model, the researchers suggest. Vegetation type was also a strong performance indicator: Terrain with shrub or scrub cover, the dominant vegetation type, offered the most accurate predictions for burn severity. The burn patterns of forests and other landscape types were less accurately captured.
Fuel conditions emerged as the dominant driver of burn severity, more so than topography or weather. In particular, how abundant, wet, dry, or stressed vegetation is can hint at how severe future fires may be. Tracking and monitoring these fuel conditions, researchers suggest, may be a way to monitor wildfire hazard in California and other fire-prone regions. (AGU Advances, https://doi.org/10.1029/2025AV002179, 2026)
Citation: Owen, R. (2026), Want to predict wildfire severity? Look to the state of vegetation, Eos, 107, https://doi.org/10.1029/2026EO260130. Published on 4 May 2026.
The Senate Committee on Agriculture and Forestry says Canada needs to fund a national fleet of modern firefighting aircraft and create an office to co-ordinate wildfire responses.
The Senate Committee on Agriculture and Forestry says Canada needs to fund a national fleet of modern firefighting aircraft and create an office to co-ordinate wildfire responses.
Editors’ Highlights are summaries of recent papers by AGU’s journal editors.
Source: Journal of Geophysical Research: Atmospheres
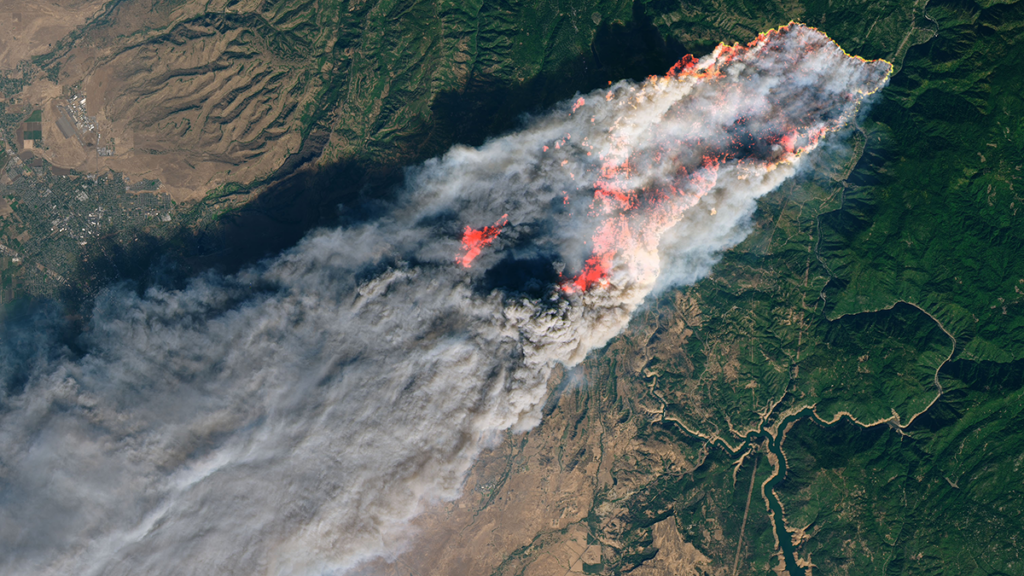
The 2018 Camp Fire was the deadliest and most destructive wildfire in California history. The Camp Fire spread extremely rapidly, driven by strong winds and dry fuels, but also by organized long-range spotting, i.e. lofting and downwind fallout of burning embers to ignite new fires.
Using operational Doppler radar and satellite observations, Lareau [2026] pr
Source: Journal of Geophysical Research: Atmospheres
The 2018 Camp Fire was the deadliest and most destructive wildfire in California history. The Camp Fire spread extremely rapidly, driven by strong winds and dry fuels, but also by organized long-range spotting, i.e. lofting and downwind fallout of burning embers to ignite new fires.
Using operational Doppler radar and satellite observations, Lareau [2026] provides the first high resolution depiction of spotting behavior during an extreme wildfire. Observations show that spot fire events for the Camp Fire occurred 5-10 kilometers ahead of the fire front, quickly merging into new fire lines. Spot fires are not random but aligned within coherent fallout zones that are shaped by plume dynamics and background winds. These results show that operational weather radar can identify lofting and fallout regions in real time, providing a new way to anticipate spotting-driven fire spread and improve early warnings for fast-moving wildfires.
(a) Along wind cross section of Camp Fire plume reflectivity observed by radar measurements, showing distinct updrafts (white arrows) and ashfall regions (blue dashed arrow). Spot fires within 10 minutes of these radar measurements are shown as filled cyan triangles. (b) Map of column maximum radar reflectivity and fire perimeter. In both panels the black dashed line indicates the eastern edge of the town of Paradise, California. Credit: Lareau [2026], Figure 6ab
Citation: Lareau, N. P. (2026). Plume-coupled long-range spotting drove the explosive spread of the 2018 Camp Fire. Journal of Geophysical Research: Atmospheres, 131, e2025JD045798. https://doi.org/10.1029/2025JD045798
The rain has improved the fire situation across much of Saskatchewan. With fires tempering down, evacuees from Red Earth and Shoal Lake Cree Nation begin to return home.
The rain has improved the fire situation across much of Saskatchewan. With fires tempering down, evacuees from Red Earth and Shoal Lake Cree Nation begin to return home.
Two wildfires are growing near Lac du Bonnet, about a hour north of Winnipeg, where a devastating fire last spring claimed two lives and destroyed dozens of properties.
Two wildfires are growing near Lac du Bonnet, about a hour north of Winnipeg, where a devastating fire last spring claimed two lives and destroyed dozens of properties.