Research & Developments is a blog for brief updates that provide context for the flurry of news that impacts science and scientists today.
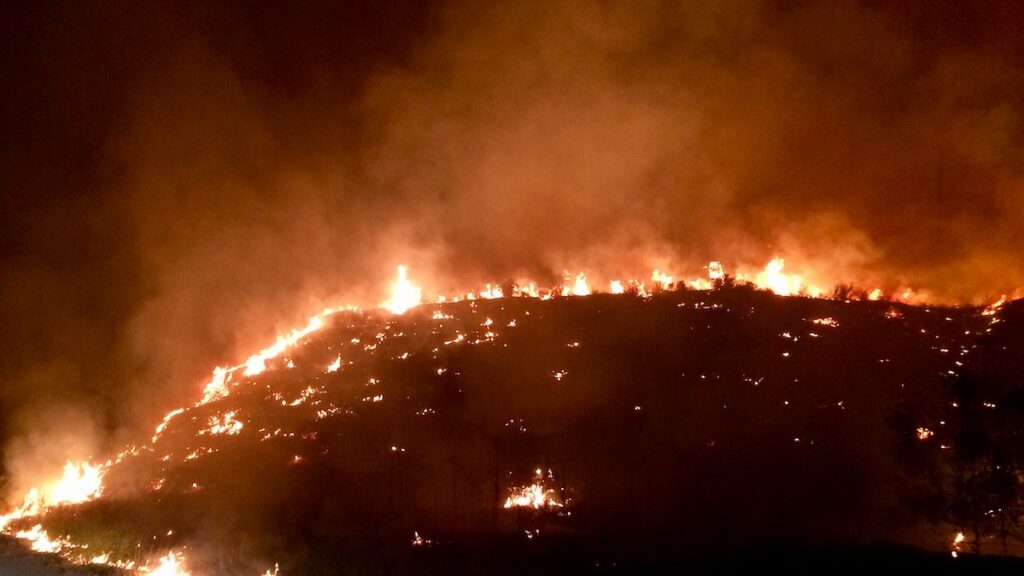
As the midpoint of the year approaches, several climate records have already been broken. Arctic winter sea ice extent reached a record low. Several countries saw record-breaking winter heat waves. And more than 150 million hectares have already burned globally in wildfires.
The increasingly likely emergence of an El Niño this summer will likely continue the year’s record-breaking weather trends and could lead to “an unprecedented year of global fire,” according to a statement from World Weather Attribution, a climate research collaboration.
“In modern human history, we’ve never experienced a strong or very strong El Niño event amid pre-existing conditions that were this warm globally.”
NOAA’s Climate Prediction Center predicts there is a 61% chance of El Niño—a natural climate pattern that involves warming waters in the Pacific Ocean—emerging by July 2026 and persisting through the end of the year. El Niño typically temporarily boosts global temperatures.
At a press briefing on 11 May hosted by World Weather Attribution, climate scientists outlined the potential risks of this emerging El Niño against the backdrop of human-caused climate change, including intensifying wildfire seasons, extreme heat waves, and worsening droughts.
In the press briefing, Frederike Otto, a climate scientist at World Weather Attribution and Imperial College London, emphasized that climate change will likely play a larger role in the rest of this year’s extreme weather events than El Niño will, pointing to more than 100 analyses done by World Weather Attribution that have controlled for the effects of the El Niño Southern Oscillation (ENSO), the broader climate phenomenon that produces El Niño and its sister condition, La Niña.
“We find that human-induced climate change has a much greater influence on the likelihood and intensity of extreme weather events than ENSO,” she said.
Still, El Niño could push average global temperatures to extremes. The effects of El Niño will “be amplified considerably by the now nearly 1.5°C [(2.7°F)] of global warming experienced as of 2026,” Daniel Swain, a climate scientist at the University of California, Los Angeles and the California Institute for Water Resources, said in a statement. “In modern human history, we’ve never experienced a strong or very strong El Niño event amid pre-existing conditions that were this warm globally.”
The global fire season has “got off to a very fast start,” particularly in the African savanna, Southeast Asia, and northeastern China, Theodore Keeping, who studies extreme weather and wildfires at Imperial College London and World Weather Attribution, said in the briefing. Though El Niño may have mixed effects on the U.S. wildfire season, much of the U.S. is expected to face elevated wildfire risk, and a strong El Niño could worsen wildfires elsewhere in the world, particularly in the Amazon rainforest and Australia, Keeping said.
More than 150 million hectares have burned in wildfires so far this year. Credit: Our World in Data, CC BY
“This rapid start [to the wildfire season], in combination with the forecast El Niño, means that we’re looking at a particularly severe year materializing,” Keeping said. “The likelihood of harmful, extreme fires potentially could be the highest we’ve seen in recent history.”
These updates are made possible through information from the scientific community. Do you have a story about science or scientists? Send us a tip at eos@agu.org.
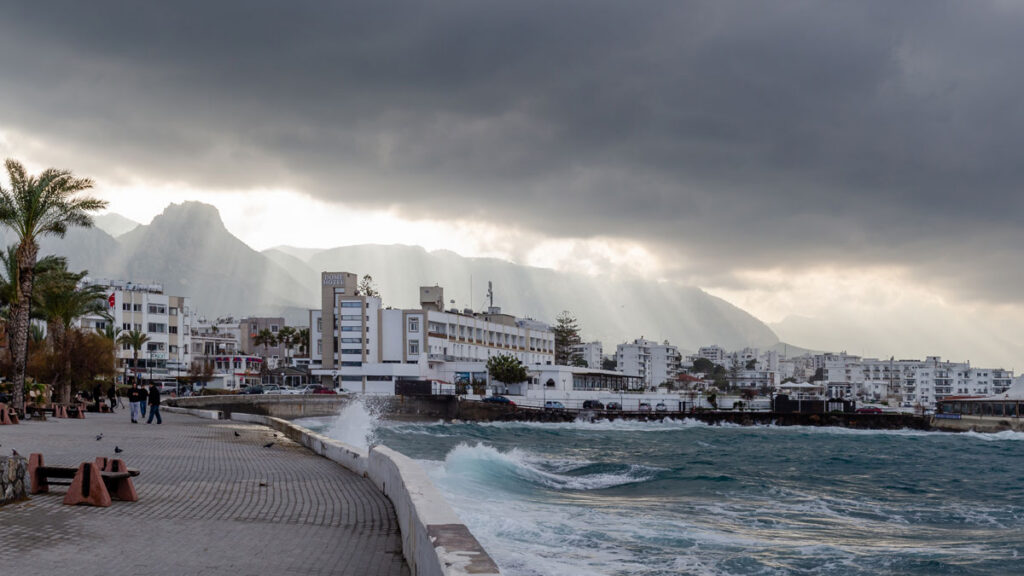
Coastal landscapes are constantly being reshaped by natural forces, and as climate change causes more frequent storms and sea level rise, that change will only intensify. Because these areas are densely populated with homes, tourist destinations, and industries, understanding how and where the coast will change is a pressing issue. However, reliable predictions that lead to actionable knowledge are rare.
Lentz et al. describe the state of knowledge regarding coastal evolution, highlight gaps in scientists’ understanding, and describe opportunities for integrating information from various models, data sources, and end users.
Current coastal evolution predictions are often focused on too specific a location and are therefore hard to generalize or analyze too large a region and therefore lack detail, the authors say. In addition, it’s challenging for researchers to link the effects of acute events, such as storms, with long-term trends like sea level rise.
Improving these simulations will likely require combining many different types of models, including physics-based numerical models, models based on empirical measurements, and statistical models that include machine learning. To fully understand potential changes, the authors note that it is also essential to consider both coastal processes and human actions.
The researchers recommend several ways to improve consistency and collaboration in the field of coastal change forecasting. First, standardizing approaches and outcomes would make it easier to produce national-scale predictions. Right now, the variety of tools used across different locations makes it difficult for scientists to compare results and communicate effectively. They also emphasize the need for using coordinated research approaches. Stronger transdisciplinary collaboration, accompanied by essential training and support, would also enable scientists to make better predictions, the researchers say.
Comparing predictions to real-world observations of coastal landscape change could also help untangle this multifaceted challenge. By studying how coastlines have already changed, researchers can validate models and choose those that are performing best. Such comparisons require datasets that adequately capture coastal landscape change across both time and space. Remote sensing data and the use of artificial intelligence (AI) for data processing may help provide these improved datasets, the researchers suggest.
Engaging end users during the project planning process is also helpful because only end users truly know what kind of information they need to adapt to landscape change. Knowing how to engage end users can be difficult for physical scientists, but various tools and specialized personnel exist who can help coordinate these interactions, the authors say. (Earth’s Future, https://doi.org/10.1029/2024EF005833, 2026)
As climate change increases the frequency and intensity of flooding, it’s becoming increasingly important to monitor and predict flood hazards at different scales. A new article in Reviews of Geophysics presents a data-driven performance analysis of various space-based sensors that monitor flood hazards. Here, we asked the lead author to give an overview of satellite-based flood monitoring, the benefits and challenges of using satellite-based sensors, and future space-based projects.
Why is it important to monitor the surface waters on Earth?
More than half of the world’s population lives within three kilometers of a freshwater body. When seasonal flooding behaves as anticipated, it provides essential nutrient replenishment to soils and crops. However, extreme flooding disturbs the careful balance of freshwater systems and can cause damaging flooding that disrupts livelihoods.
Climate change is making these extremes more frequent and less predictable, while expanding populations in flood-prone areas amplify the human cost. Continuous monitoring of Earth’s surface waters is essential as it helps us anticipate hazards, evaluate risk, and design interventions that protect the people and places most exposed to hydrologic hazards.
What are the benefits of monitoring flood inundation from space compared to other techniques?
Monitoring flood inundation from space is advantageous due to the wide-scale global coverage that captures important information over large areas. In-situ sensors, such as river gauges, provide valuable data but are limited in spatial coverage and may even fail under significant flood conditions. A single satellite overpass can potentially capture an entire river basin, allowing responders to see where water has spread, which communities are affected, and how the event is evolving.
When did scientists first start using satellites to monitor surface waters?
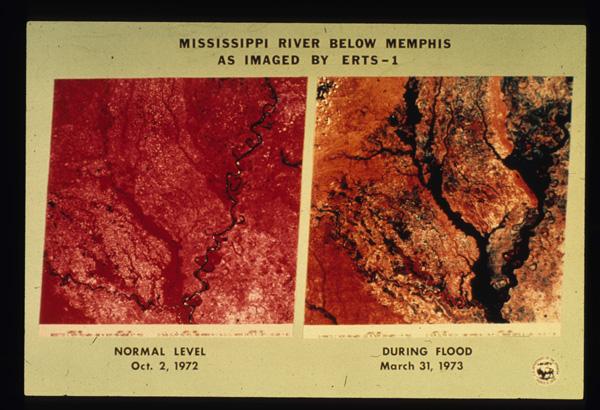
The value of monitoring surface water from space was first realized in the early 1970s, following the launch of Landsat 1. Soon after launch, it captured imagery of the devastating 1973 Mississippi River floods, producing one of the first flood maps made from space (Figure 1). By the early 2000s, NASA’s MODIS sensors were providing global coverage at a daily frequency. Today, multiple global flood monitoring systems are in place, including the European Union’s Copernicus Emergency Management Service, which maps floods using Sentinel-1 synthetic aperture radar (SAR), and NOAA’s VIIRS Flood Mapping system.
Figure 1. Imagery from the start of the Landsat 1 mission illustrating the extent of the Mississippi River flooding of 1973 (EROS History Project). The Earth Resources Technology Satellite 1 (ERTS-1) was renamed Landsat 1 in 1975. Credit: USGS
What are the three types of satellite-based sensors that your review focuses on?
Our review examines three families. Multispectral (optical and thermal) sensors capture reflected sunlight or emitted heat. Microwave sensors, including SAR, passive microwave radiometers, and GNSS Reflectometry (GNSS-R), can observe through clouds and at night but involve trade-offs between resolution and coverage. Finally, altimetric sensors measure water surface elevation with high precision but only along narrow tracks. Each family has distinct strengths and weaknesses that lend themselves to use in combination for comprehensive flood inundation monitoring.
What are some of the challenges of using satellite-based sensors to monitor flooding?
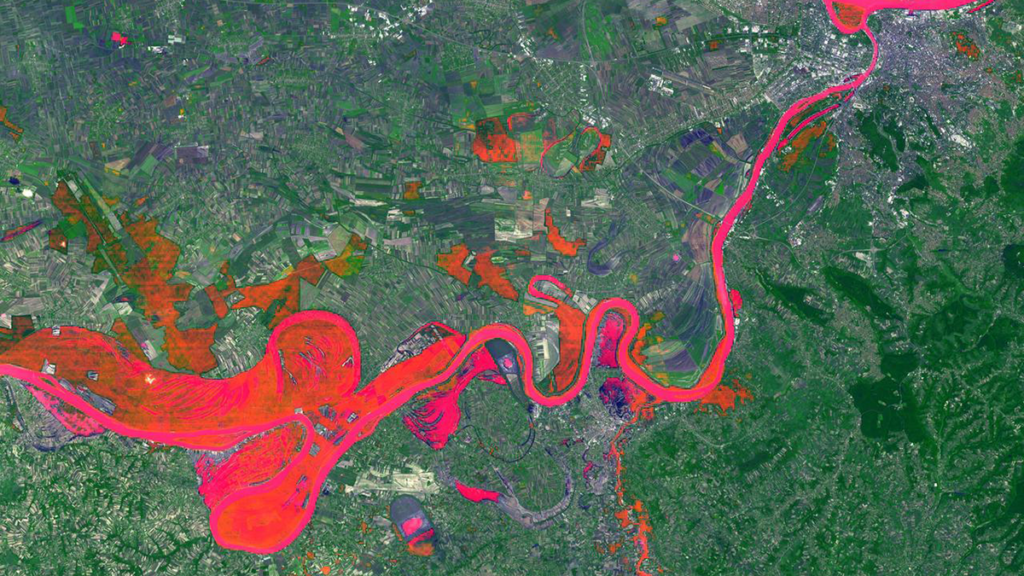
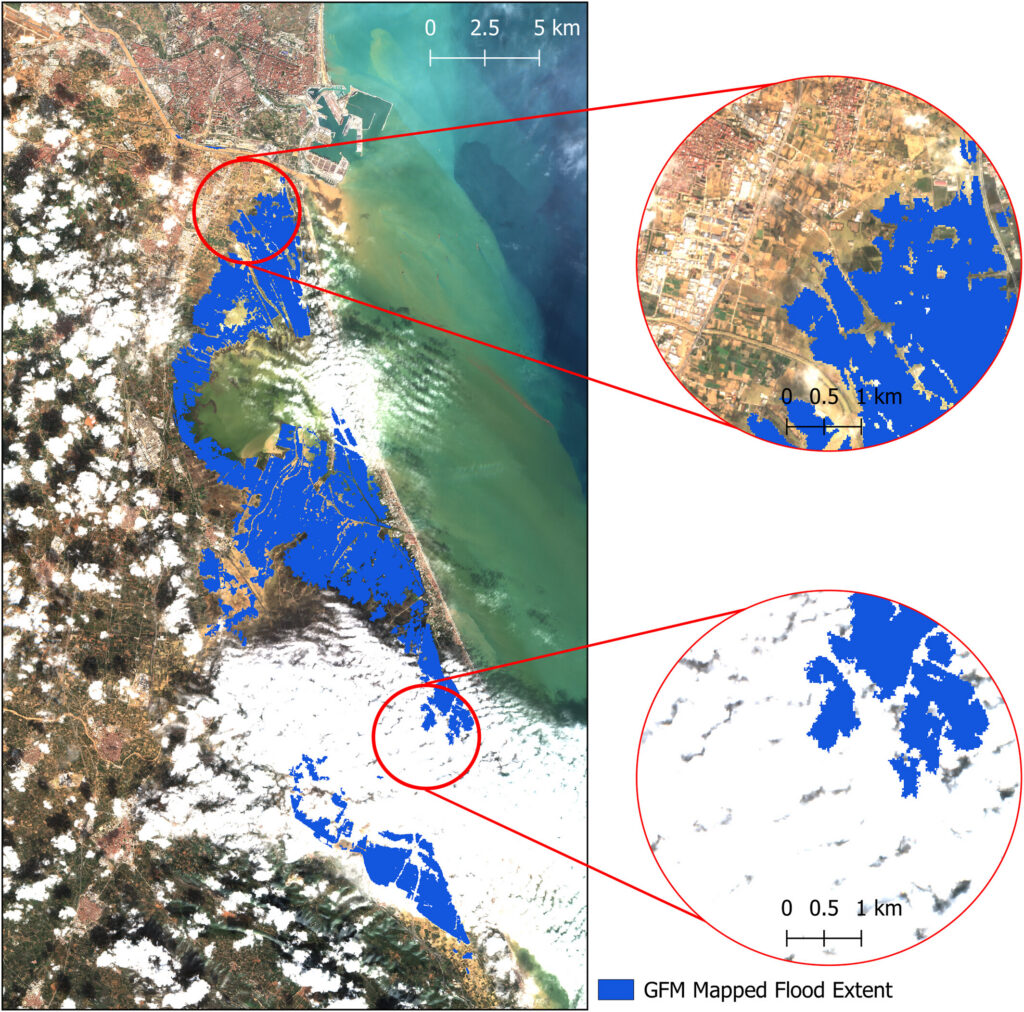
The fundamental problem is that floods and satellite observations are mismatched in time and space. Optical sensors often capture clouds rather than the floodwater beneath. Cloud-penetrating sensors like SAR can miss flood peaks if their orbital schedule doesn’t align with the event, and dense vegetation can obstruct floodwater from both optical and shorter-wavelength radar. Sensors with high temporal resolution typically deliver data at coarse spatial resolutions, sometimes tens of kilometers per pixel. These trade-offs form what we describe as the “iron triangle” of Earth observation: temporal resolution, spatial resolution, and cost. A sensor can typically be optimized for two, but rarely all three. Occasionally, the timing and conditions of a flood align well with sensors whose strengths are complementary across the iron triangle, yielding the kind of multi-sensor view shown in Figure 2.
Figure 2. Sentinel‐2 MSI True Color Image with Sentinel‐1 SAR derived flood‐extent superimposed on top. The top right circle highlights the missing SAR‐derived information, whereas the bottom circle highlights the missing optical information. Credit: Campo et al. [2026], Figure 5
What are some upcoming space-based sensor projects that could advance the field of hydrology?
Several are already reshaping the field. NISAR, a joint NASA–ISRO radar satellite launched in 2025, carries an L-band sensor designed to penetrate vegetation canopy, providing new insights into flooding beneath vegetation. Sentinel-1D, launched in late 2025, has restored the Sentinel-1 constellation to full two-satellite capacity, halving the revisit time. Landsat Next, a planned three-satellite constellation with 26 spectral bands and a six-day revisit, would provide valuable hydrologic data at both high temporal and spectral resolutions. However, recent budget pressures have introduced uncertainty about its final scope. Finally, the HydroGNSS mission from ESA will use GNSS-R to monitor hydrologically linked Essential Climate Variables.
Editor’s Note: It is the policy of AGU Publications to invite the authors of articles published in Reviews of Geophysics to write a summary for Eos Editors’ Vox.
Citation: Campo, C. (2026), Can any single satellite keep up with the world’s floods?, Eos, 107, https://doi.org/10.1029/2026EO265016. Published on 20 April 2026.
This article does not represent the opinion of AGU, Eos, or any of its affiliates. It is solely the opinion of the author(s).
Scientists agree that to have a chance of keeping the world’s warming below the Paris Agreement limit of 1.5°C (2.7°F), humanity needs most oil, gas, and coal to remain in the ground. This “unburnable” or “unextractable” carbon would not contribute to global carbon emissions.
But where, exactly, should we prioritize shutting down or banning fossil fuel activities? A new study published in PLoS One provides an answer for the Arctic with an atlas showing where oil and gas activities overlap with vulnerable ecosystems, important wildlife species, and Indigenous land.
“We’re investigating the idea of unburnable carbon with a geographical perspective,” said Daniele Codato, a geographer at the Università de Padova in Italy and lead author of the new study. “We focus on where to keep oil and gas underground.”
The atlas is meant to help decisionmakers prioritize areas where it is essential to avoid opening new frontiers or where current oil and gas extraction should be halted because of social, cultural, ecological, or climate justice criteria, he said.
Overlaps, Mapped
Codato and a team of researchers created their Arctic atlas with dozens of public datasets from five Arctic polities known to have oil and gas activities (Alaska (United States), Canada, Greenland (Denmark), Norway, and Russia). Though various geographic definitions of the Arctic exist, the team chose a boundary used to evaluate wildlife and conservation by the Conservation of Arctic Flora and Fauna (the biodiversity working group of the Arctic Council, an intergovernmental organization focused on Arctic governance) to include the largest possible portion of vulnerable ecosystems.
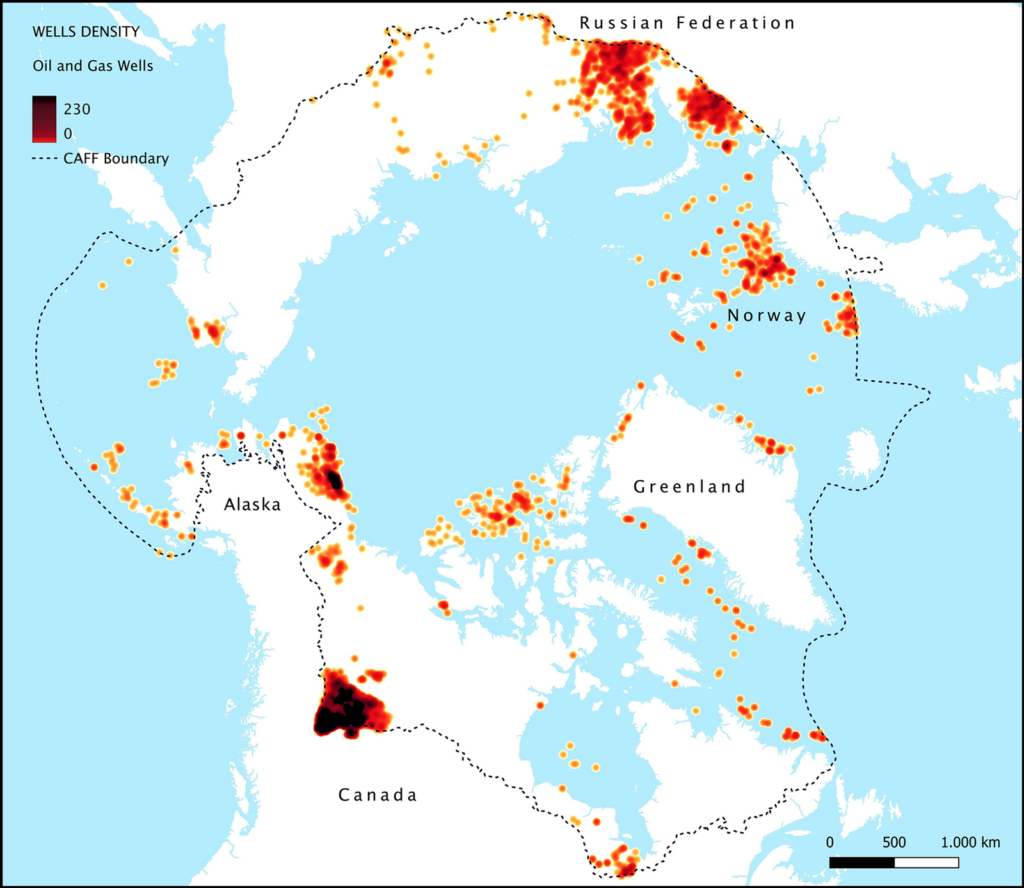
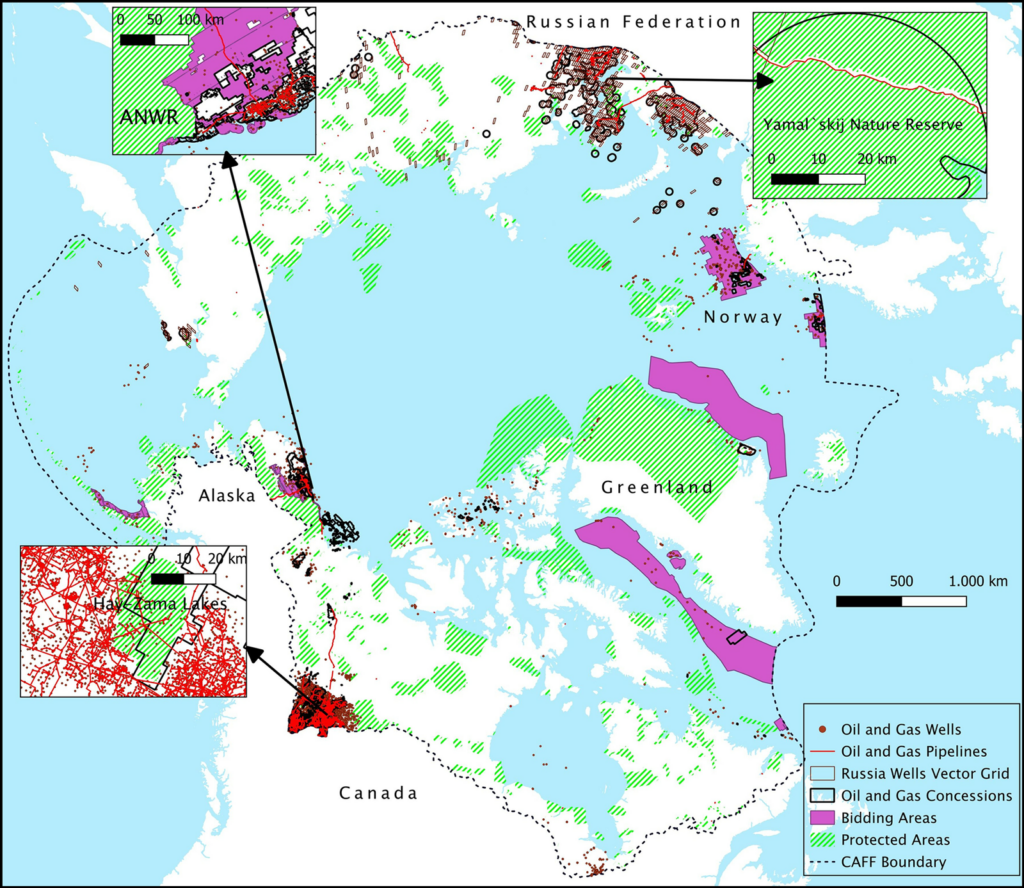
The resulting maps revealed more than 512,000 square kilometers—an area about the size of Spain—of Arctic territory with existing or planned fossil fuel activities, including leases, areas under bid, exploration licenses, and infrastructure. Within those areas, the researchers counted 44,539 active wells and nearly 40,000 kilometers (about 25,000 miles) of pipelines.
Oil and gas wells in the Arctic are highly concentrated in northwestern Canada, northern Alaska, and northern Russia. The CAFF boundary identifies the Arctic region as defined by the Conservation of Arctic Flora and Fauna (the biodiversity working group of the Arctic Council). Click image for larger version. Credit: Codato et al., 2026, https://doi.org/10.1371/journal.pone.0345775
Next, the researchers determined how oil and gas activities overlapped with protected areas defined by the International Union for Conservation of Nature and conservation priority areas defined by three other nongovernmental organizations. Fossil fuel activities threaten wildlife by altering habitats, disrupting migratory routes, and releasing pollutants.
Of the area containing oil and gas activities, more than 7% overlapped with ecologically protected areas, and more than 13% overlapped with the ranges of all of the three key Arctic species considered in the study: polar bears, yellow-billed loons, and caribou. The highest concentrations of oil and gas activities were in the Yamal Peninsula of Russia, northwestern Canada, and the North Slope of Alaska, all home to fragile ecosystems.
Seven percent of Arctic fossil fuel extraction areas mapped by the research team overlapped with ecologically protected areas. In some cases, such as in the Yamal`skij Nature Reserve in Russia (top right), protected area borders have been cut or delimited to avoid overlapping with protected area boundaries, possibly indicating that protected areas have been downsized or redesigned to accommodate fossil fuel infrastructure. ANWR = Arctic National Wildlife Refuge. Click image for larger version. Credit: Codato et al., 2026, https://doi.org/10.1371/journal.pone.0345775
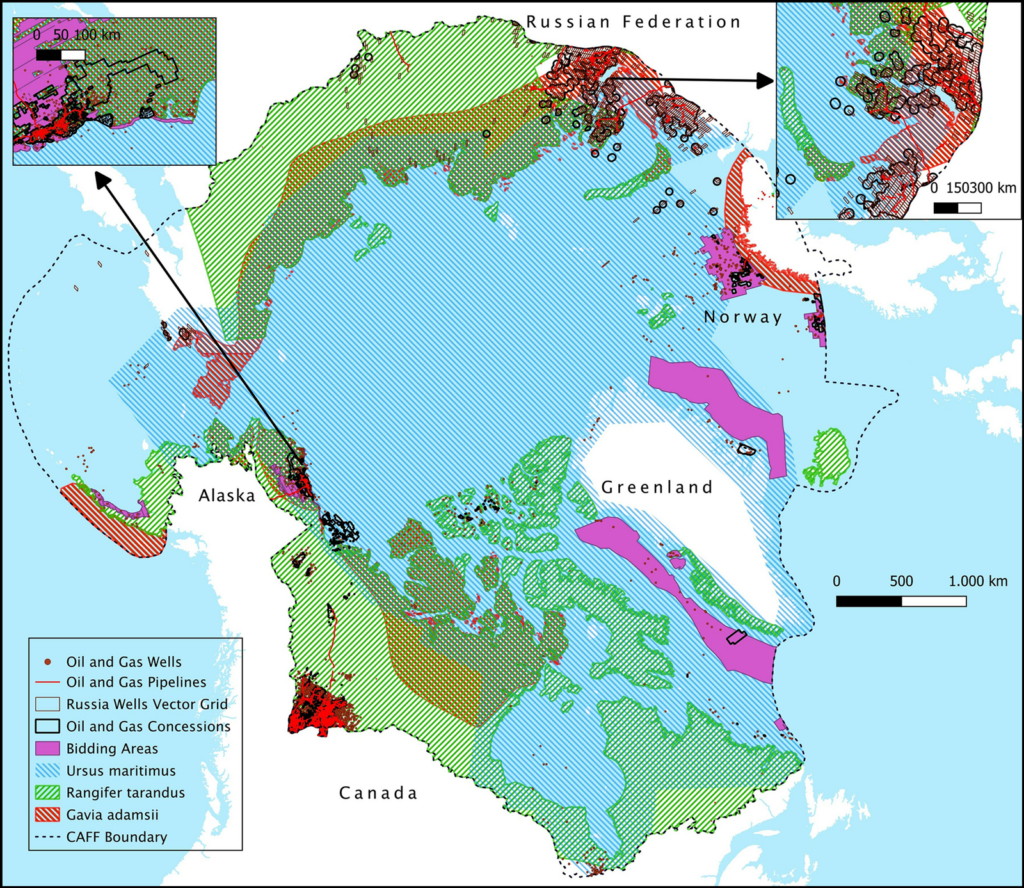
Mapping revealed that 87.21% of leases in Alaska and more than 13% of total Arctic concessions for fossil fuel activities overlapped with the ranges of all three of the key Arctic species considered in the study (polar bears (Ursus maritimus), caribou (Rangifer tarandus), and yellow-billed loons (Gavia adamsii)). Click image for larger version. Credit: Codato et al., 2026, https://doi.org/10.1371/journal.pone.0345775
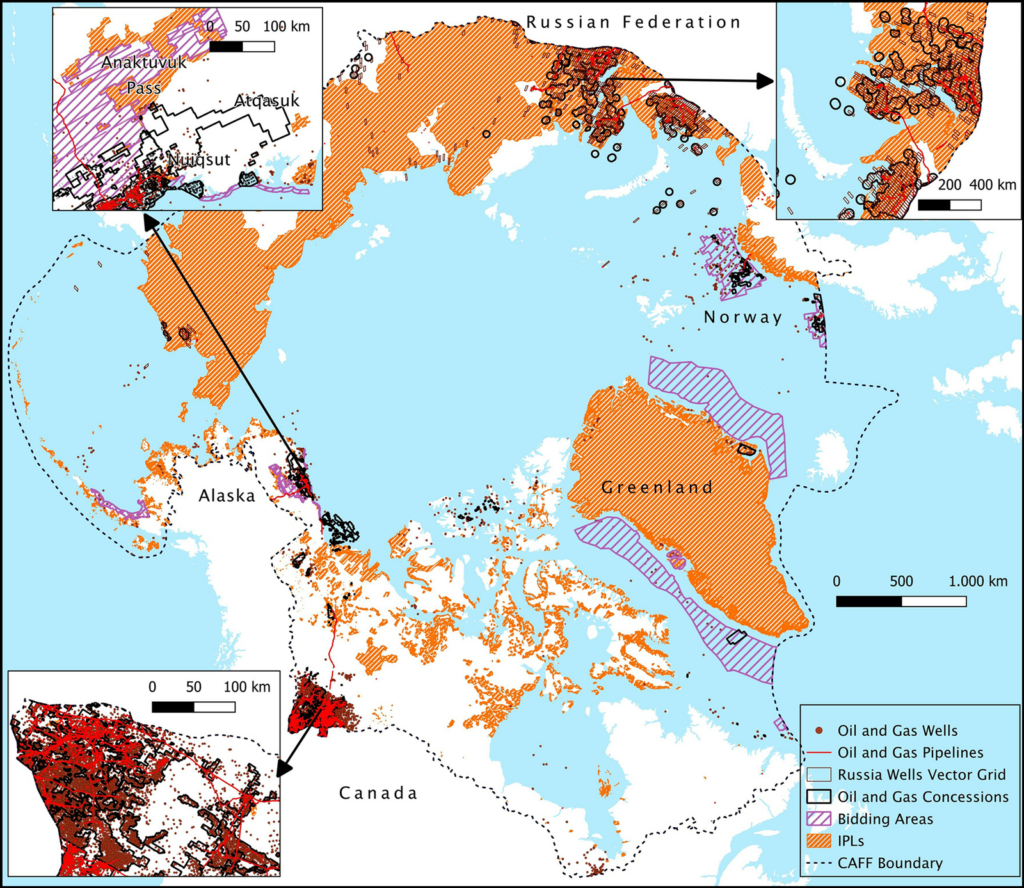
The researchers also discovered that 73% of land with oil and gas activities overlapped with Indigenous Peoples’ lands, defined in the study as lands where Indigenous communities maintain significant influence over land management. Fossil fuel activities can threaten Indigenous communities’ health and ways of life, though the authors note that overlaps between Indigenous Peoples’ lands and fossil fuel activities do not necessarily indicate an opposition between the two.
Oil and gas concessions cover more than 4% of Indigenous Peoples’ lands (IPLs) in the Arctic. Click image for larger version. Credit: Codato et al., 2026, https://doi.org/10.1371/journal.pone.0345775
“It’s a really interesting idea to create an atlas of unburnable carbon and try to make visible where tensions might occur between Indigenous land, ecosystems, [and fossil fuel activities],” said Mariel Kieval, a researcher at the Arctic Institute, a nonprofit research organization. The overlaps noted in the atlas are an “initial indicator” providing opportunities for further research that zooms in on specific areas, she said.
Kieval also said the atlas could be helpful for local communities trying to identify where extraction activities are occurring nearby.
Policy Paradigm
The atlas’s effort to express the urgency of action to the public and policymakers is useful, said Paul Ekins, an economist at University College London who was part of the team that coined the term “unburnable carbon.” “Any way in which atlases or discussions or slogans can up the political ante so that politicians become braver in seeking to address this issue is to be welcomed.”
In particular, Codato hopes the atlas will fuel a “paradigm shift” in global policy that would ultimately ban the proliferation of fossil fuel activities in the Arctic.
The need for an intergovernmental ban on fossil fuel activities is evidenced by the Arctic National Wildlife Refuge in Alaska, Codato said: The refuge received temporary protections against drilling under the Biden administration, but the Trump administration plans to open the refuge for oil and gas leases this summer. “We need something stronger” to avoid such administration-by-administration changes in Arctic protections, he said.
“If we don’t start to ban fossil fuels in the Arctic now, it could become another sacrifice zone.”
Such a paradigm shift will be more important than ever as warming in the Arctic provides new access to resources and opportunities for trade that may accelerate ecological and cultural disruptions. “If we don’t start to ban fossil fuels in the Arctic now, it could become another sacrifice zone,” like some parts of the Amazon rainforest, Codato said.
Policy actions have fallen far behind the science, Ekins said. “There should have been an agreement not to exploit fossil fuels in the Arctic well before the ice had melted to a sufficient extent to make that a practical possibility.”
In 2023, the research team published a similar atlas identifying unburnable carbon in the Ecuadorian Amazon and plans to continue to expand their atlas to include the rest of the world. The team is currently working on projects that cover Brazil, Italy, Nigeria, and the United Kingdom.
Citation: van Deelen, G. (2026), This Arctic atlas shows where oil and gas activities overlap with wildlife and Indigenous communities, Eos, 107, https://doi.org/10.1029/2026EO260139. Published on 7 May 2026.
Antarctica’s Ross Ice Shelf and the West Antarctic Ice Sheet may have been far smaller during one of Earth’s most recent warm periods, according to a new study.
SINGAPORE: Singapore’s hot and humid weather has been growing on a lot of locals, and people are now thinking of possibilities to get away with this type of climate—moving into a new country.
On Reddit, a netizen shared that his/her concern is not only due to the current El Niño season but also due to the unbearable Singapore heat all year round. With this, he/she admitted to having friends who migrated to Singapore because they could not stand the weather, and those who want to experience the full four seasons in a country.
“Personally, my kids and I are OK with the SG weather for now, but the unbearable heat recently made me think long term,” the netizen claimed.
Many netizens shared their thoughts and opinions on this subject matter. Some people declared that people only have one life, and everyone should be doing what makes their hearts happy.
“Don’t take advice from people who have different preferences (like heat lol) and priorities in life as you,” one comment said.
“I even moved to a country warmer than Singapore. Do whatever you want, as long as your jobs, visas, and lifestyles match the country you move to,” another netizen stated.
One comment shared as well the consequences of living in a country with four seasons, especially during the winter season. The netizen said: “It’s a chore living during winter because of the blizzards and when you want to go to work or even to buy groceries, you gotta shovel the ice off your vehicle first and also heating costs. That’s the extreme that you’ll encounter when you stay somewhere that has a winter season.” The netizen added that sometimes, this season can be depressing and people should really have to invest a lot to beat the cold.
Others consider the weather to be the least factor that they consider when moving to another country. “If I ever move overseas, it probably won’t be because of the heat ngl… But having seasons really does make the years more interesting and enjoyable,” a comment concluded.
In the end, staying or leaving Singapore depends on what makes each person happy. There is no right answer for everyone, as long as they find a place that fits their life.
President Donald Trump is again seeking to boost the struggling U.S. coal industry, with an announcement expected Thursday to spend nearly $700 million to support coal-fired power plants and coal exports.
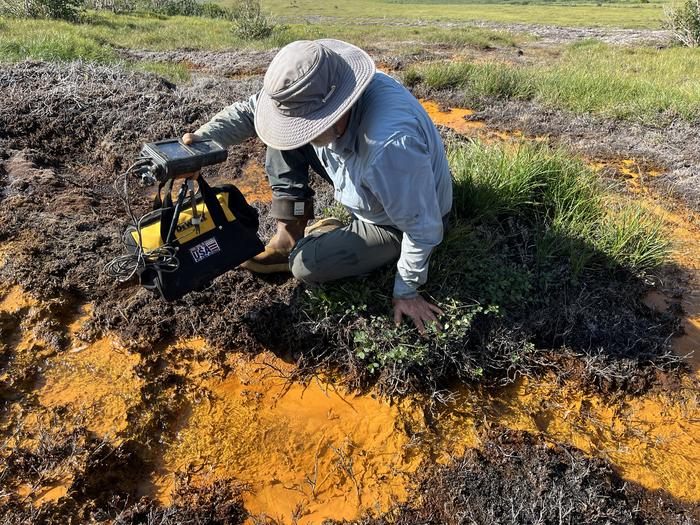
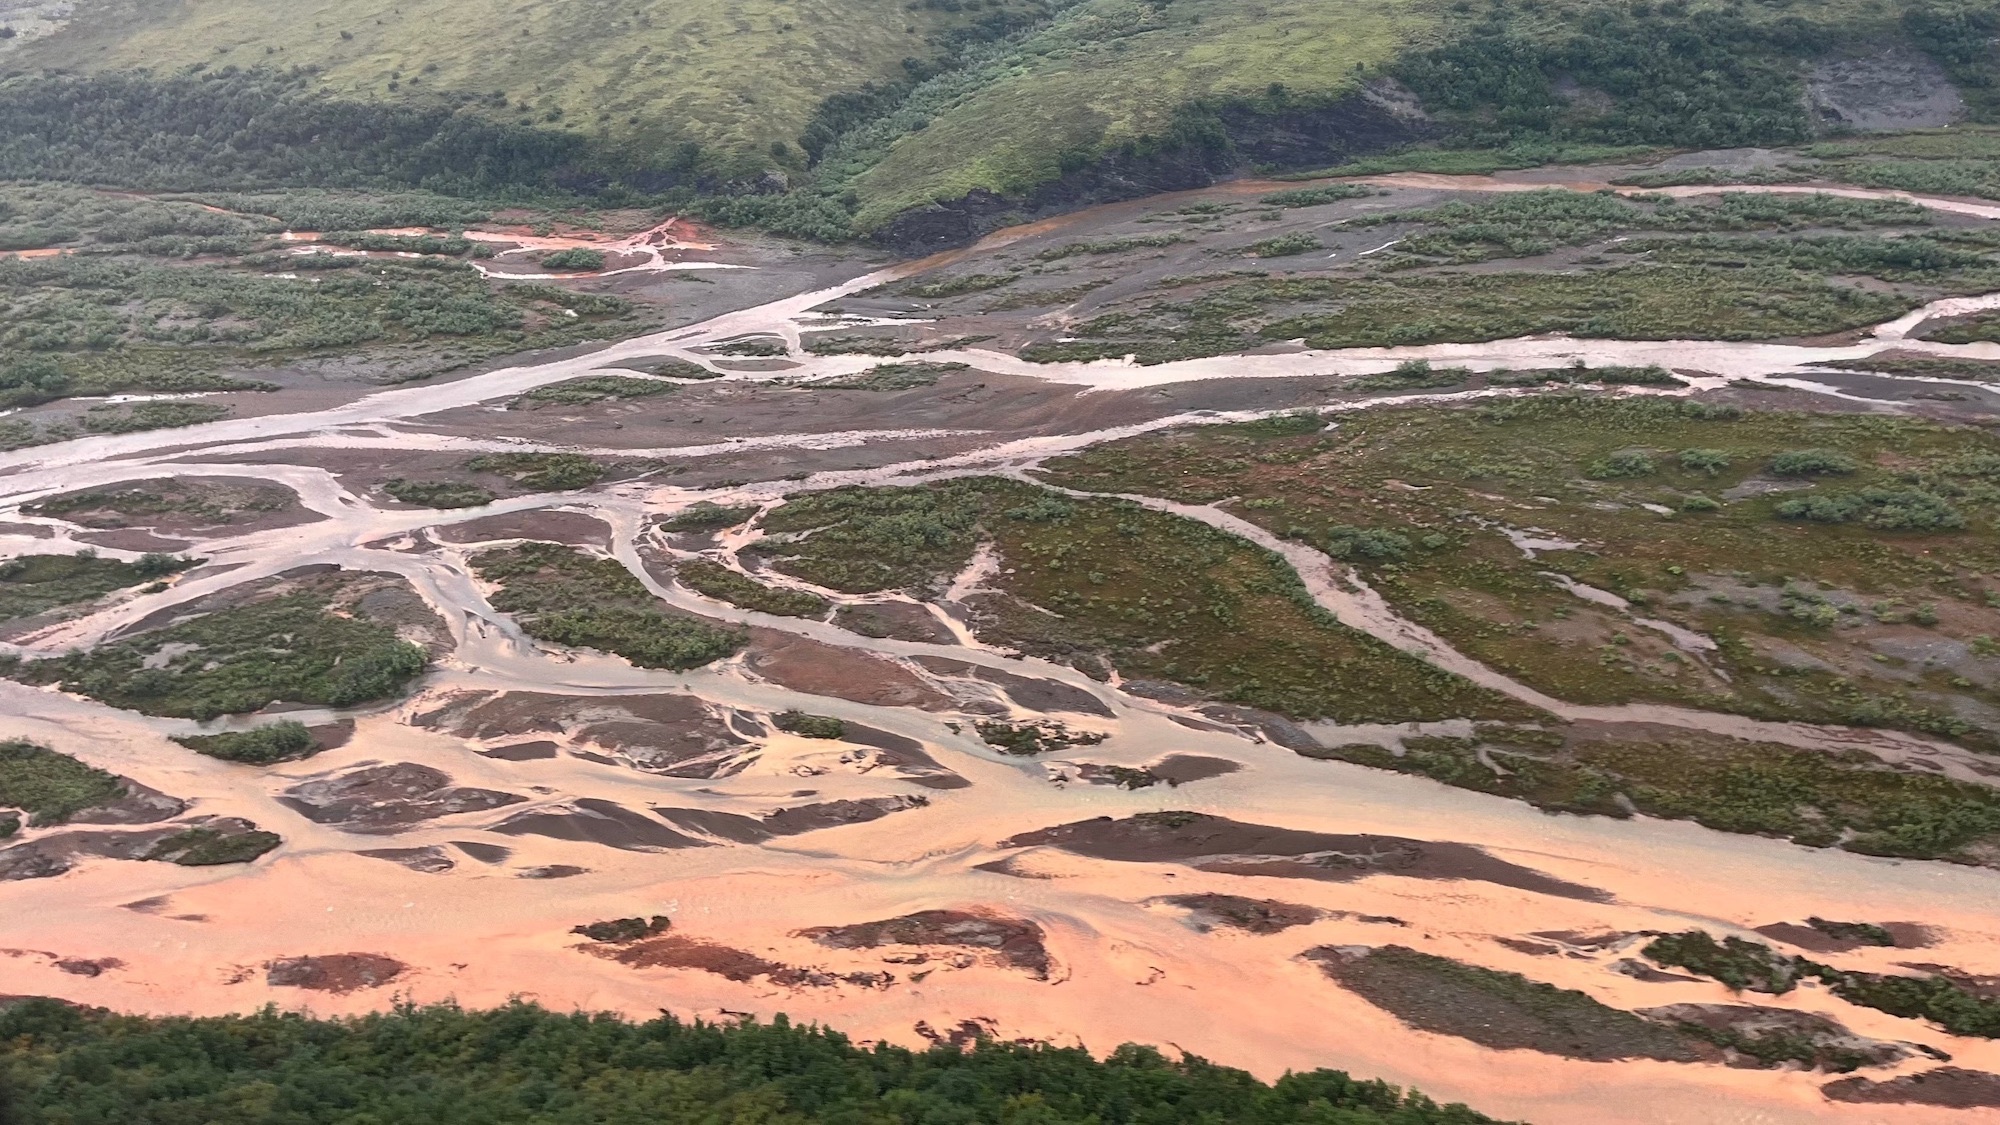
Alaska’s Arctic rivers have a big, orange problem. Previously clear rivers are turning a cloudy orange color due to iron particles, and it’s more than unsightly. The particles can suffocate fish and choke insects, threatening the food web and ecosystem as a whole.
Scientists have long pointed to previously frozen soil beginning to thaw as the potential culprit behind the contamination of rivers in northern Alaska’s remote Brooks Range, and a study recently published in the Communications Earth & Environment proves it. The research also shows two distinct ways that this thawing soil is rusting the rivers and can help scientists predict where the damage is likely to spread next.
“You’d think if any ecosystem could hide from the effects of warming and big human footprints, it’d be this one. But it’s not so,” Tim Lyons, a study co-author and biogeochemist at the University of California, Riverside, said in a statement. “There is no safe place.”
Researcher sampling rusty Alaskan river water. Image: Tim Lyons/UCR.
As the ice-filled permafrost begins to thaw due to climate change, it can turn into mud that can’t support the weight of the soil or vegetation above it. This can threaten human-built infrastructure such as homes, pipes, and roads. It can also expose iron particles from rocks that turn rivers orange, a process called rusting.
Rusting has severe ecological consequences. The fine iron particles can stay suspended in water for over 60 miles, smothering algae, disrupting insect populations, and clogging fish gills. These changes may already be affecting salmon in Alaska and Canada who rely on the gravel riverbeds for spawning and rely on algae as food during early life stages.
A top-down, fool’s gold problem
For this new study, the team looked at a wide regional view of the roughly 600-mile Brooks Range. They then zoomed in on a specific river system, followed by an even closer look at one creek. This top-down approach helped them to connect the bigger regional patterns to specific, on-the-ground processes.
“At middle, more heavily forested elevations, there isn’t much going on. But at the higher and lower elevations we could see distinctly different phenomena,” said Roman Dial, a study co-author math and biology professor emeritus at Alaska Pacific University.
At the higher elevations, the problem begins in the rocky ground containing pyrite, aka fool’s gold. Since the ground was frozen for many years, water and air didn’t affect the pyrite. Yet the rising temperatures have started to melt the ground, kicking off a process called acid rock drainage. The minerals and rocks are exposed to oxygen and water and degrade the water quality.
“When pyrite meets water, it comes apart. It breaks down into iron and sulfur, creating sulfuric acid as well as sulfate and other toxic metals,” said Lyons. “When the iron-rich water mixes with more oxygen, the iron turns into rust-like particles that color the water and stain the bottom sediments orange.”
It’s an entirely different story at the lower elevations. The landscape is covered with wetlands that are changing shape and expanding downward as the permafrost melts. In these more soggy places, the soils are low in oxygen. So instead of breathing in oxygen, the microbes in the water (mostly bacteria) are taking in iron.
“When we breathe, oxygen goes in and gets converted to the carbon dioxide that we exhale,” Dial said. “Similarly, microbes are consuming iron in the lowland soils and converting it into a water-soluble form that seeps into streams and results in rusting as it meets oxygenated surface water.”
Taken together, both acid rock drainage and microbes breathing in more iron help explain why orange waters are appearing across such large and remote regions across northern Alaska, closely tracking to areas where permafrost is thawing.
The direct link
The team also found a delayed effect that could help predict future contamination. During the summer, the active, top layer of soil thaws to its deepest point. It then refreezes before the winter. The iron released during one summer thaw can become trapped and then flushed into rivers the following year.
By studying long-term ground temperature data and stream chemistry, this lag can be used to anticipate increases in metal levels.
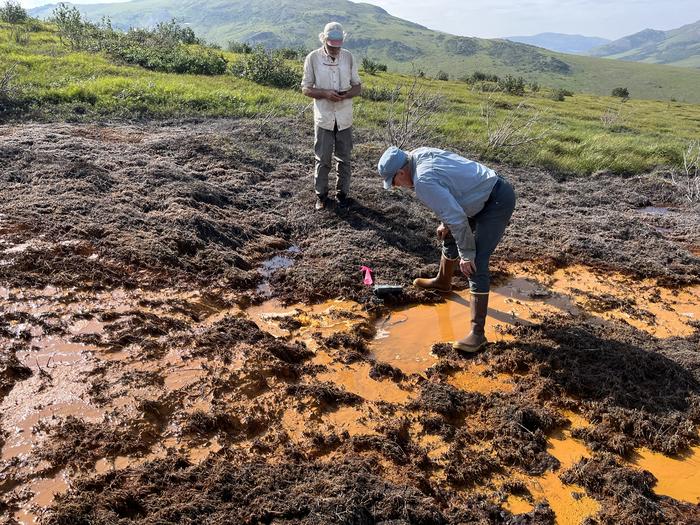
“That means we can use ground temperatures to help predict water quality in the future,” added study co-author and University of Alaska ecologist Paddy Sullivan. In 2019, Sullivan first noticed the dramatic river changes that looked “like sewage” during fieldwork in the region.
Since mines typically control the waters near them to minimize pollution, the team partnered with scientists at the Red Dog zinc mine in northwest Alaska. The scientists there have long-term temperature records from boreholes that are drilled deeply into the earth and from chemistry sampling in stream water. Linking the underground measurements with changes in the stream’s chemistry directly connected the thawing permafrost to the rusting rivers.
While this problem is difficult to contain and manage, predicting where the contamination may pop up next could help pinpoint and protect critical habitats. This forecasting is especially important for communities that depend on these waters and the fishing living there for food and cultural practices.
“There’s no fixing this once it starts,” Lyons said. “But we can give people downstream a heads up and work hard to protect the places that are still safe and less vulnerable to the rusting.”
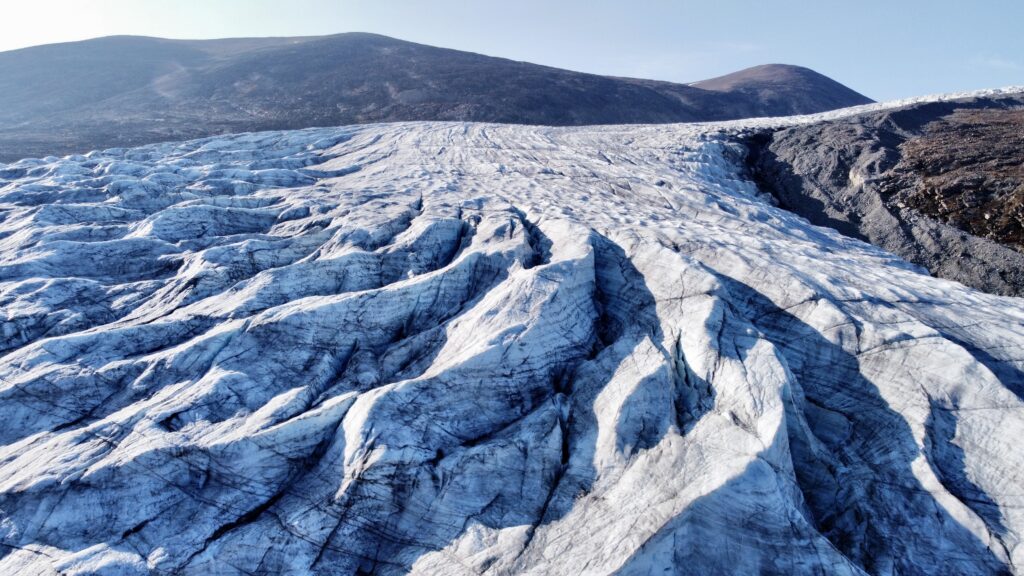
As meltwater drains through and beneath a glacier, it can alter how the ice flows and whether it breaks apart. Meltwater can also cause feedbacks that lead to more ice loss. Understanding when and how glacial meltwater drains is therefore critical to predicting how fast glaciers will lose ice and how that loss will affect sea level.
Chudleyet al. modeled how the rate of water flowing into a glacier relates to seasonal changes in the forces that squeeze and stretch ice—forces caused by gravity pulling the glacier downhill, by the ice sliding over subglacial water, and by how portions of the ice interact with the ocean.
The researchers focused on the Sermeq Kujalleq glacier (also known as Store Gletsjer or Store Glacier) in Greenland. In spring, meltwater can fill cracks, or crevasses, that run through the surface of this glacier. These crevasses sometimes go on to drain as the year progresses.
The researchers used satellite imagery from the Sentinel-2 mission to see how much water was present in crevasses between 2016 and 2022, focusing especially on 2019, when the Sentinel-2 satellites provided the best coverage of the glacier. They fed those data into a convolutional neural network to map water cover through the season and looked for a relationship between the mechanical forces acting on the ice and the formation and drainage of crevasse ponds.
The researchers found that the mechanical forces acting on ice are the dominant factor in determining when crevasse meltwater drains into a glacier. When seasonal changes cause ice to stretch, crevasses can drain suddenly, releasing the water they held.
The Greenland Ice Sheet sheds trillions of gallons of water each year, and knowing when to expect that water to drain through the ice sheet is key to understanding processes such as how the glacier slides across the bed and when meltwater emerges in the ocean. The study’s results likely also shed light on dynamic processes in other glaciers and ice sheets, the authors say, and should help inform representations of ice behavior in numerical models. (AGU Advances, https://doi.org/10.1029/2025AV002150, 2026)
Citation: Sidik, S. M. (2026), Stretching and squeezing release glacial meltwater, Eos, 107, https://doi.org/10.1029/2026EO260152. Published on 26 May 2026.
Prime Minister Mark Carney recently released “A Force of Nature: Canada’s Strategy to Protect Nature.” It describes a vision “that protects, restores, and values nature as a foundation of our economy, sovereignty, and well-being, leading at home and globally, to ensure healthy ecosystems, resilient communities, and prosperity for present and future generations.”
What’s the link between the federal government’s commitment to protect and restore nature and its much-discussed commitment to strengthen national security? It’s a good question.
“A Force of Nature” acknowledges that nature “provides essential defences. Wetlands absorb carbon and excess rainfall, forests prevent erosion, and healthy ecosystems reduce the impacts of severe weather. Protecting nature supports jobs, food security and Canada’s long-term competitiveness on the world stage.”
The 2024 federal report “Our North, Strong and Free: A Renewed Vision for Canada’s Defence” opens with a message from the defence minister: “One of the most important roles of any government is to protect its country and its people. In a rapidly changing world, we are committed to fulfilling this essential responsibility.”
Among other challenges, that report acknowledges security threats posed by climate change, stating, “Our Arctic is warming at four times the global average, opening the region to the world, which was previously protected by the Polar Ice Cap year-round. By 2050, the Arctic Ocean could become the most efficient shipping route between Europe and East Asia. We are seeing greater Russian activity in our air approaches, and a growing number of Chinese vessels and surveillance platforms are mapping and collecting data about the region.” Prime Minister Carney also released a plan to defend the North.
But what about Canada’s obligation to protect its citizens from climate change and biodiversity loss impacts that threaten drinking water (pollution, plastics), the air we breathe (forest degradation), homes (floods and fire events) and food systems (droughts, pollinator declines)?
The federal government seems oblivious to the connection between security and halting and reversing nature loss; there is a misaligned sense of passivity when climate change is identified as a threat. Yes, climate change is already here. But that doesn’t mean the government, which has the power to make laws and regulations, shouldn’t do everything it can to limit ongoing and future climate pollution that will exacerbate current threats, rather than building pipelines and approving new liquefied natural gas projects.
It’s possible to recognize that climate change and nature degradation are significant to national security, as evidenced by the United Kingdom’s 2026 national security assessment, “Global Biodiversity Loss, Ecosystem Collapse and National Security.” Its premise is that, “Nature is a foundation of national security. Biodiversity loss is putting at risk the ecosystem services on which human societies depend, including water, food, clean air and critical resources. The impacts will range from crop failures, intensified natural disasters and infectious disease outbreaks to conflict within and between states, political instability, and erosion of global economic prosperity.”
Canada gets a (dis)honourable mention in the U.K.’s assessment. It notes, “Ecosystem degradation is occurring across all regions. Every critical ecosystem is on a pathway to collapse (irreversible loss of function beyond repair)” and points to the “realistic possibility” of the ecological collapse of Canada’s boreal forest, starting in 2030.
The boreal forest is often referred to as “the lungs of the planet,” as it purifies air and provides oxygen. It also sequesters and stores carbon — in trees, mosses, lichens and soil. It’s being degraded by climate change impacts, industrial logging, mining and oil and gas extraction.
The U.K. doesn’t stand alone. The World Economic Forum’s “Global Risks 2026” report ranked threats by severity, identifying the top three long-term risks as extreme weather events, biodiversity loss and ecosystem collapse, and critical change to Earth systems. Clearly security isn’t merely a matter of protecting against invading armies. Canada’s approach must be integrated. Happily, the federal government can feed two birds with one seed: protecting and restoring natural ecosystems can support national security and deliver on Canada’s commitments outlined in the new nature strategy.
David Suzuki is a scientist, broadcaster, author and co-founder of the David Suzuki Foundation. Written with David Suzuki Foundation Boreal Project Manager Rachel Plotkin.
When we picture the effects of melting glaciers, many of us think of rising seas and retreating ice streams. But along Greenland’s coastline, a quieter transformation is underway, one that is affecting how the ocean breathes and how it reacts to and buffers itself against change.
In Young Sound, a fjord carved into Greenland’s remote northeastern coast, decades of monitoring have revealed that glacial meltwater does not simply dilute the salt in seawater. As fresh water enters the ocean, it weakens the ocean’s natural chemical resistance to swings in acidity. This so-called buffering capacity keeps seawater pH in balance. The loss of buffering due to freshwater runoff leaves these coastal waters unusually sensitive to even small biological and environmental shifts.
Atmospheric warming is accelerating fastest in the Arctic, and with it come longer glacial melt seasons and increased freshwater runoff. The result is a coastal ocean that is both a frontline witness to climate change and a laboratory for understanding how the chemistry of the seas can change in unexpected ways.
The Ocean’s Chemical Safety Net
Seawater chemistry is naturally buffered by dissolved ions that act as chemical shock absorbers.
Globally, the ocean absorbs about a quarter of carbon dioxide (CO2) emissions each year. That uptake helps to slow climate change, but at a cost. The more CO2 that water absorbs, the more acidic it becomes. Thankfully, seawater chemistry is naturally buffered by dissolved ions—particularly carbonate, bicarbonate, and hydroxide—that act as chemical shock absorbers. These negatively charged ions, collectively called alkalinity, bind to the positive hydrogen ions released when carbonic acid forms, keeping the ocean’s pH relatively stable compared with the more variable conditions in freshwater rivers and lakes.
The polar oceans play a special role in this balance and in the global carbon cycle because cold waters at high latitudes take up carbon from the atmosphere faster than warm tropical waters. Yet these regions are also changing the most rapidly.
When Meltwater Meets the Sea
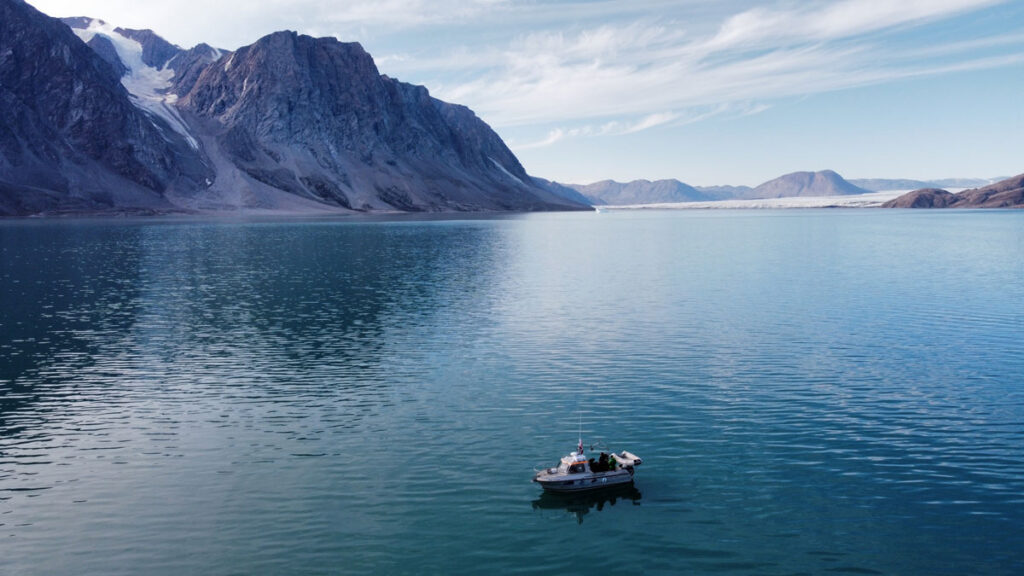
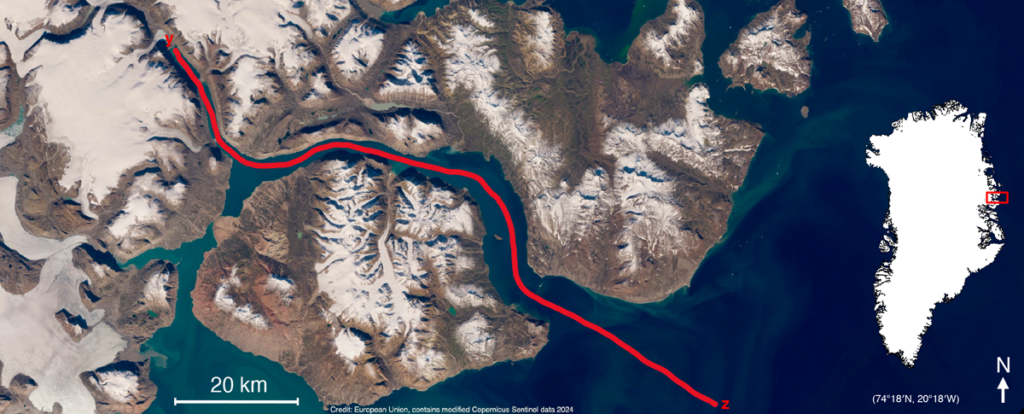
For 20 years, our team at Aarhus University has measured salinity, temperature, and carbon chemistry in Young Sound. Each August, we make the 2-day journey to northeast Greenland, where we spend the month sailing down the 90-kilometer-long fjord to capture these valuable measurements (Figure 1).
Fig. 1. The red line, running from the Greenland Ice Sheet (y) to the Greenland Sea (z), maps the route taken by researchers in August 2023 during their annual transect of Young Sound in northeast Greenland. Credit: Adapted from Henson et al., 2025, https://doi.org/10.1038/s43247-025-02685-4, CC BY-NC-ND 4.0
During the time we have monitored this ecosystem, the melt season has lengthened, with sea ice–free conditions now lasting 8 days longer than 20 years ago. Glaciers feeding the fjord are also thinning and retreating, discharging about 5.5 million cubic meters more water into the fjord each year. These changes have freshened the coastal ocean and subtly, but significantly, altered its chemistry.
Fjords like these have long been known as major CO2 sinks. Surface waters near glaciers often have very low CO2 concentrations, creating a disequilibrium between CO2 levels in the surface ocean and the atmosphere that draws carbon out of the air. But how or why these glacial ecosystems act as carbon sinks and what mechanisms are at play haven’t been thoroughly described. We have also been deeply curious about what else happens when fresh water enters the sea. What are the hidden consequences of this change?
To find out, we paired our long-term field observations with controlled lab experiments in which we mixed glacial meltwater with seawater. Controlled experiments allow us to dig into the nuances of chemical changes that are impossible to measure in the field. We also ran mixing models that allowed us to estimate how the chemistry of those mixed waters responds to small shifts in biological activity or mineral interactions.
The results were striking. When meltwater mixes with seawater, it not only reduces salinity but also dilutes alkalinity, the measure of how well water can neutralize acid and buffer against pH change. This weakening of buffering capacity means that even small changes in photosynthesis or respiration can drive much larger swings in CO2 uptake and acidity than they would in more saline waters.
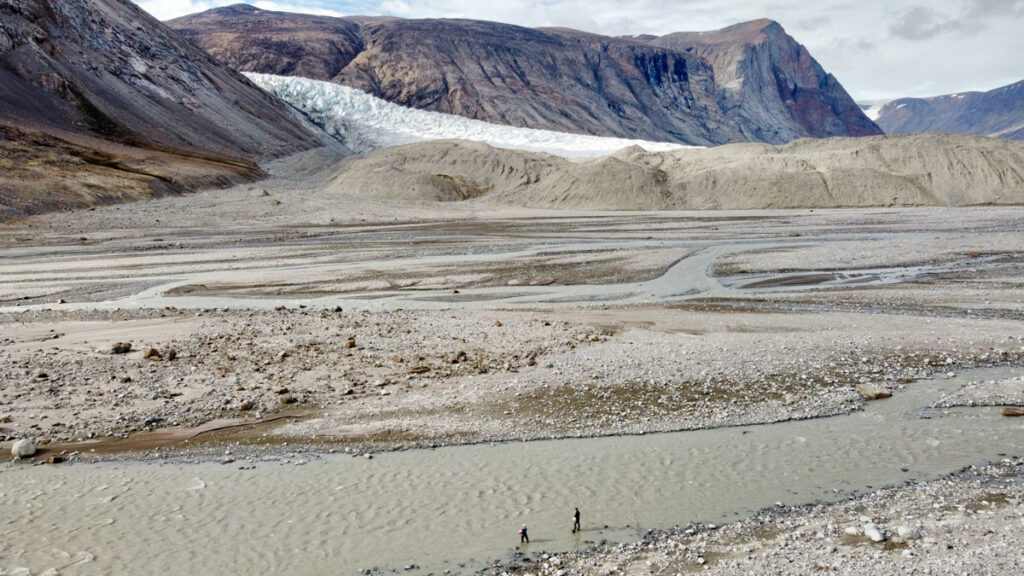
Two researchers wade into a meltwater river in Tyrolerfjord in Northeast Greenland National Park in 2023 to collect samples bearing the chemical fingerprints of climate change in the region. Credit: Henry C. Henson
We found that in the freshened waters of Young Sound, these processes have 2–3 times the influence on carbon uptake that they do farther out at sea. In effect, meltwater primes the coastal ocean to overreact, amplifying any ecosystem changes that might occur.
Measurements from around Greenland show that this is not just a theoretical risk. Surface waters are measurably more acidic where meltwater inputs are high. The biological consequences of this trend are still uncertain, but species living at the edge of their tolerance, such as shell-forming plankton and Arctic cod larvae, could face growing stress as the chemistry of their habitat fluctuates more widely.
A Fragile Balance in the Freshening Arctic
The findings confirm that fjords absorb carbon as a result of biological activity and glacial input but indicate that they do so in a fragile, easily tipped state.
Our study adds nuance to conventional perceptions of carbon cycling in fjords, long seen as places where atmospheric CO2 is drawn down. The findings confirm that fjords absorb carbon as a result of biological activity and glacial input but indicate that they do so in a fragile, easily tipped state. Slight shifts in the processes that pull CO2 out of the air could tip the scales in either direction: toward even more uptake and the accompanying acidification or toward a release of CO2 to the atmosphere.
This chemical sensitivity explains why Arctic fjords can show such strong seasonal and spatial swings in carbon chemistry and why predicting their long-term role in the carbon cycle is difficult. As glaciers retreat and meltwater inputs grow, those sensitivities are likely to intensify.
At first glance, changes in how seawater in the narrow, remote fjords of Greenland reacts to glacial melt might sound like a local concern. But the chemical processes at play have global resonance.
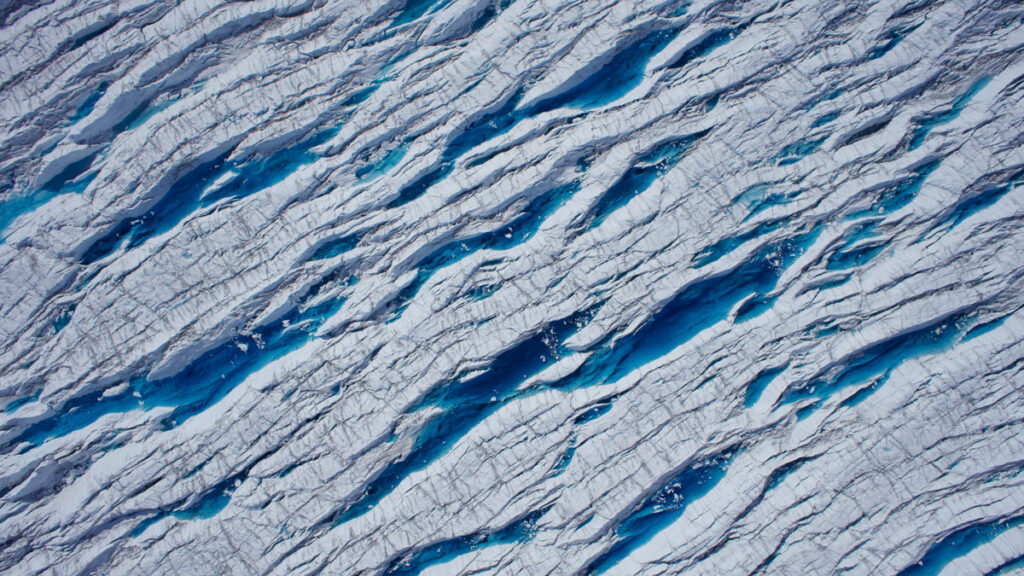
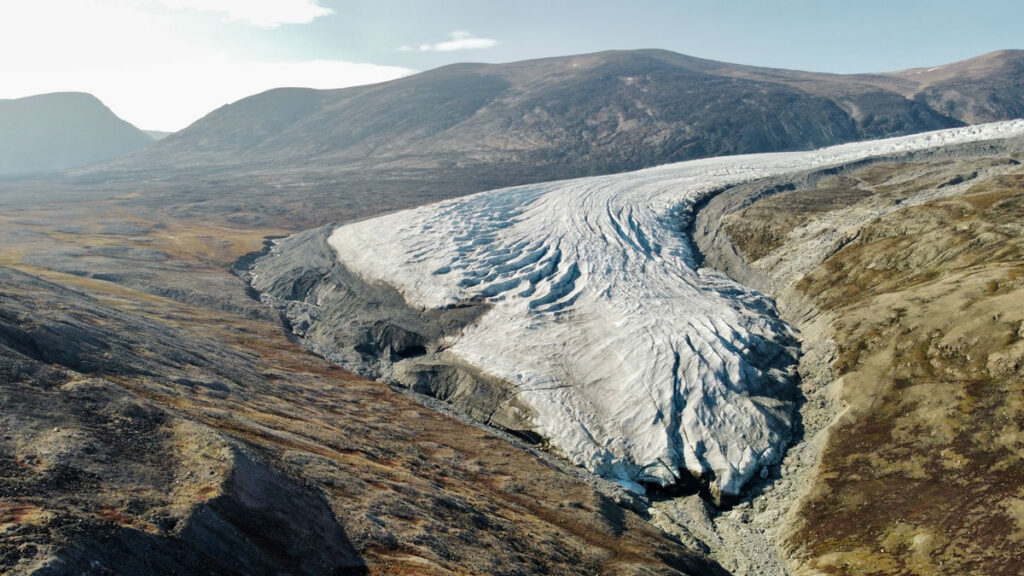
A tongue of the Greenland Ice Sheet retreats along the tundra as temperatures across the Arctic warm. Credit: Henry C. Henson
Ridges in the Greenland Ice Sheet tell a story of movement and melt. Credit: Henry C. Henson
Glacial meltwater from the Greenland Ice sheet flows into Tyrolerfjord and Young Sound and in Northeast Greenland National Park in August 2023. Credit: Henry C. Henson
The Arctic Ocean as a whole is freshening, driven by accelerating ice melt as well as by increasing river discharge and changing weather bringing more precipitation to the region. Although river water, which arrives from the six great Arctic rivers of North America and Eurasia, is more alkaline than glacial melt, its alkalinity is only about half that of seawater. In other words, river runoff also increases the ocean’s chemical sensitivity. Fresh water also delivers organic matter from permafrost, fine sediments from glaciers, and tannin-rich runoff from tundra soils, each of which can influence carbon cycling and further compound changes already underway.
Similar patterns of increased rainfall and runoff reducing surface salinity are emerging around the Antarctic Peninsula, the Gulf of Alaska, and the North Atlantic. Almost everywhere that fresh water enters the ocean, it lowers alkalinity and limits the ocean’s ability to buffer change.
A Window into Climate Intervention
Our results also carry lessons for researchers and companies contemplating ocean chemistry interventions as ways to remove CO2 from the atmosphere. One proposed approach, ocean alkalinity enhancement, involves adding crushed minerals such as lime, olivine, and basalt to seawater to both counteract acidification and increase the ocean’s capacity to take up CO2.
Glacial systems already perform a natural version of this experiment by grinding rock into fine sediment and discharging it into the ocean. Minerals in this sediment react with seawater and shape its carbon chemistry.
Our study suggests that such reactions are especially potent in freshwater-influenced coastal regions, where reduced buffering capacity may amplify chemical responses not only from natural biological processes but also from potential human attempts to alter seawater chemistry. Thus, understanding the balance between carbon uptake and chemical vulnerability will be essential before any large-scale interventions are attempted.
Consequences Locally and Globally
Coastal communities from Greenland to Alaska to northern Eurasia depend on Arctic waters as part of their cultural identity and, by way of fisheries and tourism, for their economic and food security. As chemical buffering capacity declines, coastal ecosystems may become more susceptible to acidification and other environmental stresses. Small changes in temperature, ecosystem metabolism, or nutrient inputs could then have outsized effects on the marine life that supports these communities.
As coastal glaciers retreat and meltwater rivers carve new paths to the sea, they are doing more than raising sea level and reshaping coastlines. They are rewiring ocean chemistry.
At the same time, changing conditions in coastal Arctic ocean regions complicate scientific modeling of carbon cycling and climate feedbacks, which typically relies on averaged estimates of the ocean’s chemical reactivity. With meltwater making the coastal ocean more reactive, these seas may absorb or release CO2 more variably than how global predictions would suggest. In addition to the real effects on local ecosystems, seawater chemical variability could also affect the accuracy of modeled global carbon budgets, which we use to inform future climate projections and guide international policy goals.
As coastal glaciers retreat and meltwater rivers carve new paths to the sea, they are doing more than raising sea level and reshaping coastlines. They are rewiring ocean chemistry, leaving it fresher and more easily disturbed.
The chemical sensitivity we see in Greenland’s fjords today may be a preview of what is to come in many coastal regions. If so, then we must be concerned with not only how much CO2 the ocean can absorb but also how stably it can hold that CO2 in a rapidly changing world.
Author Information
Henry C. Henson (hch@ecos.au.dk), Aarhus University, Denmark
Citation: Henson, H. C. (2026), Melting glaciers make the coastal ocean more sensitive, Eos, 107, https://doi.org/10.1029/2026EO260116. Published on 16 April 2026.