Reading view

Vast Space, Sparse Data: An AI Answer to Twin Space Weather Challenges

Artist’s illustration showing part of the Sun at left, Earth and its magnetosphere at right, and several spacecraft in between. The spacecraft are networked together by curving, glowing green lines.

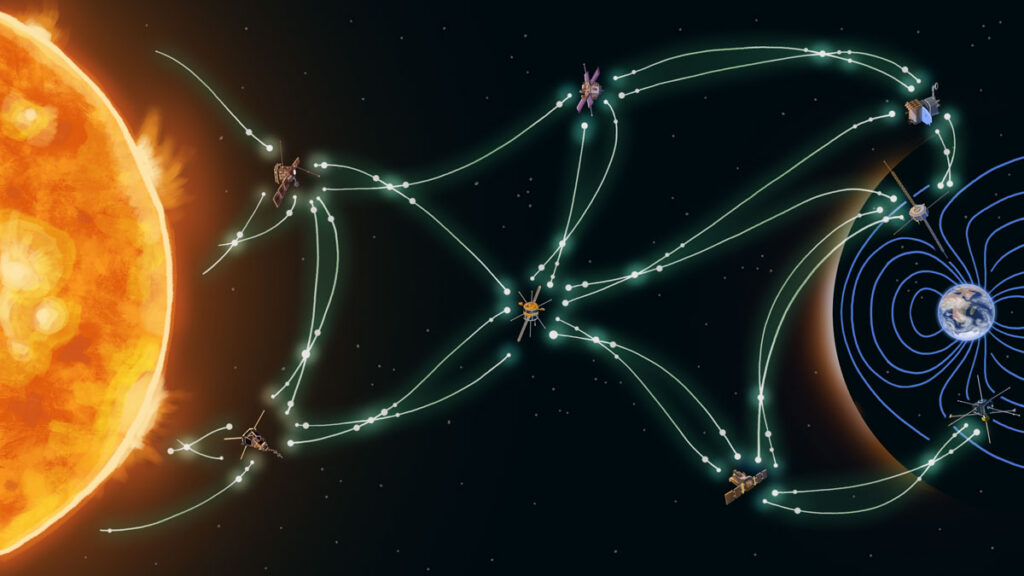
Solar activity affecting Earth and its planetary neighbors encompasses a wide range of phenomena, from the steady solar wind and the interplanetary magnetic field to extreme events like solar flares, coronal mass ejections (CMEs), and solar energetic particle (SEP) events. These space weather phenomena interact in complex ways with planetary magnetospheres and atmospheres. On Earth, we see the results in the dancing lights of stunning auroras and in less frequent but sometimes severe disruptions to telecommunications, navigation, and energy infrastructure.

Forecasting conditions throughout the heliosphere (the region influenced by the solar wind), understanding the variety of Sun-Earth interactions, and predicting arrivals of space weather events—both benign and potentially hazardous—are a grand challenge.

The Sun-Earth challenge requires tracking and predicting conditions—from routine and quiet to rare and extreme—across tens of millions of kilometers of interplanetary space.

Solar flares emit electromagnetic radiation that spreads in all directions. In contrast, the propagation of CMEs and SEP events depends on their source location on the Sun and on the heliospheric magnetic field, which is carried outward by the solar wind. The impacts these events have on magnetosphere systems further vary depending on particle energies and intensities in SEPs and on particle speeds and the magnetic field orientation in CMEs. The Sun-Earth challenge thus requires tracking and predicting conditions—from routine and quiet to rare and extreme—across tens of millions of kilometers of interplanetary space.

This tracking and prediction is powered by petabyte-scale datasets from solar observatories and spacecraft measurements that provide rich observational archives. Researchers use these data to deduce physically meaningful quantities describing the heliosphere and to identify patterns to distinguish quiet from active conditions. The resulting insights not only answer fundamental science questions but also provide critical prediction time frames needed by space weather forecasters.

Even with all these data, the enormity of space between the Sun and Earth presents a major obstacle to our predictive capabilities. Another obstacle is that the data are obtained by different instruments operating at different locations and times. These factors combine to create a unique data sparsity challenge that complicates large-scale analysis.

These fundamental issues—the massive yet still insufficient supply of data available, the extreme differences in the scales of the processes we must illuminate, and the need for actionable predictions—suggest opportunities for artificial intelligence (AI) and machine learning (ML) to complement traditional physics-based analytical approaches [Camporeale, 2019]. In a series of workshops—insights from which inform the discussion below—scientists explored such opportunities and how they can advance heliophysics research and operational space weather forecasting.

The Need for Space Weather Forecasting

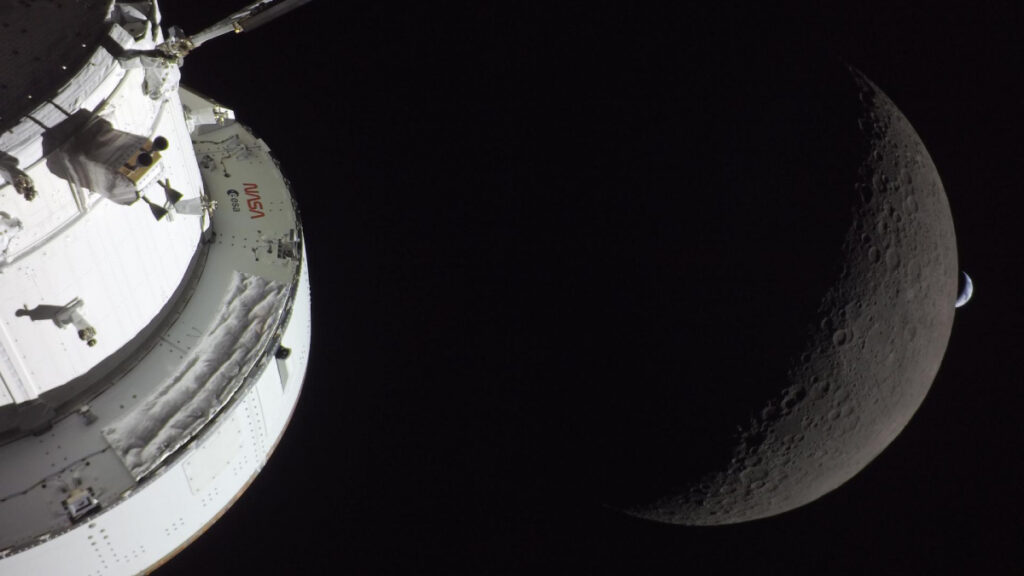
Space weather events can have significant impacts on infrastructure and humans. They can disrupt satellite operations (e.g., by enhancing atmospheric drag on satellites), damage electronics in space, interfere with radio communications and GPS, and even affect power grids (e.g., through geomagnetically induced currents) during the most severe events. They can also pose risks to people, especially astronauts beyond the protection of Earth’s atmosphere and airline crews and passengers on long-distance polar flights, during which exposure to energetic particles is elevated. Forecasting offers a first line of defense in preparing for or preventing damaging and hazardous effects of space weather.

In assessing major CMEs, forecasters consider whether and when events will reach Earth and whether they will trigger geomagnetic storms and substorms. For SEP events, predictions must include arrival times, peak intensities, durations, and energy characteristics.

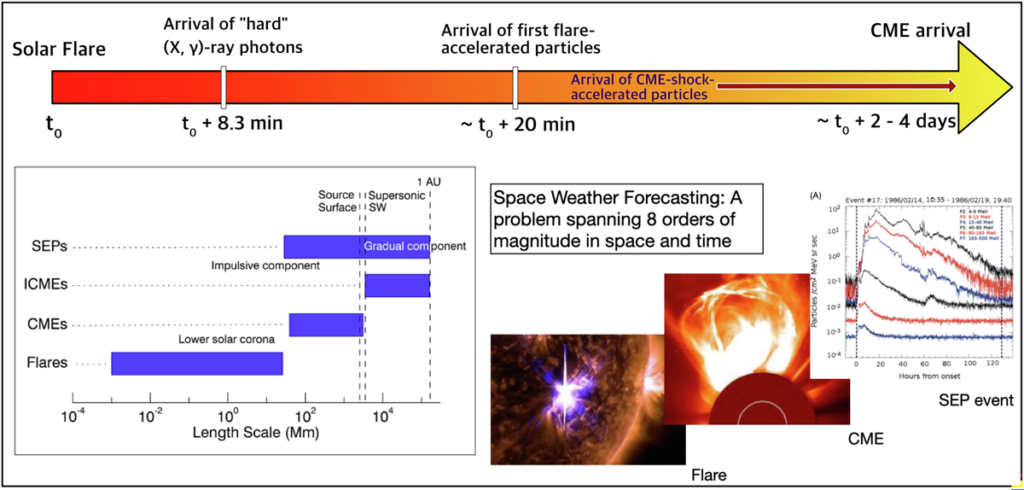
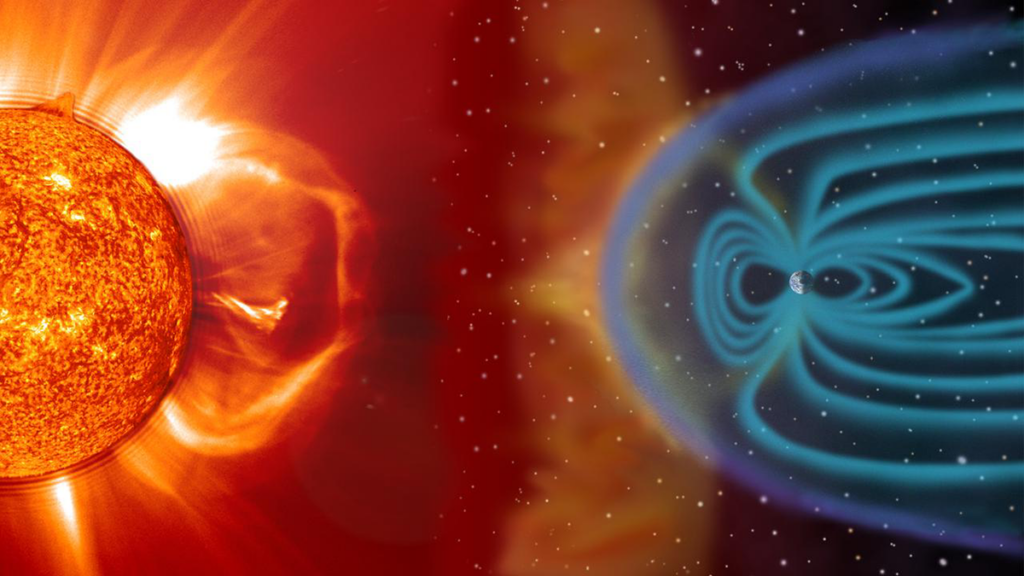
Predicting extreme space weather phenomena is vital, but equally important is forecasting periods when no significant activity is expected, which is critical information for satellite operators and other stakeholders. Making such predictions requires understanding physics spanning 8 orders of magnitude in space and time, from subsecond processes in Earth’s magnetic environment to multiday solar eruptions propagating across the 150 million kilometers between the Sun and Earth (Figure 1) and long-term interactions at scales associated with the 11-year solar cycle.

Diagram illustrating how length scales and Sun-to-Earth transit times vary greatly for different types of space weather, including solar flares, solar energetic particle events, coronal mass ejections, and interplanetary coronal mass ejections
Fig 1. Length scales and Sun-to-Earth transit times vary greatly for different types of space weather (SW), including solar flares, solar energetic particle (SEP) events, coronal mass ejections (CMEs), and interplanetary coronal mass ejections (ICMEs). High-speed particles are the first to arrive, usually within minutes of a flare, whereas CMEs arrive in 2–4 days. Credit: Georgoulis et al. [2026], CC BY-NC-ND 4.0

In addition to operational forecasting, these challenges are fundamental in heliophysics research. Such research includes work to reveal how the Sun generates its magnetic field, how solar wind accelerates and evolves, how planetary magnetospheres respond to external forcing, how particles are accelerated, and how energy transfers across multiple scales and regimes.

Unique Challenges in Heliophysics

Modern AI and ML algorithms excel at analyzing well-curated, extensive datasets that include millions of training examples. For example, AI-aided terrestrial weather forecasting relying on continuous, high-resolution coverage from thousands of ground stations, weather balloons, and satellites has advanced dramatically in recent years.

Fewer than a dozen spacecraft monitor Earth’s magnetosphere, a region spanning tens of Earth radii. Solar wind observations are even sparser.

Heliophysics, however, presents a unique and somewhat opposite scenario. Fewer than a dozen spacecraft monitor Earth’s magnetosphere, a region spanning tens of Earth radii (about 6,371 kilometers). Solar wind observations are even sparser, with just a handful of monitors scattered across the space between the Sun and Earth. This fundamental scarcity poses a challenge for data-driven approaches, which typically depend on abundant observations that are well distributed in space and time to produce trustworthy (i.e., generalizable and reproducible) models.

Data sparsity is further compounded by the relative rarity of intense space weather phenomena such as CMEs, major geomagnetic storms, and extreme substorms, which occur only a few times per solar cycle. Most heliophysical observations capture quiet, low-activity conditions when the solar wind is steady and magnetospheres are calm. Standard ML approaches trained on such imbalanced datasets may achieve high statistical accuracy by simply predicting a “nothing-will-happen” outcome but completely fail when extreme events occur.

Although solar eruptions and geomagnetic storms are relatively rare, they exhibit recurring patterns and consistency in their physical drivers. This regularity suggests that historical observations, when properly clustered and analyzed, can be used to enhance prediction capabilities. The challenge therefore lies in extracting meaningful patterns from sparse measurements of rare events while avoiding models that work well for average conditions but fail when they matter most [Chu et al., 2025].

AI Solutions for Data Sparsity

Heliophysics research employs clever approaches to extract maximum information from the limited available observations. One strategy is to mine multidecade observational records from various satellites and to match and group together measurements collected at times with similar solar wind and geomagnetic activity conditions.

This process clusters tens of thousands of data points from similar magnetospheric states. Such clustering enables reconstruction of dynamic features like nightside magnetic field changes during substorms [Stephens et al., 2019] and the presence of near-Earth magnetotail reconnections [Angelopoulos et al., 2020].

Another, more universal approach is to embed fundamental physical laws directly into ML models through physics-informed neural networks [Raissi et al., 2019], ensuring that predictions respect physical reality even when training data are limited. Data assimilation techniques used in weather forecasting similarly blend sparse observations with physics-based simulations and update models as new measurements arrive.

This animated model shows Earth’s magnetosphere during a powerful May 2024 geomagnetic storm that involved strong solar flares and multiple CMEs. The visualization uses the Multiscale Atmosphere-Geospace Environment (MAGE) model from the Johns Hopkins Applied Physics Laboratory to depict wind rushing toward Earth and disturbing its magnetic field (orange and purple lines). The green cloud represents electric field current intensity; the blue squiggles are tracers of solar wind velocities. Credit: NASA Scientific Visualization Studio and NASA DRIVE Science Center for Geospace Storms

These methods converge on a common theme: building gray box models (so named because they’re less opaque than black box models) that are data driven but grounded in physically real constraints. For data-starved applications, hybrid approaches can outperform purely data-driven or purely physics-based methods [Liu et al., 2025].

Satellite instruments are generating increasingly large solar wind datasets. However, the variables obtained (e.g., solar wind speed and pressure) are highly intercorrelated [Borovsky, 2018], making it difficult to identify which ones truly drive magnetospheric responses. New algorithms are helping to distill datasets without losing critical scientific information [e.g., Camporeale, 2025]. Meanwhile, advanced statistical and ML methods can cut through dataset complexity by reducing dimensionality, identifying causal relationships among variables, and providing clues about dominant drivers.

For instance, information theory provides tools to detect dependencies in complex systems, establish causality, and rank variables that most effectively predict space weather outcomes [Wing et al., 2022]. Such techniques can be paired with other “explainable” tools, such as SHAP (SHapley Additive exPlanations) values, a method inspired by game theory, to pinpoint physical variables (e.g., solar wind speed or magnetic orientation) that drive a prediction [Ma et al., 2023].

Distilling datasets and improving model interpretability help make ML more practical and more scientifically trustworthy and its predictions more robust. But fully trusting ML models in operational environments requires rigorous validation and uncertainty quantification. These models must not only make predictions but also indicate their confidence levels for operational decisionmaking.

When a model forecasts a major geomagnetic storm, operators need to know whether that prediction carries 60% or 95% confidence, for example.

When a model forecasts a major geomagnetic storm, operators need to know whether that prediction carries 60% or 95% confidence, for example. Ensemble approaches, in which multiple models provide a range of outcomes, help quantify this uncertainty, while using standardized, well-documented datasets enables fair model intercomparisons.

The research community is developing ML-ready benchmark datasets with consistent formatting and clear metadata to establish such validation procedures [e.g., Angryk et al., 2020]. These resources allow researchers to test new algorithms against common baselines, accelerating progress while ensuring that advances are robust and reproducible rather than artifacts of specific data processing choices.

Notably, one domain in heliophysics that is not affected by severe data sparsity is solar imaging. Decades of continuous, high-resolution observations from the Solar Dynamics Observatory (SDO), which delivers 1.5 terabytes of data every day, have created enormous data archives. Because the Sun drives space weather throughout the heliosphere, these datasets offer an ideal opportunity for use in foundation models, large-scale ML systems trained to learn comprehensive internal representations that can then be easily adapted to specific scientific tasks with minimal additional training.

Surya, a foundation model designed to construct a digital representation of the Sun, represents one such effort. It is still in early development and has yet to be validated, but this approach illustrates how data-rich domains can be leveraged with modern AI techniques to create tools that broadly benefit heliophysics research and space weather forecasting.

Advancing Research and Operational Forecasting Together

In addition to the needs for data and model development and validation, applying AI to address the challenges of heliophysics requires sustained, multidisciplinary collaborations. Fostering those collaborations has been the focus of a series of workshops, with the most recent being 2025’s Machine Learning, Data Mining and Data Assimilation in Geospace (LMAG25) meeting at the Johns Hopkins University Applied Physics Laboratory. The workshops have brought together heliophysicists, machine learning experts, data scientists, and specialists from weather forecasting and applied mathematics to exchange knowledge and establish community standards.

Space weather forecasters need models that are accurate and interpretable and that provide not just statistical metrics but also actionable predictions.

The LMAG forums also serve as gathering spaces for scientists to validate models against diverse datasets, compare physics-based and data-driven approaches, develop performance benchmarks, and discuss how to bridge research and operational requirements. Space weather forecasters need models that are accurate and interpretable and that provide not just statistical metrics but also actionable predictions with known limitations and reliability. Of course, researchers also benefit. These conversations allow them to gain insight into operational constraints that shape how modeling approaches become practical in real-world settings.

LMAG and similar initiatives facilitate direct exchanges among adjacent communities, including by making meeting presentations openly available. These efforts are helping translate cutting-edge AI and ML techniques into practical tools that help protect critical infrastructure and human well-being. They are also deepening our understanding of how the Sun shapes space weather throughout the solar system and its effects—both mundane and major—on Earth.

References

Angelopoulos, V., et al. (2020), Near-Earth magnetotail reconnection powers space storms, Nat. Phys., 16(3), 317–321, https://doi.org/10.1038/s41567-019-0749-4.

Angryk, R. A., et al. (2020), Multivariate time series dataset for space weather data analytics, Sci. Data, 7(1), 227, https://doi.org/10.1038/s41597-020-0548-x.

Borovsky, J. E. (2018), The spatial structure of the oncoming solar wind at Earth and the shortcomings of a solar-wind monitor at L1, J. Atmos. Sol. Terr. Phys., 177, 2–11, https://doi.org/10.1016/j.jastp.2017.03.014.

Camporeale, E. (2019), The challenge of machine learning in space weather: Nowcasting and forecasting, Space Weather, 17(8), 1,166–1,207, https://doi.org/10.1029/2018SW002061.

Camporeale, E. (2025), PARIS: Pruning Algorithm via the Representer theorem for Imbalanced Scenarios, arXiv:2512.06950, https://doi.org/10.48550/arXiv.2512.06950.

Chu, X., et al. (2025), Imbalanced Regression Artificial Neural Network Model for Auroral Electrojet Indices (IRANNA): Can we predict strong events?, Space Weather, 23(5), e2024SW004236, https://doi.org/10.1029/2024SW004236.

Georgoulis, M. K., et al. (2026), Prediction of solar energetic events impacting space weather conditions, Adv. Space Res., in press, https://doi.org/10.1016/j.asr.2024.02.030.

Liu, Y., et al. (2025), Data-driven modeling of electrostatic turbulence by physics-informed Fourier neural operator, Mach. Learn. Sci. Technol., 6(4), 045050, https://doi.org/10.1088/2632-2153/ae19cd.

Ma, D., et al. (2023), Opening the black box of the radiation belt machine learning model, Space Weather, 21(4), e2022SW003339, https://doi.org/10.1029/2022SW003339.

Raissi, M., P. Perdikaris, and G. E. Karniadakis (2019), Physics-informed neural networks: A deep learning framework for solving forward and inverse problems involving nonlinear partial differential equations, J. Comput. Phys., 378, 686–707, https://doi.org/10.1016/j.jcp.2018.10.045.

Stephens, G. K., et al. (2019), Global empirical picture of magnetospheric substorms inferred from multimission magnetometer data, J. Geophys. Res. Space Phys., 124(2), 1,085–1,110, https://doi.org/10.1029/2018JA025843.

Wing, S., et al. (2022), Modeling radiation belt electrons with information theory informed neural networks, Space Weather, 20(8), e2022SW003090, https://doi.org/10.1029/2022SW003090.

Author Information

Savvas Raptis (savvas.raptis@jhuapl.edu), Manolis K. Georgoulis, Mikhail Sitnov, Anthony Sciola, and Simon Wing, Johns Hopkins University Applied Physics Laboratory, Laurel, Md.

Citation: Raptis, S., M. K. Georgoulis, M. Sitnov, A. Sciola, and S. Wing (2026), Vast space, sparse data: An AI answer to twin space weather challenges, Eos, 107, https://doi.org/10.1029/2026EO260188. Published on 11 June 2026.
Text © 2026. The authors. CC BY-NC-ND 3.0
Except where otherwise noted, images are subject to copyright. Any reuse without express permission from the copyright owner is prohibited.
  •  

NASA Announces “Realignment” Toward Human Spaceflight

A photo of the Orion spacecraft in front of a crescent of the farside of the Moon, which is in front of a crescent of the Earth in the distance

Research & Developments is a blog for brief updates that provide context for the flurry of news regarding law and policy changes that impact science and scientists today.

Today, NASA announced an agencywide realignment that includes combining related mission directorates to sharpen the agency’s focus on human spaceflight.

“This initiative reflects NASA’s extreme focus on executing the mission in direct support of the National Space Policy,” NASA Administrator Jared Isaacman said in a press release about the realignment.

The National Space Policy refers to Executive Order 14369: Ensuring American Space Superiority, which was released by the Trump administration in December 2025. The order sets national priorities of returning Americans to the Moon, establishing a lunar base, developing a nuclear reactor in space, developing the commercial space economy, and enhancing the United States’ national security space architecture.

A dark Moon haloed by eclipsed sunlight, with several stars dotted all around.
NASA’s Artemis II crew captured this image of the Moon eclipsing the Sun during their flyby of the Moon on 6 April 2026. Credit: NASA

NASA’s six existing mission directorates will be slimmed down to four. Exploration Systems Development and Space Operations will be combined into a new Human Spaceflight Mission Directorate and will facilitate human spaceflight in low-Earth and lunar space environments. Aeronautics Research and Space Technology will be folded into a new Research and Technology Mission Directorate, tasked with researching and developing nuclear power and propulsion. The structure of the Science Mission Directorate (SMD) and Mission Support Directorate remain unchanged at the time of publication. All directorate leaders will now report directly to the NASA Administrator (Isaacman) to ensure that each remains focused on their directorate’s new mission.

“There will be no reduction in force, no program cancellations, no closures, but we will achieve cost savings through more efficient execution and taking an active role in delivering the outcomes the world has been waiting for from NASA,” Isaacman said.

More Efficient?

At first glance, it is hard to see how combining four mission directorates into two, refocusing the missions of each, and pushing for increased efficiency and cost reduction will not result in some loss of talent either through positions being eliminated or individuals finding themselves in jobs they do not want to hold.

In a letter to NASA employees, Isaacman went into more detail about the specifics of this realignment and described how it will shift the agency’s internal bureaucratic authority away from directorates and toward NASA’s field centers. Prior to this, centers like Goddard Space Flight Center in Greenbelt, Md., and Johnson Space Center in Houston would need to compete for funding that had been appropriated to directorates based on the programs or missions they were tasked with.

A NASA source based in Houston told Ars Technica that the competition for funding “has been an absolute disaster.”

This new realignment “will adjust the funding distribution, so Centers have the financial support needed to sustain the baseline critical capabilities independent of near-term mission assignment,” Isaacman stated. “This shift will allow Center Directors to focus on maintaining the infrastructure, workforce, and capabilities required for current and future missions.”

Isaacman was unclear about when these changes will take effect, and policy analysts are unsure whether the realignment will be recognized by Congress through its appropriations process. The most recent Fiscal Year 2027 appropriations bill for NASA, which advanced out of the House Committee on Commerce, Justice, and Science on 13 May, allocates funding for six mission directorates, not four. The Senate appropriations committee is expected to release its proposed budget for NASA in the coming weeks, and the two bills must still undergo a lengthy reconciliation process.

In fiscal year 2026, Congress broke with the president’s budgetary priorities for NASA and passed a budget that ignored several of the administration’s proposed financial and mission cuts. Whether Congress will do the same this year and maintain the prior breakdown of directorates will become clear in the coming months.

—Kimberly M. S. Cartier (@astrokimcartier.bsky.social), Staff Writer

These updates are made possible through information from the scientific community. Do you have a story about how changes in law or policy are affecting scientists or research? Send us a tip at eos@agu.org.

A photo of a hand holding a copy of an issue of Eos appears in a circle over a field of blue along with the Eos logo and the following text: Support Eos’s mission to broadly share science news and research. Below the text is a darker blue button that reads “donate today.”
Text © 2026. AGU. CC BY-NC-ND 3.0
Except where otherwise noted, images are subject to copyright. Any reuse without express permission from the copyright owner is prohibited.
  •  

Carbon-Rich Rocks May Have Cooled the Ancient Martian Atmosphere

A photograph from the surface of Mars shows two insets zoomed in on rocks. The insets show the rocks with a rough texture and blue and gray colors.
Source: Journal of Geophysical Research: Planets

Orbital imaging has hinted that Mars may have carbon-containing rocks called carbonates on its surface. Carbonates on Mars could offer new insights into how water interacted with rock on the Red Planet, helping scientists learn more about its past. In addition, because carbonates on Earth are primarily produced by living organisms, these rocks are high-value targets in the search for signatures of past life on Mars.

NASA’s Perseverance rover has been traversing Mars since 2021, covering more than 41 kilometers, much of it within Jezero Crater in the Nili Fossae region. Previous orbital data indicated the crater contains carbonates, as well as abundant olivine, which can change to carbonate in the presence of water and carbon dioxide. Now Clavé et al. have analyzed spectroscopic data from Perseverance’s SuperCam instrument suite from multiple locations within Jezero Crater, providing clear evidence of carbonates on Mars, as well as detailed information on how the mineralogy varies between locations.

The authors confirmed the presence of both carbonates and olivine-bearing rocks throughout Jezero Crater and found a generally inverse relationship between the two minerals. By contrast, carbonates were generally positively correlated with the presence of hydrated silica. The researchers hypothesize that an ancient lake in the crater, along with potential hydrothermal activity, played a role in transforming olivine to carbonate. The varying amounts of carbonate and different alteration states seen today may have been caused by changing lake levels on Mars billions of years ago, the researchers suggest.

Amounts of carbonate by weight vary between locations, from 1%–3% in the Séítah unit to 6%–16% in the Eastern Margin Unit. Extrapolating to the entire regional olivine-rich unit, the researchers calculated it could contain as much as 1.1 × 10¹⁴ kilograms of carbon, or up to 0.4% of the current total mass of the Martian atmosphere. Overall, Mars’s crust could contain significant amounts of carbon, implying that widespread carbon sequestration may have cooled the planet significantly in the past. (Journal of Geophysical Research: Planets, https://doi.org/10.1029/2025JE009107, 2026)

—Nathaniel Scharping (@nathanielscharp), Science Writer

A photo of a telescope array appears in a circle over a field of blue along with the Eos logo and the following text: Support Eos’s mission to broadly share science news and research. Below the text is a darker blue button that reads “donate today.”
Citation: Scharping, N. (2026), Carbon-rich rocks may have cooled the ancient Martian atmosphere, Eos, 107, https://doi.org/10.1029/2026EO260170. Published on 28 May 2026.
Text © 2026. AGU. CC BY-NC-ND 3.0
Except where otherwise noted, images are subject to copyright. Any reuse without express permission from the copyright owner is prohibited.
  •  

Undulations in Auroral Arcs at Plasmaspheric Plume Boundary

Photo of aurora taken from the International Space Station.
Editors’ Highlights are summaries of recent papers by AGU’s journal editors.
Source: AGU Advances

Most auroras appear in the “auroral oval” at high latitudes surrounding the magnetic poles. However, some can appear as a detached auroral arc from the auroral oval, at lower latitudes in mid-afternoon and connected to the oval only at a tip or two. Such a detached arc is believed to be linked to the “plasmaspheric plume,” the tongue-shaped extension of the plasmasphere during the recovery phase of a geomagnetic storm. (The plasmasphere is the torus-shaped region of cold, dense plasma above the low- and mid-latitude ionosphere.) The surface waves at the plume boundary cause it to ripple and modulate the various plasma waves in the plume.

Based on observations from multiple satellites and ground stations, Feng et al. [2026] find sawtooth-like undulations along the equatorward boundary of a detached auroral arc in the ultraviolet that was produced by energetic (>keV) electrons and accompanied by energetic (>10 keV) ions. The authors attribute the undulations to Electromagnetic Ion Cyclotron (EMIC) waves that are modulated by the surface waves and resonating with the energetic ions. The study unravels the fine-scale structures of detached auroral arcs and sheds important light on the dynamics underlying their formation.

Schematic illustration of the formation mechanism for the sawtooth-like undulations of a detached auroral arc. The surface waves modulate the Electromagnetic Ion Cyclotron (EMIC) waves in the plasmaspheric plume, causing the energetic ions to precipitate into the ionosphere and resulting in the formation of an afternoon detached auroral arc with sawtooth-like undulations. Credit: Feng et al. [2026], Figure 4

Citation: Feng, H., Wang, D., Hao, Y., Miyoshi, Y., Fu, H., Jun, C.-W., et al. (2026). First observation of sawtooth-like undulations in afternoon detached auroral arcs modulated by surface waves at the plasmaspheric plume boundary. AGU Advances, 7, e2025AV002234. https://doi.org/10.1029/2025AV002234

—Andrew Yau, Editor, AGU Advances

Text © 2026. The authors. CC BY-NC-ND 3.0
Except where otherwise noted, images are subject to copyright. Any reuse without express permission from the copyright owner is prohibited.
  •  

Taking the Pulse of Atmospheric Drag to Predict Satellite Trajectory

Illustration of a satellite orbiting Earth.
Editors’ Highlights are summaries of recent papers by AGU’s journal editors.
Source: AGU Advances

In low Earth orbit (typically below about 700 kilometers altitude), atmospheric drag is the primary source of uncertainty when predicting the trajectories of satellites. These prediction errors largely arise from limitations and inaccuracies in the models used to estimate the density of the upper atmosphere, particularly within the thermosphere.

Mutschler et al. [2026] introduce a new method for estimating atmospheric density along the path of an individual satellite by using Energy Dissipation Rates (EDRs). The derived single-satellite density measurements provide valuable insight into variations in thermospheric density and can help characterize how the upper atmosphere responds to disturbances such as geomagnetic storms. Incorporating these observations can contribute to ultimately improving the accuracy of satellite orbit predictions.

Effective density and Space Force effective density estimated by the Kosmos 1508 satellite (plotted on the right-hand y axes) compared to estimates from satellites Swarm-A and Swarm-C (plotted on the left-hand y-axes). Credit: Mutschler et al. [2026], Figure 17a

Citation: Mutschler, S., Pilinski, M., Zesta, E., Oliveira, D. M., Delano, K., Garcia-Sage, K., & Tobiska, W. K. (2026). First results of a new inversion tool for thermospheric neutral mass density computations during severe geomagnetic storms. AGU Advances, 7, e2025AV002079. https://doi.org/10.1029/2025AV002079

—Alberto Montanari, Editor-in-Chief, AGU Advances

Text © 2026. The authors. CC BY-NC-ND 3.0
Except where otherwise noted, images are subject to copyright. Any reuse without express permission from the copyright owner is prohibited.
  •  

Interstellar Comet Was Born in a Very Cold Place

A bright white point is surrounded by a large, soft blue glow that fades gradually into a dark background. Thin, faint streaks appear diagonally across the image, suggesting motion or stars in the distance. The overall effect is of a luminous object in space, radiating light against a deep, dark backdrop.

In late 2025, astronomers spotted an interstellar comet making a quick trip through the solar system. 3I/ATLAS was discovered in July when it was just inside Jupiter’s orbit. It’s now about halfway between Jupiter and Saturn and getting farther away every day.

A bright, oval shape glows near the center of a black, star-filled sky as it moves diagonally toward the top right of the frame. It has a soft halo around it and a faint, wispy tail stretching downward. Countless tiny white stars dot the background.
The European Space Agency’s Jupiter Icy Moons Explorer (ESA JUICE) mission, on its way to Jupiter, imaged 3I/ATLAS on 5 November 2025 when the comet was 64 million kilometers from the spacecraft. Credit: ESA/Juice/JANUS, CC BY-SA 3.0 IGO

Astronomers have been observing 3I/ATLAS throughout its journey inward toward the Sun and back out again, compiling the most comprehensive and detailed view thus far of an interstellar object, including the chemistry of the gases that sublimated from its surface and formed its coma and tail.

In a first-of-its-kind observation of an interstellar object (ISO), researchers have discovered that the ratio of deuterium to hydrogen in 3I/ATLAS’s outgassed water is 30–40 times higher than in solar system objects. That suggests that the comet formed in a much colder environment than our own solar system did.

“It is always hard to really pinpoint where these objects form,” said Luis E. Salazar Manzano, the lead researcher on these observations and a doctoral student at the University of Michigan in Ann Arbor. “We know that they were formed in different parts of the galaxy, but it’s hard to connect what we measure with how they were formed. These types of measurements, such as the relative abundance of deuterium to hydrogen in water, are one of the best ways we have to actually [learn] about their forming conditions and their evolution.”

Coming In from the Cold

Water appears to be ubiquitous throughout the universe, sprinkled within distant galaxies and in star-forming nebulae. But there are different flavors of water: heavy, semiheavy, and plain old H2O. In the molecular clouds where stars form, the cold environment favors a chemical reaction that increases the amount of gaseous deuterium (D), an isotope of hydrogen, relative to regular hydrogen atoms. That deuterium then bonds with hydrogen and oxygen atoms to create semiheavy water, or HDO.

By measuring the quantity of semiheavy water relative to regular water in an object, scientists can infer the object’s ratio of deuterium to hydrogen, or D/H, and decode the physical conditions in which that water formed. Astronomers have made such measurements for baby stars, planet-forming disks, solar system comets, and meteorites, as well as Earth’s ocean.

“What is fundamentally important about ISOs is that they are physical leftovers of the process of forming another planetary system and they can give us clues to that process,” said Karen Meech, an astrobiologist at the University of Hawaiʻi at Mānoa who was not involved with this research.

“The conditions in the stellar system in which 3I/ATLAS formed may have been quite different from the one in the solar system.”

The team observed 3I/ATLAS with the Atacama Large Millimeter/submillimeter Array (ALMA) in Chile on November 2025 when the comet was 335 million kilometers (208 million miles) from Earth. It had just passed its closest approach to the Sun and was as bright as it was ever going to be. This timing was critical for the measurements the team wanted to make because the signal for HDO is very subtle, especially when it has to compete with the much more abundant H2O in the comet and within Earth’s atmosphere, Salazar Manzano explained.

Those measurements showed that for every 1,000 hydrogen atoms in 3I/ATLAS, there were about 5–7 deuterium atoms. While that’s not a lot, the ratio is still at least 40 times more than what’s found in ocean water and at least 30 times the average value in solar system comets.

“The conditions in the stellar system in which 3I/ATLAS formed may have been quite different from the one in the solar system,” said Paul Hartogh, a physicist and atmospheric science researcher at the Max Planck Institute for Solar System Research in Göttingen, Germany.

The first interstellar object, 1I/ʻOumuamua, did not outgas any material, and although the second object, 2I/Borisov, did, it was not bright enough to detect deuterium. 3I/ATLAS was the first opportunity astronomers had to measure the D/H ratio of an interstellar comet. Those measurements suggest that 3I/ATLAS formed in a much colder galactic environment than the solar system did, less than 30°C above absolute zero. The team published these results in Nature Astronomy in April.

Planning for the Next Interstellar Visitor

Hartogh, who was not involved with this research, said that on the one hand, 3I/ATLAS’s high deuterium enrichment is surprising because it is higher than that of any known comet. On the other hand, he added, some scientists predicted such high values for cometary water several decades ago.

Meech said she found these results “really interesting.” She never expected all other solar systems to have formed just like ours, and 3I/ATLAS fits with that idea.

“This gives us an intriguing look into the processes of planetary system formation—and that there are differences from our own solar system,” Meech said. “It is too early to tell what this implies for the formation of planets or habitable worlds. We are just at the beginning of an exciting story.”

“The fact that we were able to make this measurement with 3I will allow us to better prepare what to expect with the next generation of interstellar objects.”

3I/ATLAS is getting harder to see with telescopes, but astronomers still have a lot of data from when it was much brighter to go through, Salazar Manzano said. Teams around the world are working on creating a holistic picture of the comet’s chemistry and evolution.

What’s more, “the fact that we were able to make this measurement with 3I will allow us to better prepare what to expect with the next generation of interstellar objects,” Salazar Manzano said.

Scientists expect that the Vera C. Rubin Observatory could discover between 6 and 51 interstellar objects within the next 10 years. If objects are detected early enough in their journey through the solar system, “there may be enough time to coordinate observations with ground-based and spaceborne telescopes, taking advantage of the recent experience gained by the multiple 3I/ATLAS observations,” Hartogh said.

“These are rare opportunities to study another planetary nursery up close, and we have to take advantage of each new ISO to learn as much as we can,” Meech said. “It may be harder for a large number of individual teams to get all the data they want, so I think coordination and collaboration is needed more than ever.”

—Kimberly M. S. Cartier (@astrokimcartier.bsky.social), Staff Writer

Citation: Cartier, K. M. S. (2026), Interstellar comet was born in a very cold place, Eos, 107, https://doi.org/10.1029/2026EO260141. Published on 7 May 2026.
Text © 2026. AGU. CC BY-NC-ND 3.0
Except where otherwise noted, images are subject to copyright. Any reuse without express permission from the copyright owner is prohibited.
  •  

超级闪电之外-隐形超级风暴揭示木星上的闪电

木星带有条纹和漩涡状图案的表面覆盖着一条从上到下延伸的黄色线条,与一系列蓝色圆点相交。旁边的小图展示了木星的更近距离特写。
Source: AGU Advances

This is an authorized translation of an Eos article. 本文是Eos文章的授权翻译。

木星的闪电一直是行星科学家关注的焦点,因为它标志着风暴活跃的区域,研究人员可以在这些区域深入研究以进一步了解木星大气中的对流现象。

远距离观测闪电并非易事,因此科学家们将研究重点放在最容易观测的闪电上:夜间发生的强闪电。因此,一些研究得出结论,木星上的闪电都与地球上最强的闪电——“超级闪电”——类似。然而,这一结论最近受到了质疑,因为NASA朱诺号探测器上的高灵敏度星体追踪相机探测到了微弱的浅层闪电

Wong等人进行了更深入的研究,重点观察了2021年和2022年木星北赤道带的闪电高度集中在一些强大的孤立风暴中的情形,研究人员将这些风暴称为“隐形超级风暴”。这种不寻常的气象条件使研究人员能够更精确地确定闪电的位置。

科学家们并没有仅仅关注可见光,而是利用了朱诺号探测器携带的微波辐射计Waves实验的数据。朱诺号在过去十年中一直在环绕木星运行。无线电波只是闪电产生的电磁辐射的一种形式,但它却是一种特别有价值的信息来源,因为即使云层或其他大气成分阻挡了视觉信号,科学家们仍然可以对其进行研究。这种方法使研究人员能够超越其他研究人员以往关注的那些强烈的夜间闪电,去探索其他类型的闪电。

研究人员报告称,在这些隐形超级风暴中,闪电无线电脉冲的出现频率为每秒三次,这与之前一些夜侧成像研究中的闪电频率相似。然而,这些闪电的强度仍然存在争议。一些闪电的强度可能与地球大气层中发现的平均闪电强度相似。但由于所分析的木星闪电信号和地球闪电信号的无线电频率存在巨大差异,有些闪电的强度也可能是地球闪电的上百万倍。

—科学撰稿人Saima May Sidik (@saimamay.bsky.social)

This translation was made by Wiley. 本文翻译由Wiley提供。

Read this article on WeChat. 在微信上阅读本文。

A photo of a telescope array appears in a circle over a field of blue along with the Eos logo and the following text: Support Eos’s mission to broadly share science news and research. Below the text is a darker blue button that reads “donate today.”
Text © 2026. AGU. CC BY-NC-ND 3.0
Except where otherwise noted, images are subject to copyright. Any reuse without express permission from the copyright owner is prohibited.
  •  

Martian Aerosols Reveal Dynamics of Dust and Cloud Transport

Illustration of a satellite over the surface of Mars.
Editors’ Highlights are summaries of recent papers by AGU’s journal editors.
Source: Journal of Geophysical Research: Planets

Dust and water ice clouds are ubiquitous on Mars; they regulate the planet’s climate and can affect measurements of other atmospheric components. Constraining their spatial and temporal variability is also essential for improving Martian general circulation models.

Fedorova et al. [2026] use solar occultation measurements from the SPICAM infrared spectrometer on board the Mars Express orbiter to characterize nine Martian years (MY 28 through 36) of dust and water ice clouds. Because the spectrometer could not distinguish between these particles’ types, the researchers employ a new method integrating Mars Climate Sounder data and general climate model predictions to identify them.

The analysis reveals that the particles can reach altitudes up to 80 kilometers during perihelion, while their size remains relatively uniform with height. This suggests that Martian dust distribution is driven more by atmospheric dynamics and horizontal transport, capable of lifting and moving particles over vast distances, rather than by turbulent mixing against gravity alone.

The study also provides a detailed seasonal and spatial climatology of major Martian atmospheric features, including the Polar Hood Clouds, the Aphelion Cloud belt, and the Mesospheric Clouds. The detection of high-altitude clouds (70–90 km) during dust events confirms enhanced transport of water vapor into the upper atmosphere during both global and regional storms. These findings are consistent with simultaneous observations from the Atmospheric Chemistry Suite on the Trace Gas Orbiter.

These observations show that large-scale atmospheric dynamics, rather than local mixing alone, control how aerosols are distributed vertically on Mars, with important implications for the transport of water to the upper atmosphere and the planet’s climate evolution.

The figure shows how the water ice cloud layers vary with latitude and season (Ls), based on SPICAM observations. (a) altitude of the cloud layer in kilometers; (b) thickness of the cloud (optical depth); (c) average size of the ice particles in micrometers; and (d) number of particles within the layer (number density. The background color is the amount of dust in the atmosphere from Montabone et al. [2015]: red areas indicate high dust levels, while dark blue areas indicate low dust. Black open circles mark locations where no clear water ice clouds were detected. Credit: Fedorova et al. [2026], Figure 12

Citation: Fedorova, A. A., Luginin, M., Montmessin, F., Korablev, O. I., Bertaux, J.-L., Stcherbinine, A., & Lefèvre, F. (2026). Multiyear monitoring of aerosol vertical distribution on Mars by SPICAM IR/MEX. Journal of Geophysical Research: Planets, 131, e2025JE009388. https://doi.org/10.1029/2025JE009388  

—Arianna Piccialli, Associate Editor, and Beatriz Sanchez-Cano, Editor, JGR: Planets

Text © 2026. The authors. CC BY-NC-ND 3.0
Except where otherwise noted, images are subject to copyright. Any reuse without express permission from the copyright owner is prohibited.
  •  

A Unique African Volcano Could Solve a Mystery on Mercury

An image of the surface of Mercury shows a yellow surface and three craters ringed with dark blue. The middle crater has light blue spots in the center, and the other two are dotted with light blue around the edges.

The volcano Ol Doinyo Lengai in Tanzania is unique on Earth: Its lava is rich in carbon compounds that melt at significantly lower temperatures than typical silicon-rich lavas from other terrestrial volcanoes.

It is possible, however, that carbon volcanoes could exist elsewhere, including on exoplanets, or—as suggested in a recently published article in Icarus—perhaps even on planet Mercury.

Despite being known from antiquity, Mercury is very hard to study because of its closeness to the Sun. As a result, the best data so far were gathered within the past 20 years by NASA’s MESSENGER (Mercury Surface, Space Environment, Geochemistry, and Ranging) probe. In particular, scientists identified mysterious pits they dubbed “hollows” scattered across Mercury’s surface. The hollows’ relatively bright appearance indicates they were formed in recent geological times, and could even be still forming today. The origins and geochemical makeup of these hollows are unknown.

“Mercury looks like the Moon a little bit, so we don’t expect large volcanoes,” said Maximilian Paul Reitze, a planetologist at Universität Münster’s Institut für Planetologie who is first author of the Icarus study. Without volcanic conditions like those on Earth or even on Jupiter’s moon Io, researchers expect Mercury to be largely geologically dormant. In other words, to explain hollows, “we need some volcanism under the conditions we expect on Mercury,” Reitze said.

Hence the interest in Ol Doinyo Lengai, known as the Mountain of God to the Maasai and Sonjo peoples. This volcano produces lava made up of carbonatites, igneous rocks composed of more than half carbon (and which are known to host critical minerals). These lavas flow at temperatures roughly 100°C lower than Mercury’s blazingly hot daytime temperature of 424°C. If the planet has a carbon-rich subsurface, as Reitze and his collaborators proposed, then the hollows could be Mercury’s version of Ol Doinyo Lengai.

This theory, however, has its skeptics.

“We know that there is carbon in [Mercury’s] crust, but the amount is very low,” said Paul Byrne, a planetary scientist at Washington University in St. Louis, who was not involved in the Icarus study. He also pointed out that the surface regions where carbon is most concentrated don’t correspond to higher concentrations of hollows. “For this to be some kind of carbon-based lava, it would imply a lot more carbon than we might think, given how widespread the hollows are.”

The Making of a Weird Planet

Mercury’s proximity to the Sun means that NASA’s Mariner 10 spacecraft provided humanity’s first-ever views when it flew by in 1974 and 1975. Three decades later, the MESSENGER mission was the first probe to orbit Mercury, mapping the planet’s full surface and turning up unexpected features like the hollows. The BepiColombo mission, a joint project of the European Space Agency and the Japan Aerospace Exploration Agency, is only the third mission ever to visit the planet, so when its two spacecraft settle into orbit in November 2026, it will almost inevitably reveal something unexpected, because it’s a weird planet.

“Basically, Mercury is a molten ball bearing wrapped in a thin blanket of rock.”

Unlike Earth, Mars, or the Moon, Mercury has a freakishly large core and a thin mantle.

“Basically, Mercury is a molten ball bearing wrapped in a thin blanket of rock,” Byrne said. “One explanation is that early in the planet’s life, either one large or several smaller impacts stripped the outer portion away.”

The question then becomes what got vaporized, and what was left behind, particularly when trying to understand hollows. Many planetary researchers proposed that sulfides in the mantle could drive volcanism, but Reitze had doubts.

“The problem with sulfides I see is that they’re stable up to 1,000°C or so, which cannot explain the explosive volcanism that’s needed to form those hollows,” he said.

Instead, he and his coauthors contacted a colleague working on Ol Doinyo Lengai, who obtained a sample of the lava for laboratory study while it was still molten. Because carbonatite lava reacts chemically with Earth’s air very quickly, the researchers needed to isolate it to understand how the unaltered materials might behave under conditions on Mercury, particularly infrared spectra that could be confirmed by the BepiColombo mission.

Aerial view of a volcano, a large crater with a sharp peak at its center
Ol Doinyo Lengai, a volcano in Tanzania, is unique because of its carbonatite lava. Credit: Ben Shoshana/Wikimedia Commons, CC BY-SA 4.0

In the hypothesis proposed by Reitze and colleagues, impacts from meteorites heat the carbon-rich magma below Mercury’s surface, melting it and driving eruptions. The hollows, which are found frequently on the slopes of Mercury’s craters or their central peaks, are the remains of those eruptions. Over time, further meteorite bombardments and intense solar radiation destroyed older hollows, which is why the ones in MESSENGER data were all formed within the past 270 million years—a short time ago, geologically speaking.

“Anytime people have been confident about anything in planetary science, [planets have] shown you wrong.”

“The carbonatite angle is an interesting one, and I certainly wouldn’t rule it out,” Byrne said. “Anytime people have been confident about anything in planetary science, [planets have] shown you wrong. I’m certainly open to it, but is it the only explanation for all of the hollows? I am skeptical of that.”

Byrne and Reitze both dream of a future Mercury lander, a very challenging and expensive proposition nobody expects will happen soon. In the meantime, they agreed that BepiColombo data will help settle the question of whether the most Mercury-like place on Earth is a volcano in Tanzania.

—Matthew R. Francis (@BowlerHatScience.org), Science Writer

Citation: Francis, M. R. (2026), A unique African volcano could solve a mystery on Mercury, Eos, 107, https://doi.org/10.1029/2026EO260176. Published on 2 June 2026.
Text © 2026. The authors. CC BY-NC-ND 3.0
Except where otherwise noted, images are subject to copyright. Any reuse without express permission from the copyright owner is prohibited.
  •  

Astronomers Find 10,000 Potential New Exoplanets

An artist’s illustration of an array of exoplanets with a 9 by 12 grid of colorful planets in a gibbous phase. A second grid of shadowed planets sits behind it.

Research & Developments is a blog for brief updates that provide context for the flurry of news that impacts science and scientists today.

To date, astronomers have confirmed the existence of just under 6,300 exoplanets. New research could more than double that number, adding a potential 10,000 new planets in one fell swoop.

Yes, that’s right. A 1 with 4 zeros.

The T16 project has announced the discovery of 10,091 exoplanet candidates observed by NASA’s Transiting Exoplanet Survey Satellite (TESS). Since 2018, the all-sky survey has been monitoring more than 200,000 nearby stars using the transit method, which detects the faint dip in a star’s light when a planet crosses in front of it. Astronomers typically require 3 dips to be sure that what they’re seeing is actually a planet and not a one-off event such as an asteroid or comet in that distant star system.

The T16 project analyzed the light curves of more than 54 million stars observed during the first year of the TESS mission. The project’s analysis technique allowed it to search for planets around stars up to 16 times fainter than TESS typically searches, drastically increasing the field of discovery.

That’s more than were detected in the entirety of NASA’s Kepler mission and its follow-on K2.

Their pipeline detected 11,554 planet candidates. Of those, 1,052 of those had been detected previously and 411 only had one transit—not enough to confirm a planet.

That leaves 10,091 potential new planets. That’s more than were detected in the entirety of NASA’s Kepler mission and its follow-on K2 and more than double the existing planet candidates from TESS that await confirmation. These discoveries will be published in the Astrophysical Journal Supplement.

All of the new planet candidates orbit their stars quickly, with orbital periods between 12 hours and 27 days. Although most of the stars that TESS observes are smaller and cooler than the Sun, those close orbits likely mean that most of those planets are far too hot to be habitable.

 
Learn More

•  Read the paper: The T16 Planet Hunt
•  More context from The Bad Astronomer
 

The T16 project team confirmed the planet-hood of one of their candidates not using the transit method, but a different method that measures the gravitational tug a planet exerts on its host star. That planet, TIC 183374187, is hot and slightly larger than Jupiter.

The remaining 10,090 newly discovered planet candidates require additional verification to determine whether they truly are planets or not. But given the rigor of the team’s analysis and the requirement of at least 3 transits to even make this list, it’s likely that most of the new discoveries are indeed planets.

“Astronomers are a bit conservative when it comes to claims like this, and want to be sure they pass a bunch of tests to make sure everything was done correctly and these planets actually exist,” astronomer Phil Plait wrote in his Bad Astronomy Newsletter. “Having said that, the process the astronomers went through looks legit to me, and I would bet the majority of these new candidates are real. That’s amazing.”

—Kimberly M. S. Cartier (@astrokimcartier.bsky.social), Staff Writer

These updates are made possible through information from the scientific community. Do you have a story about science or scientists? Send us a tip at eos@agu.org.

A photo of a hand holding a copy of an issue of Eos appears in a circle over a field of blue along with the Eos logo and the following text: Support Eos’s mission to broadly share science news and research. Below the text is a darker blue button that reads “donate today.”
Text © 2026. AGU. CC BY-NC-ND 3.0
Except where otherwise noted, images are subject to copyright. Any reuse without express permission from the copyright owner is prohibited.
  •  

Timing of Geomagnetic Storms Shapes Their Impact

Illustration of the Sun and Earth's magnetosphere.
Editors’ Highlights are summaries of recent papers by AGU’s journal editors.
Source: AGU Advances

Solar eruptions can trigger geomagnetic storms that disrupt satellites, GPS, and power grids, affecting daily activities and technology. Therefore, it is extremely important to understand these storms in order to mitigate their impact. Previous studies mainly focused on interplanetary conditions.

Ghag et al. [2026] investigate the interaction between solar ultraviolet light (EUV) during storms and the Earth magnetic field, taking into account its misalignment and offset with respect to the Earth’s rotational axis, which depend on time. Such misalignment and offset induce variations in EUV exposure in turn influencing the ionosphere and its interaction with the magnetosphere.

The study applies the Multiscale Atmosphere-Geospace Environment (MAGE), a physics based fully coupled whole geospace model. The causal relationship between storm timing and storm effect is explored revealing insights on our capability to predict storm impact based on the time dependent Earth system state.

The rotation of the magnetic pole around the rotational pole in the NH and SH. The location of the rotational pole is denoted in blue and the magnetic pole in red. Credit: Ghag et al. [2026], Figure 6c

Citation: Ghag, K., Lotko, W., Pham, K., Lin, D., Merkin, V., Raghav, A., & Wiltberger, M. (2026). Universal time influence on stormtime magnetosphere ionosphere coupling. AGU Advances, 7, e2025AV002071. https://doi.org/10.1029/2025AV002071

—Alberto Montanari, Editor-in-Chief, AGU Advances

Text © 2026. The authors. CC BY-NC-ND 3.0
Except where otherwise noted, images are subject to copyright. Any reuse without express permission from the copyright owner is prohibited.
  •  
❌