Pontiac GTO 1970
vdgoltz posted a photo:

Auf einem Oldtimertreffen fotografiert
photographed on a vintage car meeting

vdgoltz posted a photo:
Auf einem Oldtimertreffen fotografiert
photographed on a vintage car meeting
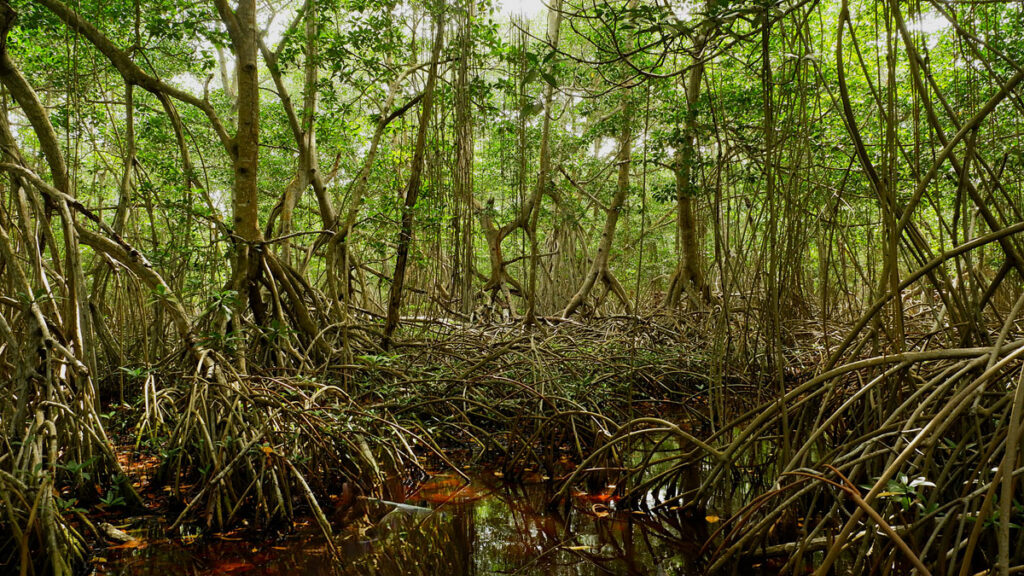
Mangrove forests straddle the edge of land and sea along some tropical and subtropical coastlines. These trees and shrubs have distinctive tangles of roots that trap sediment and produce organic matter, forming dense soils and efficiently storing carbon. Though mangroves cover only 1% of Earth’s surface, they store a whopping 15% of global ocean carbon in their trapped soils.
Their location along coastlines means mangroves are at the mercy of changing sea levels and sediment availability. Rising sea levels can drown mangroves or push them landward. At the same time, sediment supplies, belowground root growth, and organic matter accumulation can help build up mangrove soils, allowing forests to keep pace with sea level rise. So over time, will mangroves keep locking carbon into their soils, or will they start losing it?
Iwantoro et al. created a new model that examines the links between coastal processes to investigate vegetation growth and carbon accumulation in mangrove forests.
The researchers modeled a simplified tidal embayment to explore how different rates of sea level rise and sediment supplies would affect the mangroves. In these experiments, they found that carbon accumulation can increase at specific locations as waters rise because the increased water can lead to more mangrove growth—a result that matches existing data. However, when looking at landscape scales, they found sea level rise generally reduces total carbon sequestration through mangrove loss and soil erosion. The results showed that rising sea levels can alter mangroves from carbon storage sinks to carbon emitters.
The findings demonstrate that local trends in carbon sequestration may not be representative of larger-scale outcomes in mangrove forests. The study shows that understanding coastal landscapes as an interconnected system is crucial to understanding how mangroves can respond to climate and human-induced pressures, the researchers say. However, new assessments and approaches are needed to better understand future mangrove vulnerabilities. (Earth’s Future, https://doi.org/10.1029/2025EF006984, 2026)
—Sarah Derouin (@sarahderouin.com), Science Writer

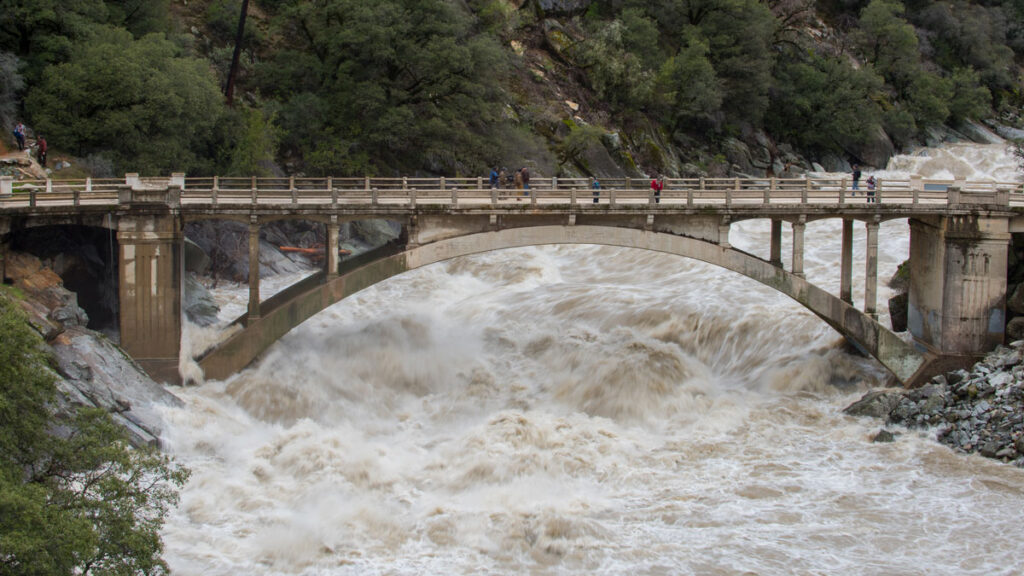
Real-time hydrologic forecasting predicts river level and flooding inundation by combining continuously updated rainfall measurements, river gauge readings, and weather forecasts. Most of these flood forecasting systems depend on human interpretation and adjustments, or a “forecasters-in-the-loop” approach, which pairs computer models with a human expert on flood dynamics and local conditions. In contrast, in a “forecasters-over-the-loop” system, humans supervise automated forecasts and intervene only if necessary.
Recently, artificial intelligence (AI) and machine learning (ML) have become more integrated into flood prediction, and many of these systems are faster at processing large datasets and learning complex patterns from historical records than traditional models alone. But these new technologies also come with limitations—AI and ML require extensive data and may struggle to capture extreme, rare events.
Even though ML and AI are often touted as the future of flood forecasting, most studies have tested this technology against models that provide historical simulations, not the real-time operational systems that would be used during a flood. These simplified models may lack local details or are tested at daily rather than hourly resolution. Their effectiveness may be overestimated.
Tran et al. produced the first study comparing the performance of ML models to an actual flood forecasting system used at the California Nevada River Forecast Center (CNRFC) that uses professional forecasters and traditional hydrologic models. The study suggests that a forecasters-in-the-loop approach outperforms the ML models in several key ways, including streamflow predictions and flood event detection, because forecasters can recognize model errors and account for poor input data—actions models cannot take on their own.
The researchers used data gathered from CNRFC river stage forecasts across 50 California and Nevada locations between 2012 and 2022 and river condition lead times from 1 to 96 hours. Compared to the ML models, the Community Hydrologic Prediction System used at CNRFC generally performed better at predicting stream flow and flood peaks, especially with longer lead times. Though the ML models could perform better at very short lead times, their accuracy declined quickly. Though automated forecasting options may seem promising, they are not yet a suitable replacement for human expertise when it comes to protecting lives and livelihoods from damaging floods, the researchers say. (Geophysical Research Letters, https://doi.org/10.1029/2025GL118317, 2026)
—Rebecca Owen (@beccapox.bsky.social), Science Writer

This is an authorized translation of an Eos article. 本文是Eos文章的授权翻译。
如果人类想要在太空生活,无论是在航天器里还是在火星上,首先要解决的一个问题就是如何获取水,来满足饮用、卫生需求以及为维持生命所需的植物提供水分。即便只是将水运送到近地轨道上的国际空间站(ISS),也需要花费数万美元。因此,找到在太空中高效、持久且可靠地获取和再利用水资源的方法,对于长期在太空居住至关重要。
目前的系统,比如国际空间站上的环境控制与生命支持系统(ECLSS),为闭合式水回收提供了蓝图,但它们还需要改进才能适应未来的应用。与此同时,近期的技术和科学进步正为在严苛环境下寻找、净化和管理水资源开辟新的途径。在一篇新的综述中,Olawade等人概述了地外水资源管理的现状,以及该领域的前景和挑战。
作者指出,太空水系统需要具备闭环、高效和持久耐用的特性,同时还要满足低能耗的要求。目前,ECLSS能耗过高,其效率可能也不足以满足长期任务的需求。未来建议采用的过滤和回收方法包括:利用光催化技术通过光线净化水,利用生物反应器过滤尿液和废水,利用离子交换系统去除提取水中的溶解盐和重金属,以及利用紫外线或臭氧消毒杀灭病原体。每种方法各有优缺点:例如,生物反应器中的微生物燃料电池可以发电,而光催化净化则能耗较低。
在月球或火星这样的地方获取水,要么需要从风化层中提取水,要么需要钻探冰体。如何为水回收系统提供足够的能源也是一个问题,因此开发节能系统是需要优先考虑的事项。水系统的耐久性也很重要,既要保护宇航员的安全,又要能减少繁重的维护工作。
新兴技术有望应对其中许多挑战。作者们指出两个具有巨大应用前景的领域,一是纳米技术的发展,它可用于制造定制化程度更高、过滤效果更佳且耐污染的膜材料,二是人工智能(AI)技术在水系统自主管理中的应用。(Water Resources Research, https://doi.org/10.1029/2025WR041273, 2026)
—科学撰稿人Nathaniel Scharping (@nathanielscharp)
This translation was made by Wiley. 本文翻译由Wiley提供。
Read this article on WeChat. 在微信上阅读本文。
Evapotranspiration is a critical link between water, energy, and carbon. Scientists need to understand it well to accurately predict weather, droughts, streamflows, and even carbon emissions.
Eddy covariance towers, which measure changes in the atmosphere, are one of the primary ways that scientists measure evapotranspiration in an ecosystem. But these measurements often have a problem with energy imbalance, in which the measured fluxes of sensible heat and latent heat add up to less than they should. (Sensible heat refers to measurable temperature changes occurring via conduction or convection, whereas latent heat refers to water in the atmosphere changing phases.) There’s something missing—up to 30% of the system’s energy—in the math, and that can cause problems for later uses of the measurements, from forecasts to climate policies.
Scientists can adjust evapotranspiration measurements to try to correct for this problem, but a commonly used method to do so assumes that the Bowen ratio, or the ratio between sensible and latent heat, remains constant. However, this assumption may be flawed.
Raghav and Kumar present a new way of tackling this old problem without making assumptions about the Bowen ratio. It’s based on water use efficiency, which is how effectively plants use water to produce biomass.
The method first uses a suite of data from an eddy covariance tower to estimate evapotranspiration and energy balance through time. Then it derives the underlying water use efficiency potential while accounting for the influence of atmospheric dryness. In general, for a given vegetation type, this potential underlying efficiency is considered to be relatively stable over a growing season. The statistically smoothed potential underlying water use efficiencies is then compared to reference values derived during periods when the energy balance is well constrained. The ratio of the two is then used to correct evapotranspiration.
The new method is more consistent and more tied to the physics of plant physiology than current methods when results from each are compared, the authors found.
The new method is appropriate for use with any eddy covariance tower location or dataset because the authors used data from more than 250 towers around the world, in a range of ecosystem and climate types, to build their approach. However, they add, it may be less reliable in environments where evaporation dominates transpiration, such as wetlands. Nevertheless, the authors say, this work marks an important advance in measuring evapotranspiration, with broad implications for water management, agriculture, and adapting to climate extremes and drought. (Water Resources Research, https://doi.org/10.1029/2025WR042766, 2026)
—Rebecca Dzombak (@rdzombak.bsky.social), Science Writer

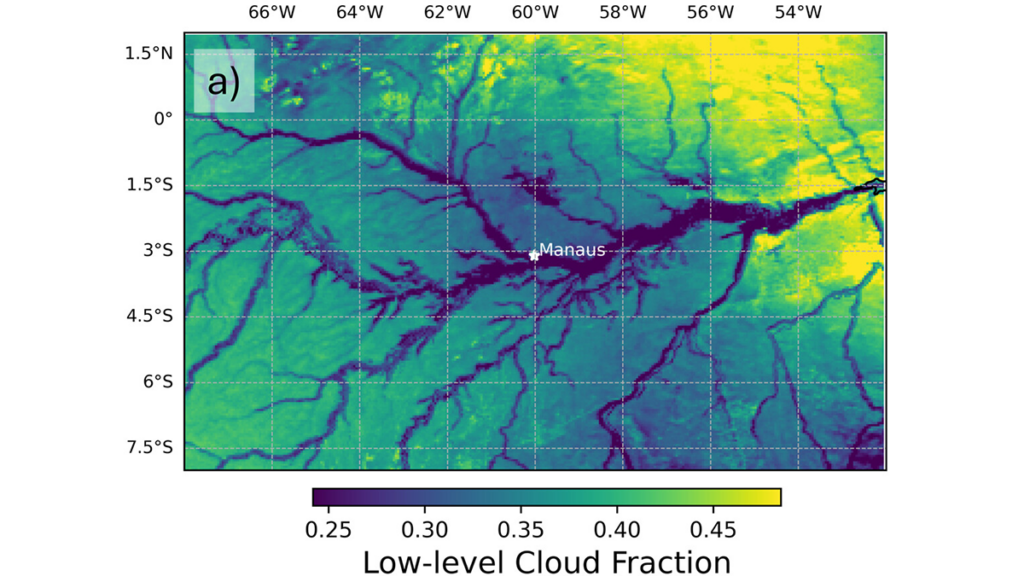
Aerosols are tiny particles suspended in the air. They can cool the climate by making clouds brighter and longer-lasting. Scientists rely on satellite observations to measure the aerosol-cloud interaction, but distinguishing human impacts from natural weather patterns remains a challenge.
Christensen et al. [2026] reveal that the Amazon River itself creates cloud patterns that mimic the signatures of pollution. Using 15 years of satellite data, researchers found that the temperature difference between the cool river and the warm land drives a local “river breeze” circulation. This natural process creates clouds with smaller and more numerous water droplets, which exhibit very similar features that satellites look for to identify pollution. Consequently, clean clouds over the river can appear polluted in satellite datasets. These findings highlight the critical need to account for local geography and natural weather patterns to accurately assess how human activities are influencing Earth’s climate.
Citation: Christensen, M. W., Varble, A. C., Tai, S.-L., Wind, G., Meyer, K., Holz, R., et al. (2026). The Amazon River-breeze circulation limits detection of aerosol-cloud interactions in warm clouds. AGU Advances, 7, e2025AV002188. https://doi.org/10.1029/2025AV002188
—Xi Zhang, Editor, AGU Advances
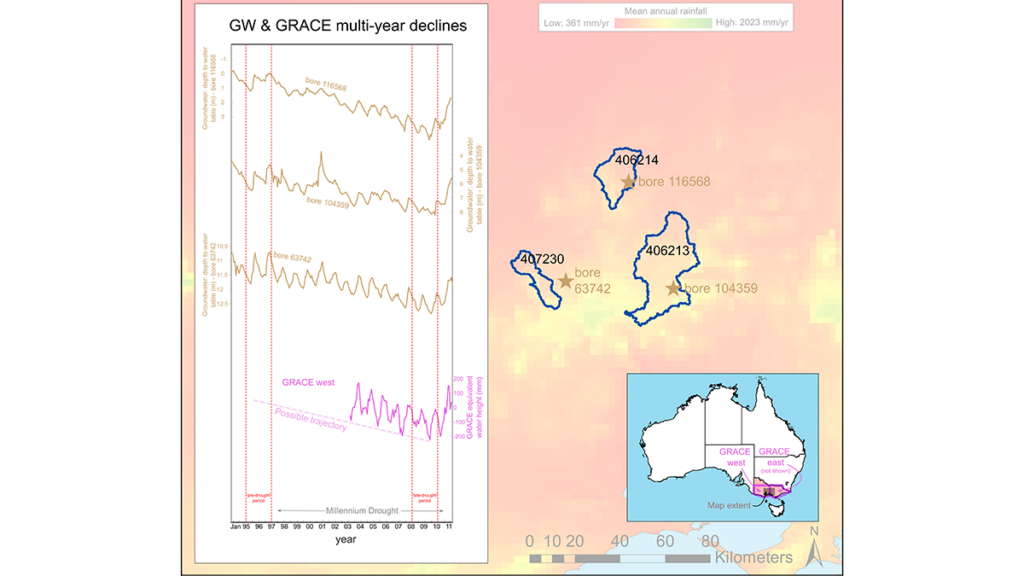
In the March 2026 issue of Water Resources Research, Zhang et al. [2026] interrogate conceptual hydrologic models’ ability to capture prolonged drought dynamics. The Australian Millennium drought serves as an example in the study. The results are quite sobering because the vast majority of more than 40 models fail. Unfortunately, calibration doesn’t generally help either and might result in massive overfitting. In essence, conceptual models miss deep aquifer storage components and associated hydrodynamic processes leading to a lack of time scales important in drought modeling. The study is a constructive reminder that model parsimony is not necessarily a good thing and that detailed representation of complex physical processes is part of hydrologic sciences.
Citation: Zhang, Z., Fowler, K., & Peel, M. (2026). Can conceptual rainfall-runoff models capture multi-annual storage dynamics? Water Resources Research, 62, e2025WR042226. https://doi.org/10.1029/2025WR042226
—Stefan Kollet, Editor, Water Resources Research
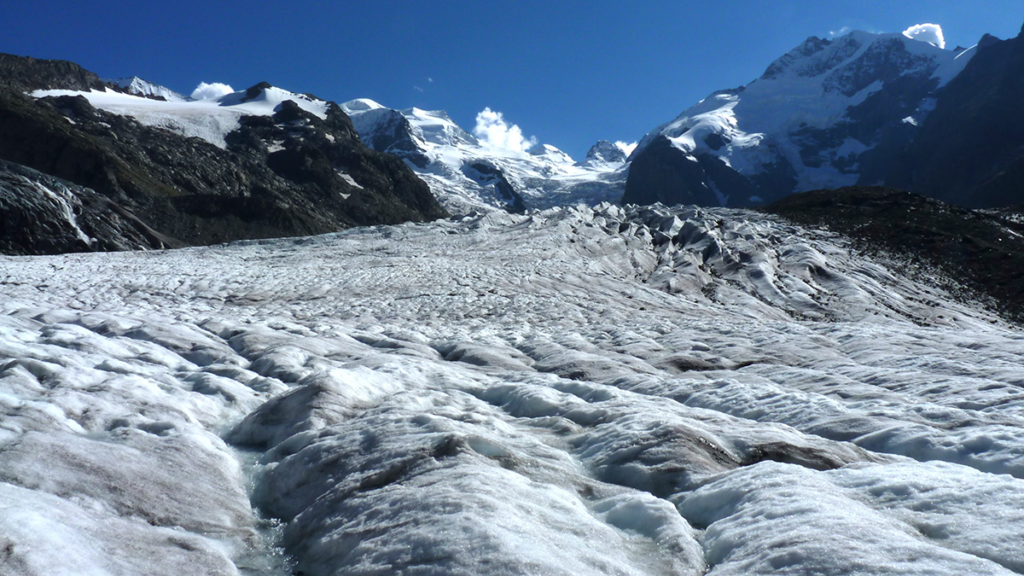
Glacier ice is a crystalline material that flows across the Earth’s surface and is often close to the pressure-melting point. The way ice deforms is therefore an interplay of many factors including the temperature, grain size, and purity of the ice. Numerical models of ice flow are based on the Glen-Nye flow law (Glen’s Law)—a simple relationship between stress and strain in ice developed by John Glen and John Nye from laboratory experiments in the 1950s. Glen’s Law derives strain (creep, or deformation flow of ice) from the applied stress raised to the power of the exponent n, multiplied by the temperature-dependent constant A. The values for these parameters are empirical, and both linear and power-law forms of Glen’s Law have been proposed, although a value of 3 is typically used for n.
Lilien et al. [2026] use a flowline model to explore the impact of the choice of value for Glen’s n on the outcome of projections of ice sheet mass change, considering different values for A and different glacier sliding laws. They found that the relationship between n and glacier mass loss is complicated and varies depending on glacier type. For dynamically controlled glaciers, increasing n increased mass loss, as ice flowed more rapidly into ablation areas. For surface mass balance-controlled glaciers, increasing n decreased mass loss, because ice flux decreased at the equilibrium line. The authors find that using a single value for Glen’s n is likely to lead to large uncertainties in projections of ice sheet change, and therefore studies of future ice sheet mass loss need to consider how the flow-law exponent varies spatially.
Citation: Lilien, D. A., Ranganathan, M., & Shapero, D. R. (2026). Effect of the flow-law exponent on ice-stream sensitivity to melt. Journal of Geophysical Research: Earth Surface,131, e2025JF008726. https://doi.org/10.1029/2025JF008726
—Ann Rowan, Editor-in-Chief, JGR: Earth Surface
Turbidity currents are underwater currents that transport sediment on the sea floor. They were first observed in the late 1800s in Lake Geneva, Switzerland. The cable break following the 1929 Grand Banks earthquake offshore Canada revealed how massive and destructive these fluxes can be.
Turbidity currents move downslope because they have a higher density than the surrounding water due to the presence of sediment in suspension. It is critical to keep in mind that suspended sediment concentration in these flows is low, meaning that the fluid is Newtonian and the flow is turbulent.
Notwithstanding recent advances in field monitoring, measuring turbidity current thickness, velocity, suspended sediment concentration, and grain size distribution remains difficult not only for the high-water depths and the destructive nature of some events, but also because these flows are often infrequent. Laboratory experiments and mathematical modeling have been used extensively to understand nature and some aspects of these flows, but questions remain on, for example, how turbidity currents interact with ocean waves, if they do.
Daniller-Verghese et al. [2026] performed laboratory experiments to determine if and how turbidity currents interact with ocean gravity waves. Experimental flows were released in an 11-meter-long, 1.2-meter-deep, and 0.61-meter-wide flume in the Experimental Sedimentation Laboratory of the Jackson School of Geoscience at the University of Texas. A motored wave maker was installed at the downstream end of the facility to generate the wave field. During the experiments, detailed velocity measurements were conducted to characterize the flow field and the fine details of the turbulent fluctuations. At the end of each experiment, high-resolution measurements of changes in bed elevations allowed the quantification of the net depositional fluxes.
The results show that, in presence of a superimposed wave field, the center of deposition volume shifted downstream compared to experiments conducted with the same inflow but in absence of waves. In addition, velocity measurements indicate that the wave signal is stronger in presence of turbidity currents compared to the “clear water” case. In other words, current velocity was larger when waves were present, enhancing downslope sediment transport and causing the observed downstream shift of the center of deposition.
Although the physical mechanism responsible for the observed increase of sediment transport rates in presence of a superimposed wave field still needs to be resolved, these results provide novel insight for the interpretation of storm and turbidity current deposits in the rock record. They also highlight the importance of considering wave-turbidity current interactions to constrain sediment budgets on continental shelves, which are essential to preserve and manage coastlines worldwide.
Citation: Daniller-Varghese, M., Smith, E., Mohrig, D., & Myrow, P. (2026). Wave-signal entrainment into combined flows: Consequences for sediment transport, signal dislocation, and turbulence. Journal of Geophysical Research: Earth Surface, 131, e2025JF008497. https://doi.org/10.1029/2025JF008497
—Enrica Viparelli, Associate Editor, JGR: Earth Surface

