A new study (Vega et al. 2026) shows that patterns of reported structural damage in Medellin are probably caused by deep-seated deformation driven by a series of ancient landslides under the city.
Medellin is the second largest metropolitan area in Colombia, with a population of around 4 million people. It has grown rapidly, expanding into the surrounding hillsides, with many unplanned and informal communities on steep slopes. Landslides are a common problem.
The rapid rate of growth has been accompanied with many reports of structural failures in buildings, with a general (and not unreasonable) assumption that these are associated with poor construction quality. But a fascinating new study (Vega et al. 2026) in the journal Landslides challenges this assumption in a most interesting way. The headline from the study is that there is a strong correlation between areas that have a high density of reports of structural damage and ground deformation driven by large, deep-seated landslides.
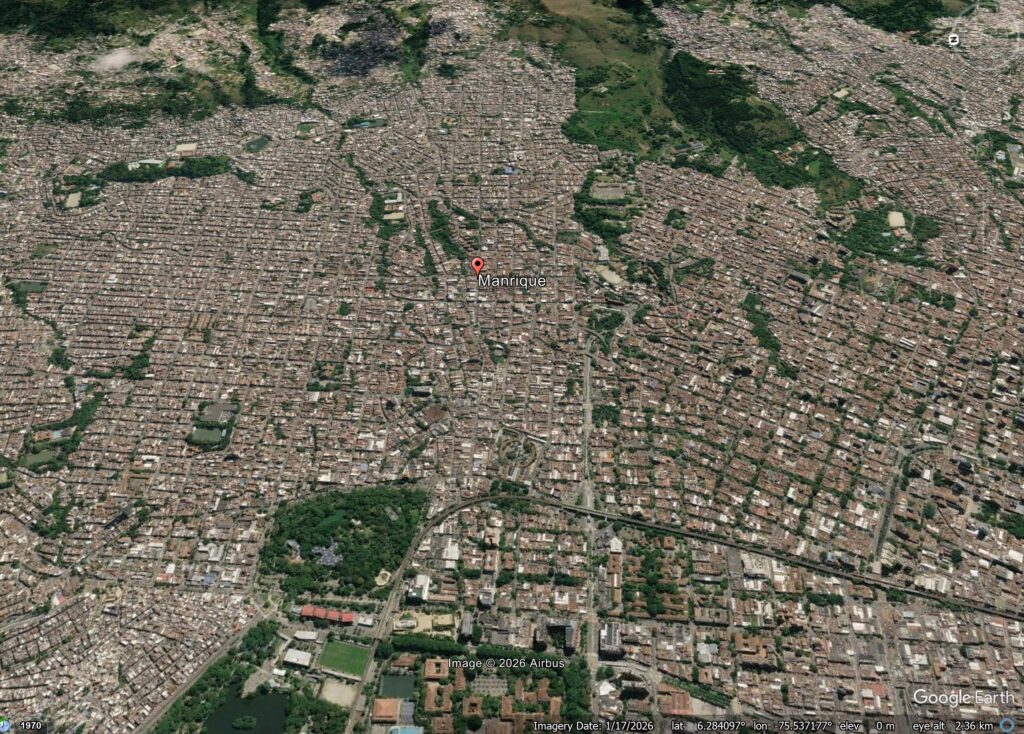
Vega et al. (2026) have used InSAR to map ongoing displacements across Medellin. In three key areas (Doce de Octubre, Manrique and Villa Hermosa) they detected high rates of ground deformation. They were able to show that these areas correspond to mappable deep-seated landslides. An example is in the Manrique neighbourhood of Medellin:-
Google Earth image of the Manrique neighbourhood of Medellin in Colombia.
Interpretation of pre-urbanisation imagery suggests that the topography underlying Manrique includes a series of deep-seated landslides. The InSAR data indicate that these areas are actively deforming, and these deformation zones correspond to areas with a high density of reports of structural damage. Interestingly, the density of damage reports does not correlate with the style of construction of the buildings.
Vega et al. (2026) also note that many of the recent acute landslide events in recent years also lie within these areas of high underlying ground deformation. Fore example, the 24 June 2025 landslide that killed 27 people lies within an area highlighted by the InSAR analysis.
This study highlights two key things for me. First, it is a novel and interesting application of InSAR in an urban setting, allowing the underlying processes that are driving structural damage in the city to be understood. Second, the study highlights the underlying vulnerability of Medellin to deep-seated slope processes. As the climate continues to change, and human processes modify the landscape and the groundwater, management of these slopes would seem to be a high priority.
Forecasts for the 2026 South Asia monsoon are for below average rainfall, but some of the most landslide prone areas of India may receive totals that are above average.
The global pattern is dominated by the South Asia (southwest / summer) monsoon, so it is interesting at this point to to consider the prospects for this year. The monsoon itself is expected to start in SW India next week, timing that is normal. It will then build over the following month or so.
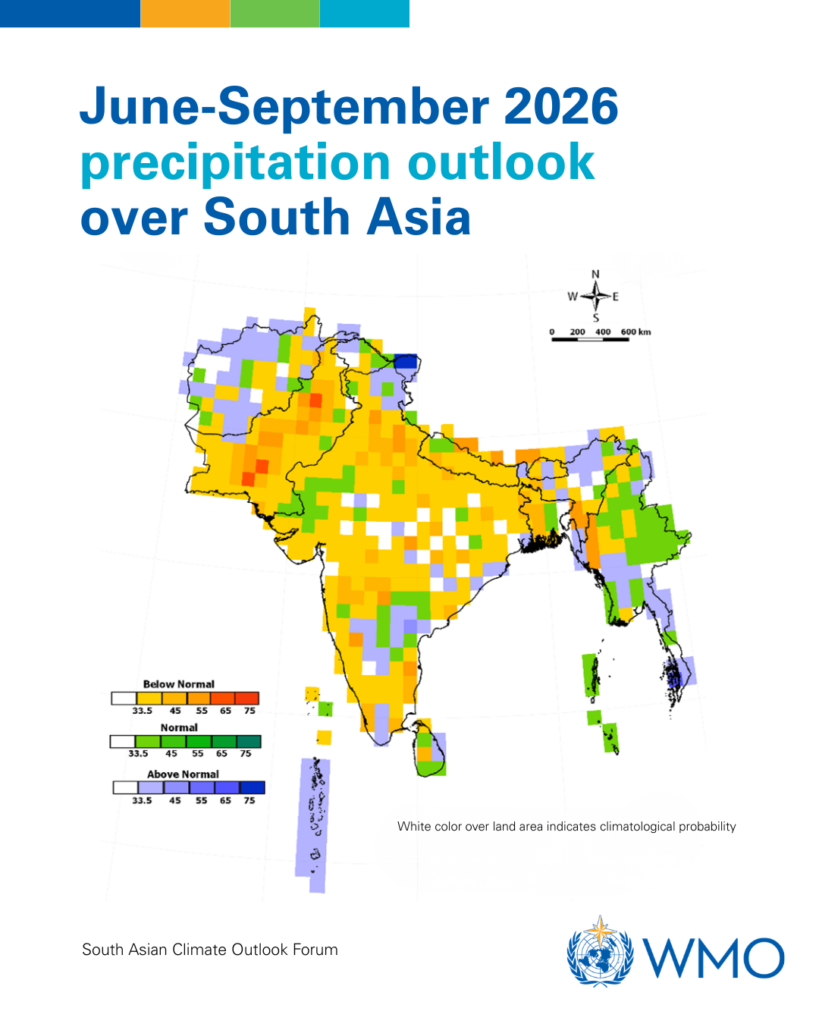
The current forecast for the monsoon itself is that the total rainfall is likely to be below average. This is the WMO forecast:-
The WMO 2026 South Asia monsoon forecast from the WMO.
Of course, in landslide terms we are interested mainly in SW India (Kerala), which has a below average forecast, and the mountainous areas of Pakistan, India, Nepal, Bhutan and Bangladesh. Much of this is also forecast to receive below average precipitation, but note the above average forecast for parts of northern India (Jammu and Kashmir, Himachal Pradesh) and NE India (Sikkim, Arunachal Pradesh). These are some of the most landslide-prone areas of India, suggesting that we may well see substantial landslide challenges in these areas.
The caveat of course is that monsoon-triggered landslides are sensitive to rainfall intensity as well as rainfall magnitude. A below average monsoon can bring intense rainfall events that trigged catastrophic landslides. Unfortunately, the forecasts cannot resolve this issue.
As an aside, the next few days in the European Alps will be interesting. We are about to see a few days of unusually high temperatures, which are likely to drive a wave of snowmelt and permafrost thawing. Given the time of year, this could well trigger extensive rockfall activity.
Unfortunately, by the time I get to Switzerland in nine days the weather is forecast to have reverted to cool drizzle!
As glaciers retreat in warming regions, the risk of related hazards can increase, and improved monitoring may help reduce some of those dangers, according to a new study.
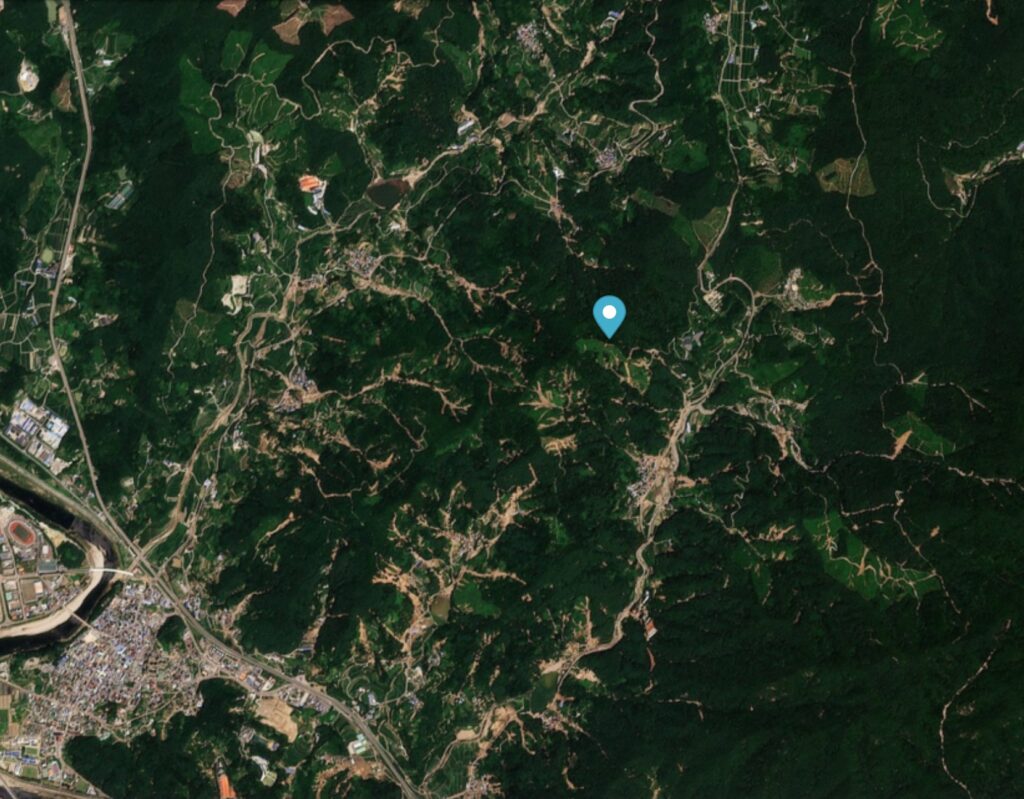
The core of the affected area is at [35.4333, 127.9111] (as usual, Landslides provides the location in degrees minutes and seconds when digital degrees is so much more useful – a pet frustration of mine!). This is a Planet Labs image of a part of the area, captured before the event. The marker is at the coordinate noted above:-
Planet Labs image of a part of the area affected by landslides during heavy rainfall in Sancheong County, South Korea on 19 July 2025. Image copyright Planet Labs, used with permission. Image dated 10 July 2025.
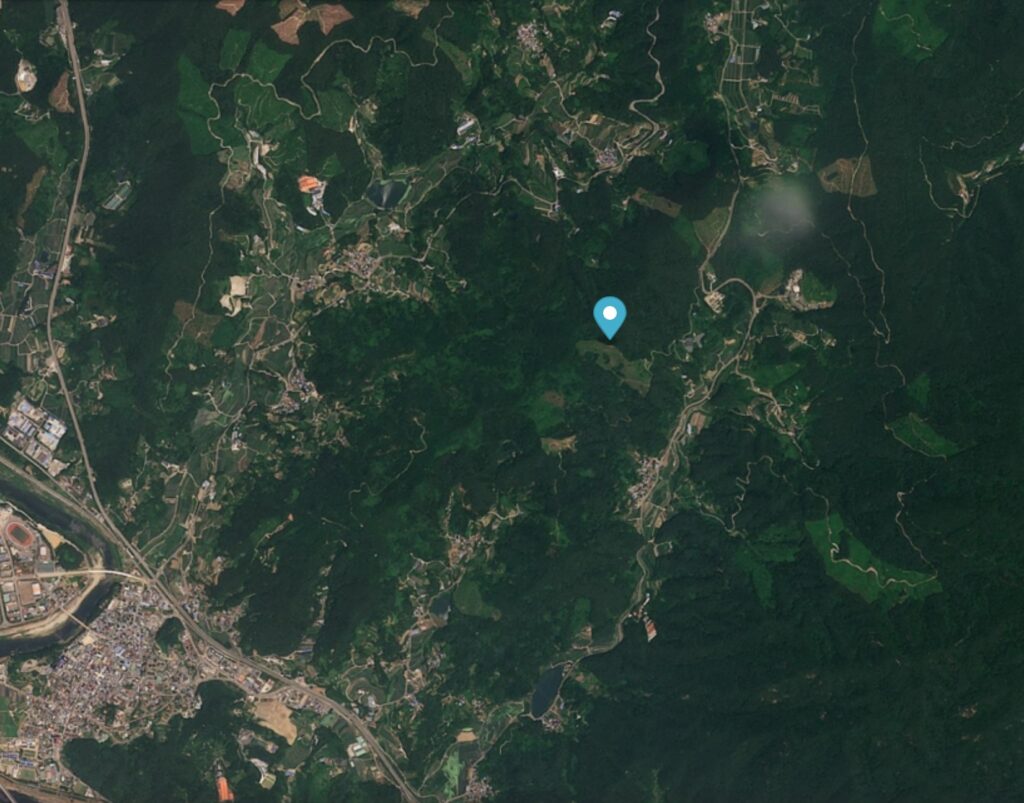
And this is the same area after 19 July 2025:-
Planet Labs image of a part of the area affected by landslides during heavy rainfall in Sancheong County, South Korea on 19 July 2025. Image copyright Planet Labs, used with permission. Image dated 23 July 2025.
Nguyen et al. (2026) have mapped 568 individual landslides triggered by this rainfall event, triggered by rainfall in the range of 498 – 619 mm over a c. 55 hour period. These landslides killed at least 10 people and caused damage to homes and infrastructure. It is estimated that the restoration costs are in the order of US$800 million.
In common with many other events of this type, the landslides are mainly shallow, translational failures in soil or regolith on steeper slopes. As I have frequently noted, such terrain is very susceptible to unusually intense rainfall events, which often trigger a cluster of landslides in close proximity. These often merge to form channelised debris flows. Nguyen et al. (2026) note however that their modelling indicates that it was a combination of the intensity of the rainfall and its duration that led to these failures.
As rainfall intensities increase due to climate change, we are seeing increasing numbers of these landslide clusters. I greatly welcome studies such as Nguyen et al. (2026) , which allow us to build understanding in each case.
Wildfires can increase flooding risks in and downstream of burned areas by removing vegetation and disturbing hydrologic processes. As the climate changes, the severity of both wildfires and heavy rainfall events is increasing, meaning flooding is likely to become more severe in the near future. Better understanding how, and by how much, wildfires change flood risk is important for disaster and infrastructure planning for communities around the country.
To make the most of the limited data on flooding in the years following wildfires, the researchers created a paired-storms framework: They identified postfire peak flows (PFPFs), defined as the five highest peak flows within 3 years of a wildfire across seven watersheds. Then, for each precipitation event causing a PFPF, they looked for storms with similar characteristics (or paired storms) that occurred before the wildfire. Storm characteristics used for pairing included the season in which the storm occurred, recent precipitation, and precipitation depth, duration, and peak intensity.
The researchers found significantly elevated peak flows after wildfires in many cases, underlining the risks to communities following wildfires and validating their approach for use elsewhere.
Altogether, the authors found 26 PFPF events, including 20 with paired storms occurring before wildfires. For 75% of the postfire storms, their peak flows were 2 or more times greater than prefire peak flows. PFPFs were most likely to happen in the first year after a wildfire and typically occurred following storms that were centered upstream of the watershed centroid, were uniform in shape, and fully covered the watershed and burned area, the authors reported. They also found some evidence that the first storm in the year immediately following a fire has a higher-than-expected chance of producing a PFPF.
Future work could look more deeply at the characteristics of storms occurring over burned areas, such as storm direction and watershed recovery, and could apply the automated methods to more burned watersheds and storm events to enhance the robustness of the work, the authors say. (Water Resources Research, https://doi.org/10.1029/2025WR040693, 2026)
Critically endangered Tapanuli orangutan population falls after heavy rain and landslides, fuelled by climate crisis, in North Sumatra
Extreme rainfall and landslides fuelled by the climate crisis killed 7% of the remaining population of the world’s rarest great ape, a study has found, prompting fears for the species’ survival.
The research suggests 58 out of the remaining 800 critically endangered Tapanuli orangutans (Pongo tapanuliensis) were killed after more than 1,000mm (39in) of rain fell over four days in Indonesia’s North Sumatra province in November 2025. This equates to 11% of the local population and 7% of the entire species.
To date news reports suggest two fatal landslides with a combined toll of 17 people.
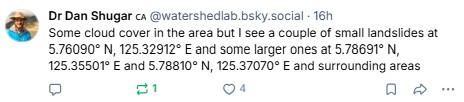
There are various news reports trickling in about the landslides triggered by the 8 June 2026 M=7.8 earthquake offshore Mindanao in the Philippines. As usual, the remote locations of many of the landslides means that the information is a bit hit and miss at this point.
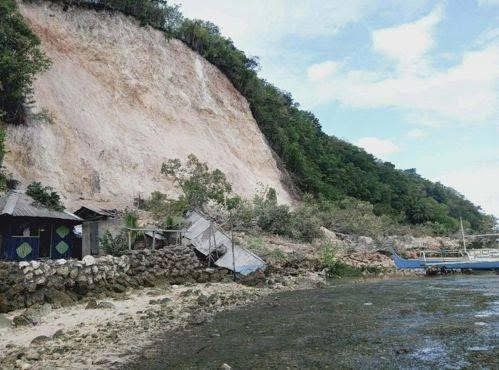
To date, the most serious event appears to have occurred at a community called New Aklan, located in Glan, Sarangani. It appears that New Aklan is at: [5.7705 N, 125.3356]. News reports indicate that 13 people were killed, although there are also indications of additional fatalities in this area.
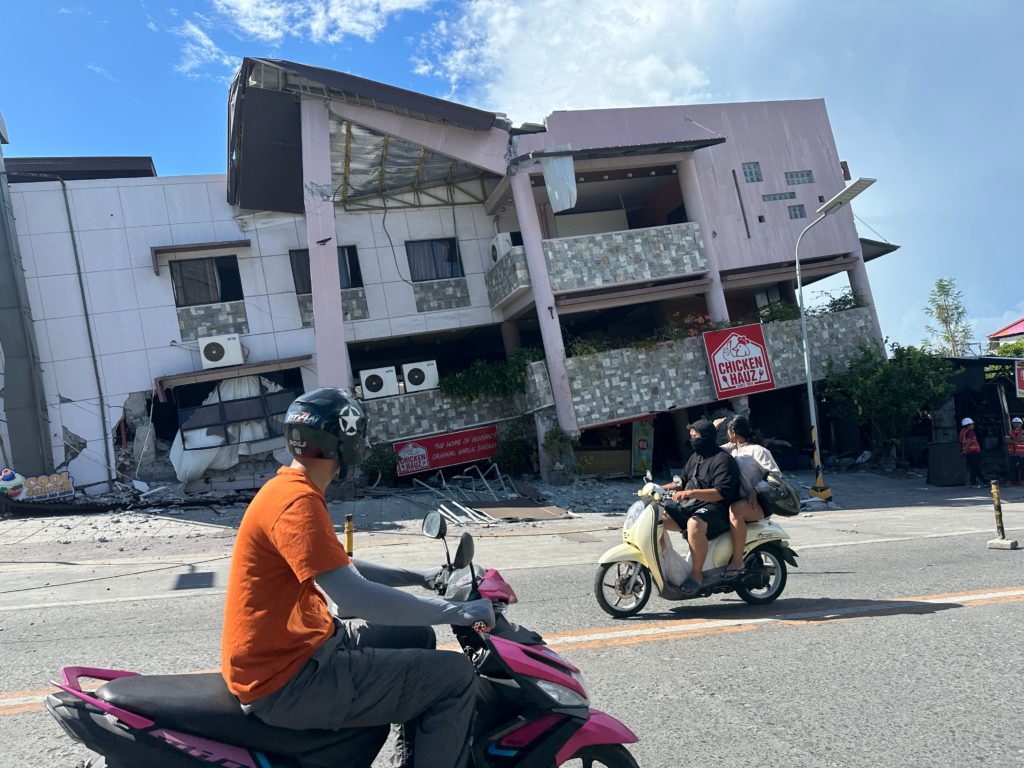
A failure in a coastal cliff at Sitio Buhangin, Barangay Patuco, Sarangani following the 8 June 2026 earthquake near Mindanao. Image tweeted by Radyo Pilipinas.
Media reports indicate that ten people were killed by the landslide and that a further 18 people were injured. Baining is located at [-4.2548, 151.7811], so I assume that this is the general area.
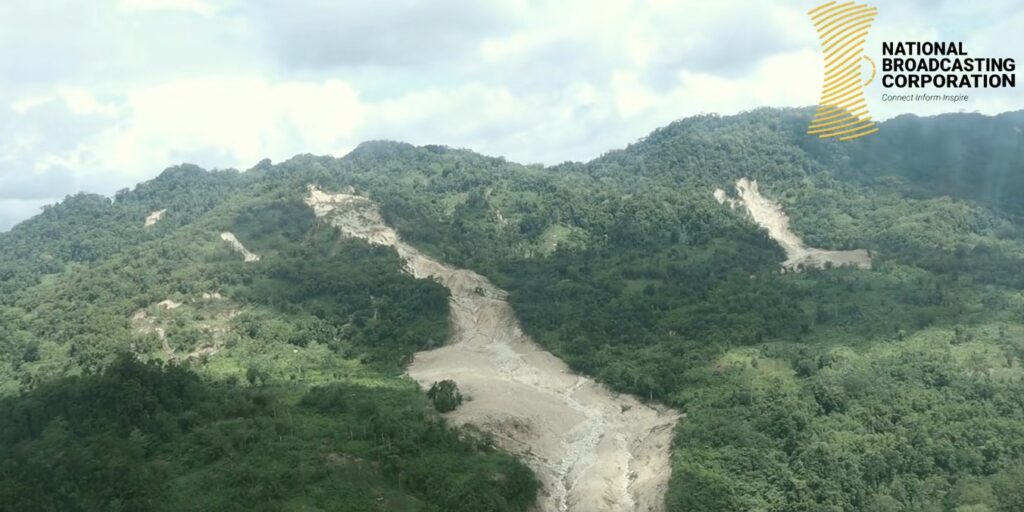
Gaining information about landslides in the remote areas of Papua New Guinea is very challenging – the terrain is rugged and there is a high level of civil turmoil. But the best source of information is on the Facebook page of NBC East Britain, which has posted a helicopter video of the aftermath. This is a still from that video:-
There are several interesting aspects of this landslide. First, the failure appears to have initiated high on the hillslope in an area that has a mix of forestry and cleared areas. The source appear to be quite large and deep-seated. This has transitioned into a disrupted debris slide / avalanche with a substantial amount of entrainment.
Note also the multiple other landslides in that area, all fresh, suggesting that the intense rainfall was sufficient to drive widespread failures. It is interesting to note though that is event did not involve multiple shallow landslides that combined to create a channelised debris flow.
Initial analyses suggest that the earthquake this morning has the potential to have triggered significant numbers of landslides and areas of liquefaction.
At the time of writing, the impacts of the M=7.8 earthquake that occurred offshore the south coast of Mindanao in the Philippines remain unclear. Initial reports in the local press suggest 15 fatalities so far, but as always it could be the case that there is no information from those areas most seriously impacted.
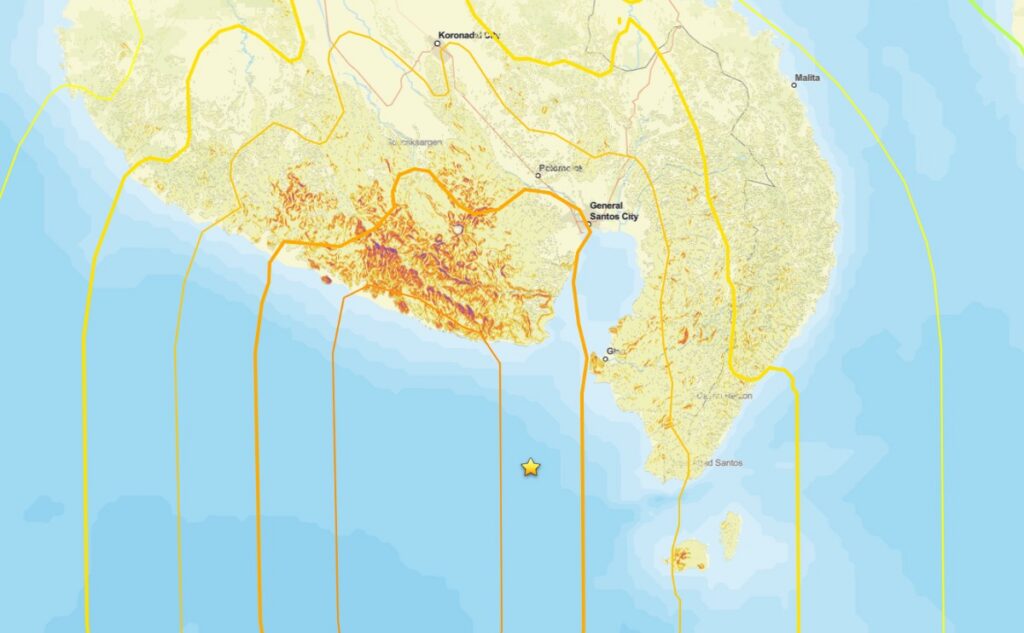
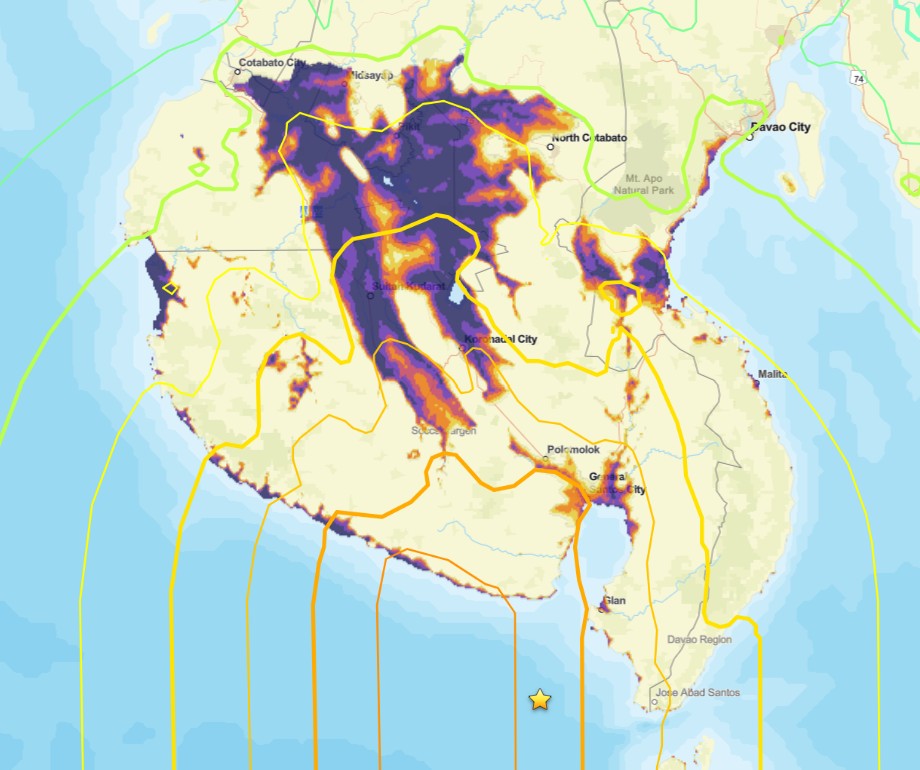
The USGS Pager site is the best source of information about potential landslide impacts, bearing in mind there is a high level of uncertainty. This estimates that the area exposed to landslides is at the high end of the “significant” scale and that the population exposed to landslides lies in the 1,000 to 10,000 people range. This is the Pager landslide hazard map:-
Initial Pager map of landslide hazard from the 8 June 2026 earthquake offshore Mindanao in the Philippines. Source: USGS.
The area with the highest level of landslide hazard is remote and rural, so we may not get good information from this area for a while.
The potential for liquefaction may be even more serious, with a broad swathe having a high level of hazard:-
Initial Pager map of liquefaction hazard from the 8 June 2026 earthquake offshore Mindanao in the Philippines. Source: USGS.
One final point to note is that the Philippines is just entering the typhoon season. Fortunately, Mindanao is sufficiently far south to be away from the main typhoon zone. However, these storms are so large that they can bring very heavy rainfall – see for example Typhoon Bopha in 2012. A similar event this year could have very significant consequences.
Months after wildfires eliminate vegetation that holds hillside sediment together, debris flows—destructive landslides that carry bulky material down once-stable slopes—can devastate infrastructure, taking out roads and buildings in their wake.
Though the U.S. Geological Survey (USGS) creates hazard predictions used to warn communities of the risk of these postfire debris flows, those predictions haven’t fully considered how recovering vegetation reduces risk over time—until now.
A new study published in Geosphere presents a new way to calculate postfire debris flow risk that takes vegetation recovery into account. The USGS will begin using the new method this wildfire season to create more accurate maps of debris flow hazard in the years after a fire.
“I’m so appreciative that the focus on how the debris flow hazard changes over time after fire is being addressed,” said Nancy Calhoun, a geologist and postwildfire debris flow program manager at the Washington Geological Survey who was not involved in the new study. Calhoun said she relies on the USGS hazard assessments for virtually everything her job requires.
“We’re glad to have a way that we can help our partners moderate those situations where the hazard has decreased,” said Andrew Graber, a geologist at the USGS Landslide Hazards Program and lead author of the new study.
Assessing Hazard, Again
After a wildfire, the USGS creates hazard maps that incorporate information about soil type, steepness, and burn severity (how much vegetation has been lost) to show where the risk of a debris flow may be elevated.
Then, the agency distributes this guidance to the National Weather Service, which uses it to set rainfall thresholds: levels of rainfall at which a debris flow becomes likely. State, county, and city agencies use those rainfall thresholds to issue warnings or take action when rainfall is imminent, for example, by closing highways or triggering evacuations.
“That left us with some uncertainty when we started to get further away in time from the fire.”
The methods used to create the USGS maps, however, historically relied on a snapshot of the burned area taken just after the fire, and the maps weren’t updated to reflect conditions as vegetation grew back and began holding soil in place again.
That led to situations where public safety decisions were made on the basis of outdated maps and rainfall thresholds. For example, concern over debris flows after the 2020 Grizzly Creek Fire in Colorado led to several closures of Interstate 70 in 2022, but the debris flows never happened.
“What [the original assessments] didn’t capture is how the vegetation came back,” Graber said. “That left us with some uncertainty when we started to get further away in time from the fire.”
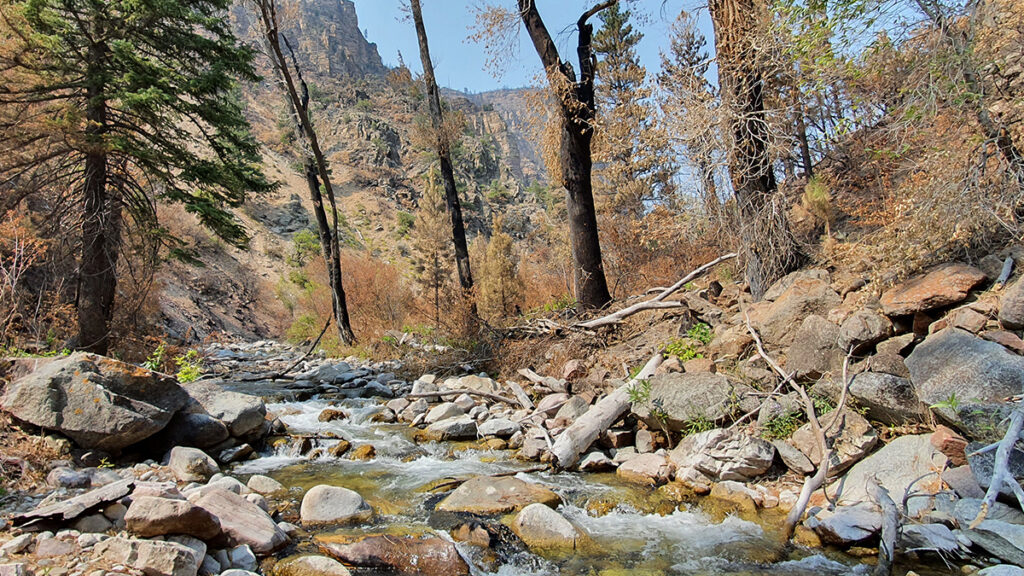
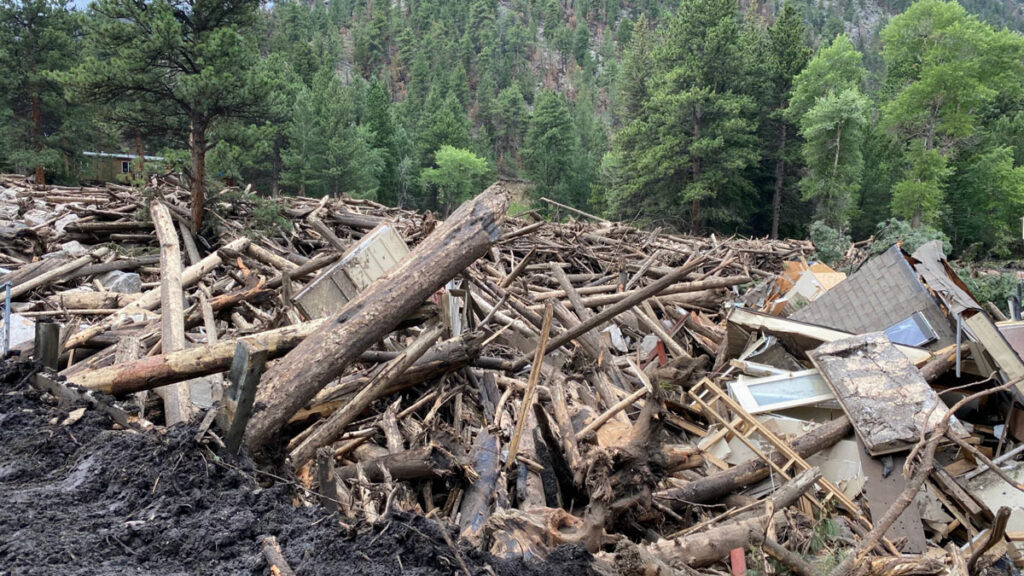
Intense rainfall in July 2025 triggered a debris flow near Dayton, Wyo., in the 2024 Elk Fire burn area. Credit: USGS, Public Domain
To test an improved method for these hazard assessments, Graber and the research team incorporated satellite imagery of 12 burned areas that showed the degree of vegetation recovery right after the fire, 1 year after the fire, and 2 years after the fire. Then, they tested their new method by comparing its predictions to rainfall and debris flow data from the 12 burned areas.
The updated method better reflected what had actually happened after the fires, reducing the number of unnecessary warnings without missing real-world debris flows.
Risk Recalibration
The USGS plans to begin using their new workflow to create hazard maps for some higher-profile fires during the coming wildfire season.
“It’s a really important question: Are we still worried about this burn scar?”
That’s exciting for Calhoun. As part of her job, she’s in constant contact with emergency managers who periodically ask how worried they should be about debris flows in areas that burned years ago. “It’s a really important question: Are we still worried about this burn scar?” she said.
Right now, Calhoun has no data to point to in the years after a fire to give an updated answer to that question. Using the new method from Graber and the research team, she will.
“Because they’re using satellite [imagery] and repeatable quantitative methods to look at these burn scars over time, we’ll actually be able to say something useful and informed about vegetation recovery,” she said.
Having a deeper understanding of how debris flow risk evolves over time is especially important because debris flows themselves are becoming a greater risk to the public as a result of increasingly intense wildfires and rainstorms. In addition, more accurate assessments can reduce warning fatigue, which occurs when too many false alarms lead to people ignoring or opting out of alerts.
Graber hopes he and the USGS will continue to improve their methods for assessing debris flow hazards by collecting more debris flow data across the country and improving the underlying equation for hazard assessments so that it better reflects the unique conditions of different ecosystems in the United States. USGS researchers also published a new study in March presenting a method to generate maps of where debris flows might travel if they do occur.
“It’s a big year for USGS’s useful postfire products,” Calhoun said.
This news article is included in our ENGAGE resource for educators seeking science news for their classroom lessons. Browse all ENGAGE articles, and share with your fellow educators how you integrated the article into an activity in the comments section below.
Citation: van Deelen, G. (2026), A new approach can better predict debris flow hazards years after fires, Eos, 107, https://doi.org/10.1029/2026EO260160. Published on 19 May 2026.
This massive landslide produced a tsunami that reached 481 meters on the opposite side of the fjord—higher than all but the world’s 14 tallest buildings—and registered on seismic detectors around the globe. For days after the slope collapsed, the waters of the fjord churned with a standing wave known as a seiche.
This drone video shows a man paddling through the iceberg-filled Tracy arm fjord in the aftermath of a landslide. Credit: Bill Billmeier
This event was the second-largest tsunami ever recorded and the largest not linked to an earthquake. A new paper published in Science presented strong evidence that the Tracy Arm landslide was instead the result of the rapid retreat of South Sawyer Glacier, itself a consequence of global climate change.
“It’s like if you have a kid and they said they cleaned their room but really all they did was throw everything in the closet. As soon as you open that door, everything falls out.”
Nobody was harmed by the rockslide or tsunami, but cruise ships were scheduled to visit the fjord later that morning. If the collapse had happened just a few hours later, it could have been disastrous.
“While the [South Sawyer] Glacier is in the fjord, it’s supporting those valley walls, like the buttresses on a cathedral,” said Daniel Shugar, a geomorphologist at the University of Calgary who led the study. “As that glacier retreated over the last few decades, it retreated just past the spot that did fail. It’s like if you have a kid and they said they cleaned their room but really all they did was throw everything in the closet. As soon as you open that door, everything falls out.”
This animation shows an overhead view of the 10 August 2025 Tracy Arm landslide. Credit: Patrick Lynett, University of Southern California
In other words, the glacier that carved the fjord in the first place was also holding its slopes in place, and the ice’s retreat under warming temperatures exposed rock that became vulnerable to crumbling. The proximate cause of the landslide might have been something else—as Shugar noted, rainfall is plentiful in that part of Alaska, which could have weakened the fjord’s walls further—but it might also have been a combination of small, individually insignificant factors. In any case, the removal of that glacial “closet door” was what made the collapse and tsunami possible.
“We know that steep slopes are very sensitive to the things that climate [change] is exacerbating, whether it’s losing permafrost, glacier retreating, or more water in the soil,” said glaciologist Leigh Stearns of the University of Pennsylvania, who was not involved with the Tracy Arm study. “Often, we think of glacier retreat as a long and continuous thing, but [it] can trigger sudden catastrophic events.”
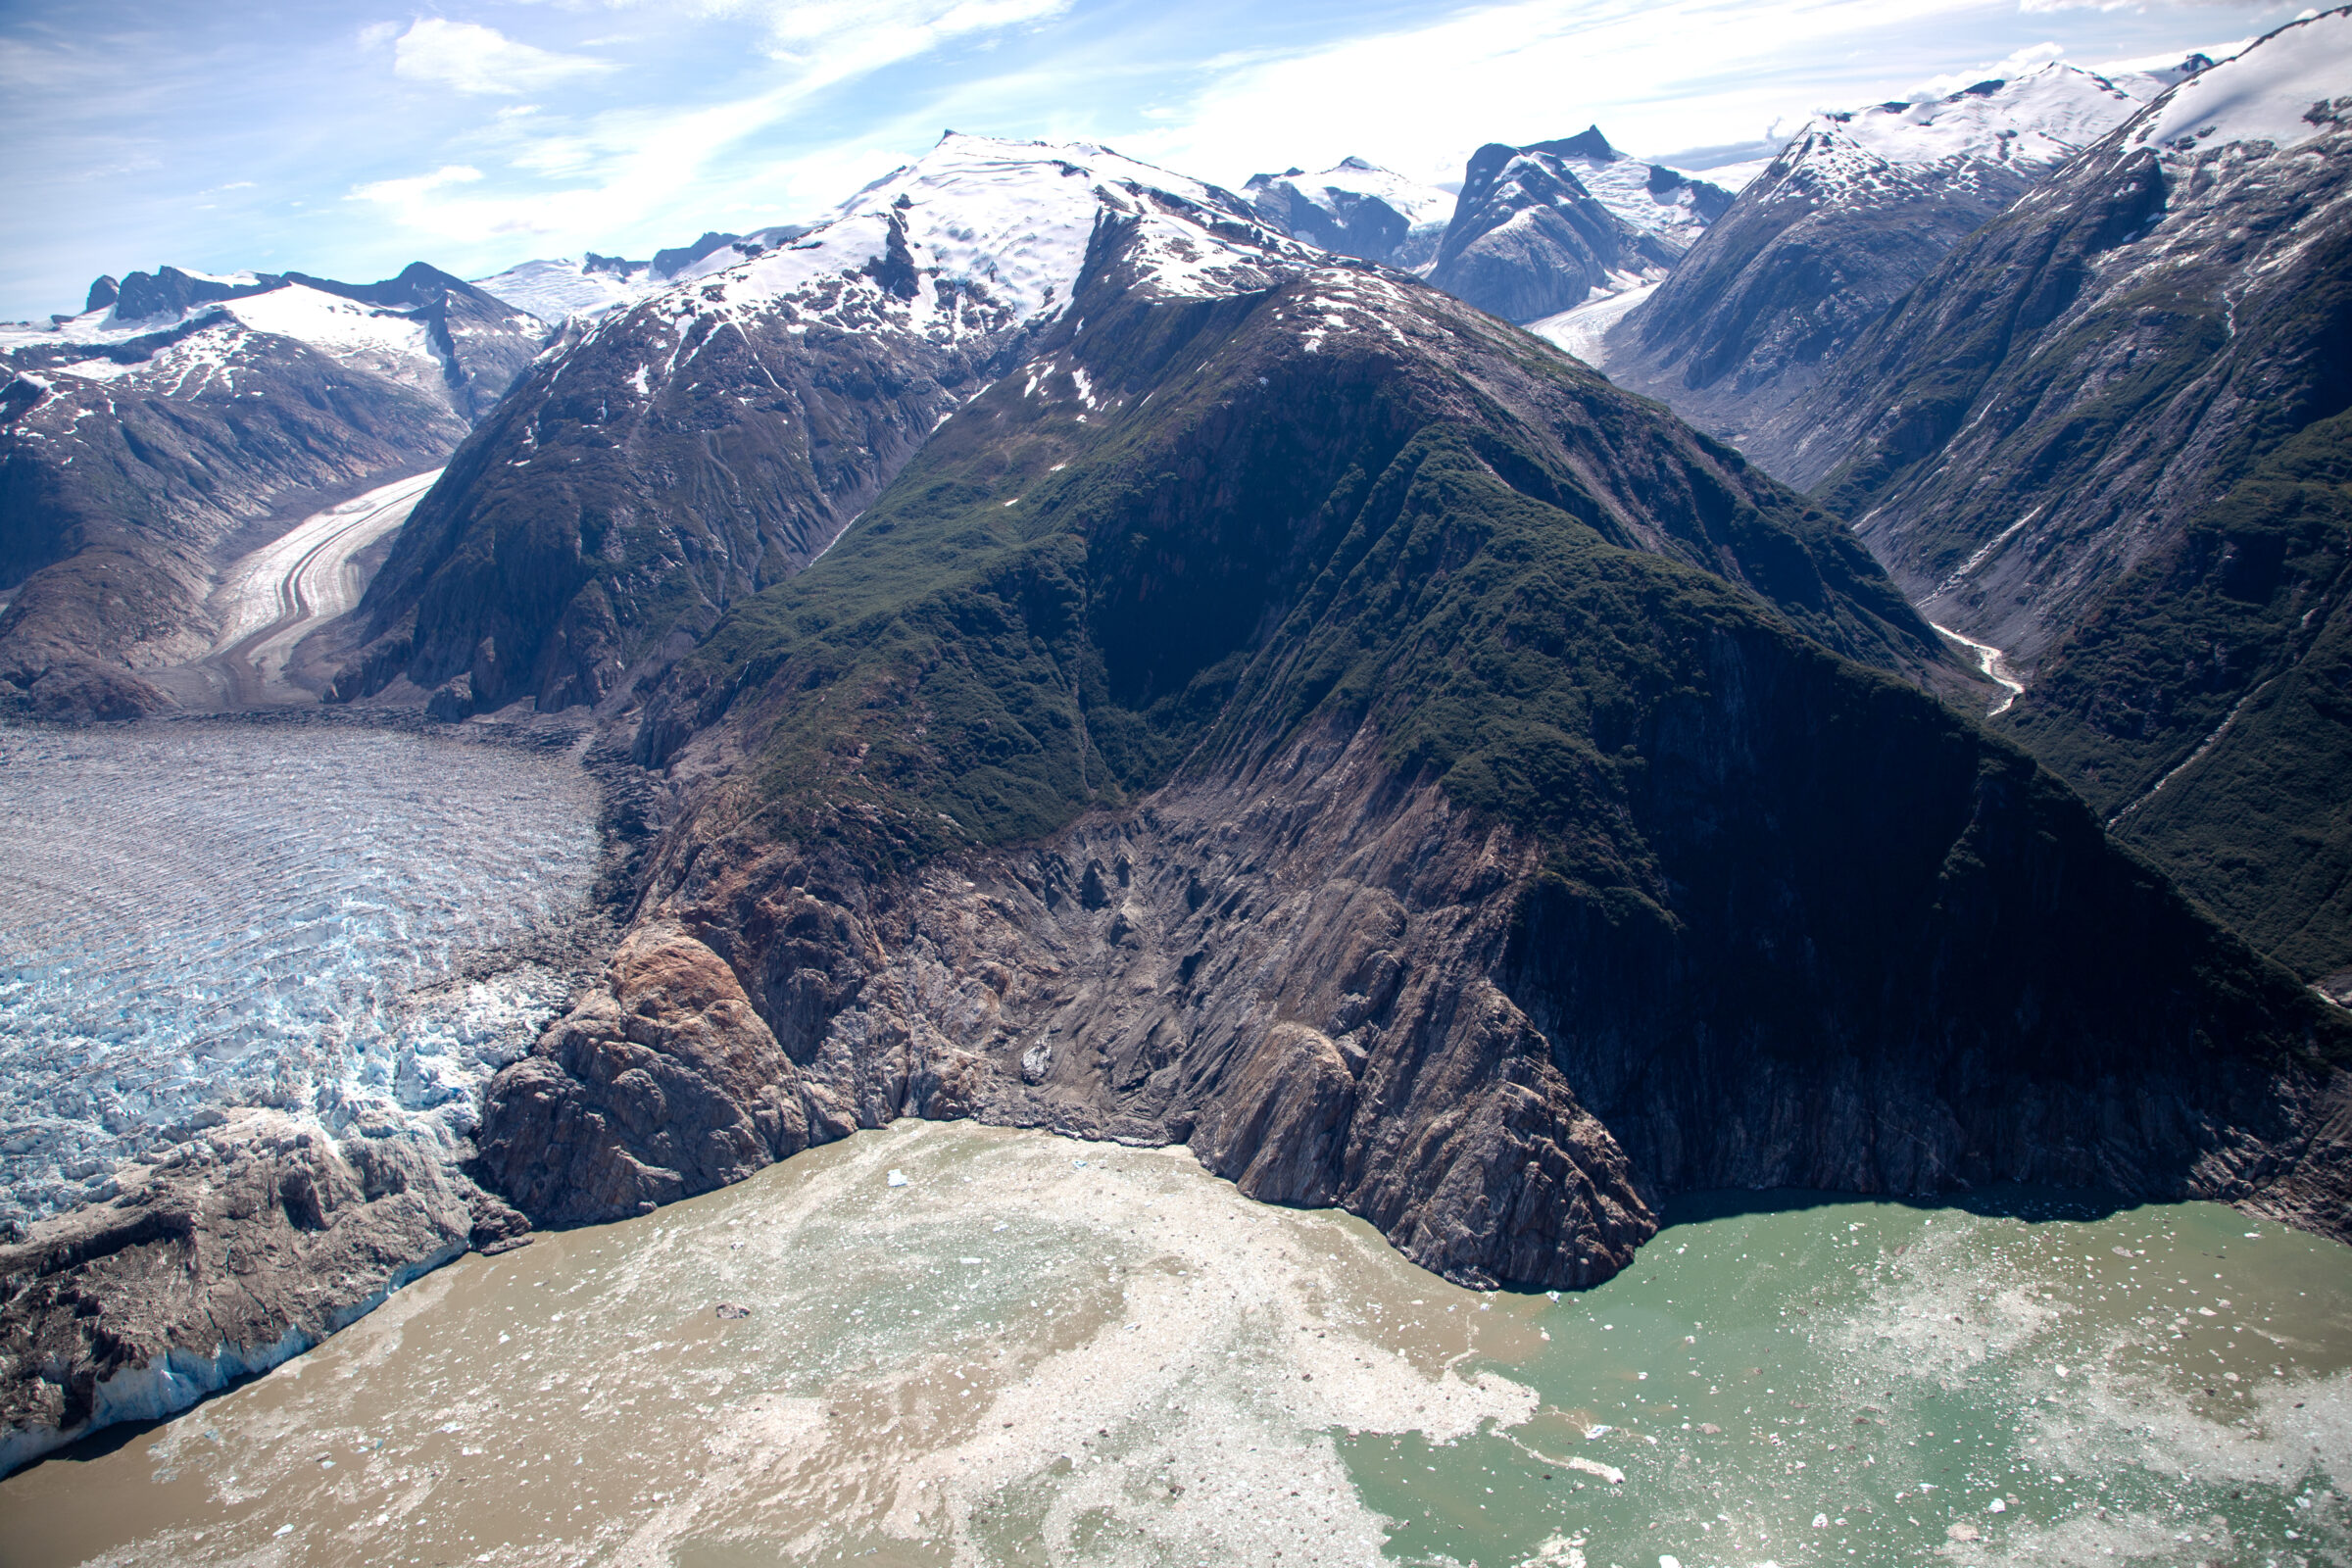
This aerial photo shows the highest run-up resulting from the 10 August 2025 landslide-triggered tsunami in Tracy Arm. It was captured during a U.S. Geological Survey field reconnaissance overflight on 13 August 2025. Credit: John Lyons/U.S. Geological Survey.
The Tracy Arm tsunami, like the record-setting Lituya Bay 524-meter megatsunami in 1958, was so dramatic in part because it happened in a fjord. The steep sides of the relatively narrow channel concentrated the energy generated by the rockfall into water.
A drone video shows the tsunami-affected part of the fjord, including the highest run-up area and the landslide itself. Credit: Bill Billmeier
Unlike Lituya Bay, which resulted from an earthquake, Tracy Arm provided very little seismic warning before the slope collapsed, requiring forensic work to determine what caused it.
Shugar noted that South Sawyer Glacier had retreated by roughly 500 meters in the spring of 2025 alone, on top of the general trend of shrinking and thinning over the decades. And it’s not alone: Interferometric synthetic aperture radar (InSAR) images taken by satellites indicate that many slopes in Alaska and beyond are in motion, pointing to potential future danger.
“Not every single one, but it seems like a huge majority of [shifting slopes] are above the lower parts of thinning glaciers,” Shugar said. He described this phenomenon as “debuttressing,” as in losing the glacial buttress holding a slope up. He added, “I think in the next 5 years or so, we’ll probably have a much better understanding of just how and how quickly slopes respond to that debuttressing.”
Threats, Hazards, and Climate Change
“We were unbelievably lucky that the [tsunami] occurred with the timing that it did, and not 5 hours later.”
Most tsunamis are set in motion by earthquakes and travel across the open ocean, wreaking their destruction when they reach shallower water near coasts; the word “tsunami” means “harbor wave” in Japanese. The Tracy Arm tsunami joined the ranks of other landslide-driven tsunamis, like the ones in Taan Fiord (Alaska) and Dixon Fjord (Greenland), in being linked to human-driven climate change. Beyond the immediate impact of the waves, this category of hazard requires rethinking potential risks from abrupt catastrophes like debuttressing as well as slower effects such as sea level rise.
“The risk to any particular cruise ship [from a tsunami] on any particular day is very low,” Shugar said. “We were unbelievably lucky that the [tsunami] occurred with the timing that it did, and not 5 hours later. The risk certainly still could be increasing as we build new settlements, new mining camps, or new oil and gas infrastructure.”
Both Shugar and Stearns highlighted the importance of learning lessons from Tracy Arm and related events.
“Climate is a threat multiplier, and the research is really forcing us to look at these cascading hazards,” Stearns said. Tracy Arm “is one example of this: Small slow changes can trigger big events. Hopefully, we don’t need so many disasters to spur some change.”
A drone video shows Sawyer Island in the Tracy Arm Fjord and evidence of the tsunami on the fjord walls. Credit: Bill Billmeier
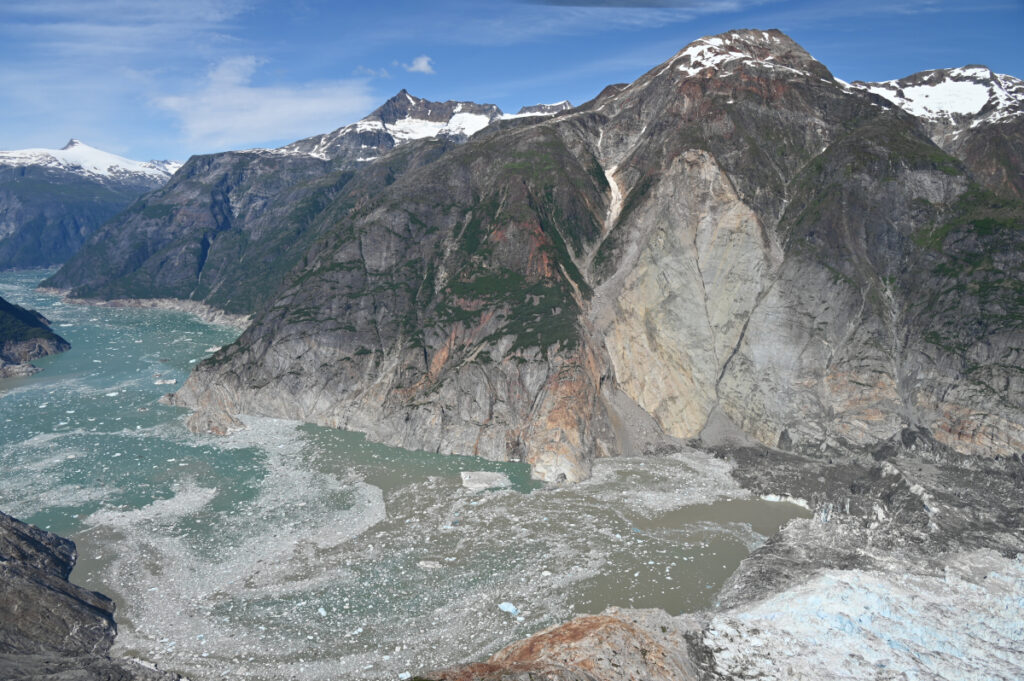
This aerial photo shows the north side of Alaska’s Tracy Arm Fjord in the aftermath of the 2025 landslide and tsunami. The lighter-colored rock is the exposed surface, where the mountainside collapsed and fell into the water. The foot of South Sawyer Glacier is visible at lower right; in decades past, the ice extended much farther and was thick enough to hold the rock slopes in place. Credit: Cyrus Read/U.S. Geological Survey