Source: Journal of Geophysical Research: Earth Surface
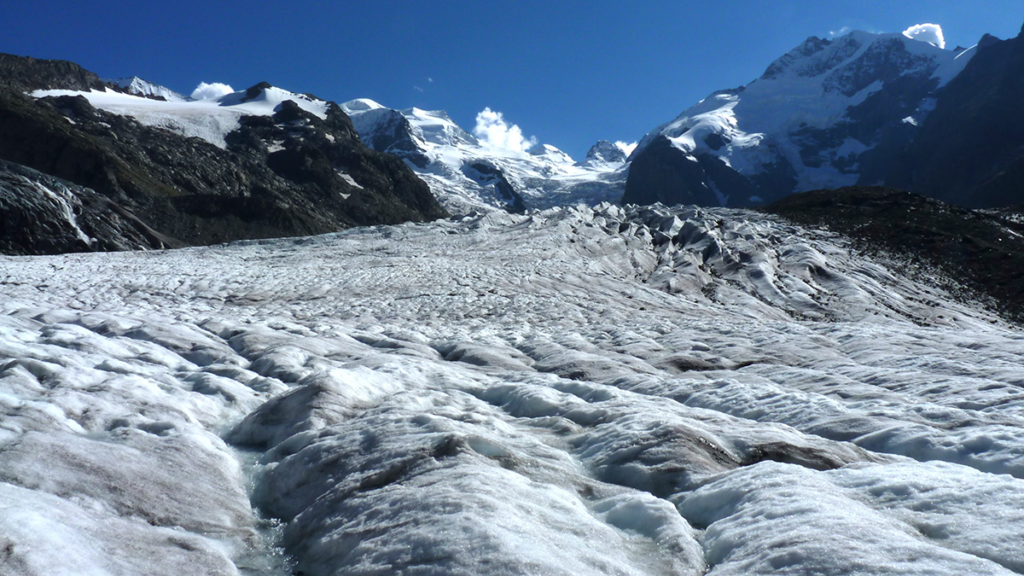
Glacier ice is a crystalline material that flows across the Earth’s surface and is often close to the pressure-melting point. The way ice deforms is therefore an interplay of many factors including the temperature, grain size, and purity of the ice. Numerical models of ice flow are based on the Glen-Nye flow law (Glen’s Law)—a simple relationship between stress and strain in ice developed by John Glen and John Nye from laboratory experiments in the 1950s. Glen’s Law derives strain (creep, or deformation flow of ice) from the applied stress raised to the power of the exponent n, multiplied by the temperature-dependent constant A. The values for these parameters are empirical, and both linear and power-law forms of Glen’s Law have been proposed, although a value of 3 is typically used for n.
Lilien et al. [2026] use a flowline model to explore the impact of the choice of value for Glen’s n on the outcome of projections of ice sheet mass change, considering different values for A and different glacier sliding laws. They found that the relationship between n and glacier mass loss is complicated and varies depending on glacier type. For dynamically controlled glaciers, increasing n increased mass loss, as ice flowed more rapidly into ablation areas. For surface mass balance-controlled glaciers, increasing n decreased mass loss, because ice flux decreased at the equilibrium line. The authors find that using a single value for Glen’s n is likely to lead to large uncertainties in projections of ice sheet change, and therefore studies of future ice sheet mass loss need to consider how the flow-law exponent varies spatially.
Citation: Lilien, D. A., Ranganathan, M., & Shapero, D. R. (2026). Effect of the flow-law exponent on ice-stream sensitivity to melt. Journal of Geophysical Research: Earth Surface,131, e2025JF008726. https://doi.org/10.1029/2025JF008726
Citizen science continues to spread across the world. It is becoming an acceptable and reliable practice to monitor and report on local conditions. Yet, it must adapt to local conditions and constraints – such as the profile of participants, their level of education, or the time that is available for them. So, how does citizen science adapt to Low- and Middle-Income Countries (LMIC)?
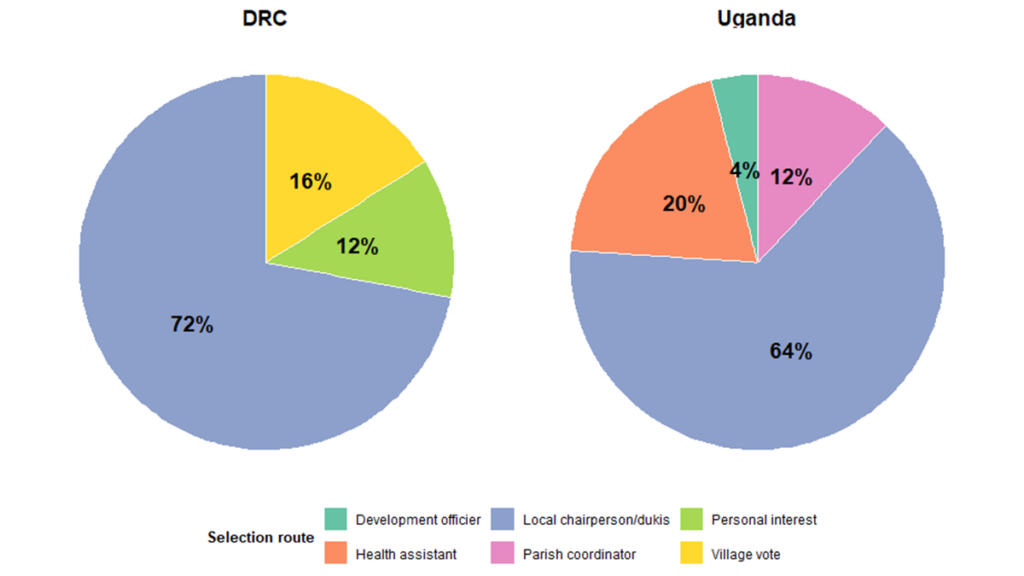
In Ashepet et al. [2026], we learn from the ATRAP (Action Towards Reducing snail-borne Parasitic diseases) project, which focuses on the monitoring of snail-borne disease in Uganda and the Democratic Republic of Congo (DRC). The researchers show how citizen science requires consideration such as material and social benefits for the participants, and how social structure and practices need to be taken into account. The paper also challenges the universality of the European Citizen Science Association (ECSA) 10 principles of citizen science.
Citation: Ashepet, M. G., Mulmi, J., Michellier, C., Jacobs, L., Pype, K., & Huyse, T. (2026). Citizen science principles in practice: Lessons from Uganda and the democratic Republic of Congo. Community Science, 5, e2025CSJ000149. https://doi.org/10.1029/2025CSJ000149
Japan’s bear problem continues, and the country is running out of the robot wolves that help keep them at bay. First released in 2016 by the manufacturer Ohta, Monster Wolf was originally designed to ward off the agricultural foes like boars, deer, and the island nation’s Asian black bear (Ursus thibetanus) and brown bear (Ursus arctos) populations. The creative solution quickly went viral for its red LED eyes and menacing fangs—as well as its admittedly odd, furry pipe frame.
Starting at around $4,000, each bespoke Monster Wolf is now equipped with battery power, solar panels, and detection sensors. Its speakers are programmed with over 50 audio clips including human voices and sirens audible over half a mile away. These aren’t assembly line products, however. Each Monster Wolf is custom made, and Ohta simply can’t keep up with the current demand.
“We make them by hand. We cannot make them fast enough now. We are asking our customers to wait two to three months,” company president Yuji Ohta recently told the AFP.
Bear encounters in Japan have steadily risen, as urban development continues to encroach on their habitats and limit their food sources. The country’s rapidly aging population is also making them particularly susceptible to attacks, especially in more rural regions. Since the beginning of 2025, the government has reported at least 200 injuries and 13 fatalities—over twice the previous mortality record. Official data also recorded over 50,000 bear sightings across the country during the same time period.
Ohta told the AFP that amid the ongoing crisis, there has been “growing recognition” that Monster Wolf is “effective in dealing with bears.” The main customer base remains farmers, but orders are also coming from golf courses and rural workers. Upgraded versions will soon include wheels to actually chase animals and patrol preset routes. There are also plans to release a handheld version for outdoor enthusiasts and schoolchildren.
For a few select evenings in the late spring and early summer, sunlight aligns with Manhattan’s grid. The city’s bustling streets are washed with golden light as the sun sets, while tourists and locals alike flood the streets to snap that perfect picture. This event is nicknamed Manhattanhenge and it will begin on May 28 and continue through July 12.
However, you don’t need to live in the Big Apple to see a “henge” like Manhattanhenge. They actually pop up in a few places and a website called Hengefinder can help you find the closest henge.
Meet Hedgefinder
Data scientist and engineer Victoria Ritvo created the website, while software engineer John Pribyl built the accompanying app. Ritvo wrote about creating Hedgefinder in her blog, and details the three basic steps that scientists can use to find a henge. First, find the angle of the road, or its bearing relative to true north. Second, find the angle of the sun at sunset, or its azimuth. Third, find the dates when those two angles match.
While you don’t have to do any of that high-level math, you can read about how Rivoto and Pribyl made their calculations. You simply put in an address or city and can get a calculation for the closet henge near you.
“Having Hengefinder active means henges are now explorable outside of Manhattan, and I’ve been searching for them using the app,” Ritvo writes. “My favorite one so far, I haven’t actually seen. I’m intrigued by the Haarlemmertrekvaart, a canal which traces the southern edge of Westerpark in Amsterdam.”
Interestingly, much of Europe is left out of henge mania due to medieval street design. Amsterdam’s famed canals do offer an option, where sunlight can reflect off of the water. Henges may have been occurring twice a year for the past 400 years on the Haarlemmertrekvaart.
How henges work
The sun does not set in the same place every day. Its position changes along the horizon with the seasons. While the angle does not usually match the directions of a street, it will on a few days each year if the street is angled correctly.
In 1997, the term Manhattanhenge was first coined by Neil deGrasse Tyson, an astrophysicist and director of the Hayden Planetarium at New York’s American Museum of Natural History. Tyson noted that the setting sun framed by Manhattan’s building was comparable to how the sun’s rays strike the center of England’s Stonehenge on the solstice. The Neolithic humans who built the stone circle in stages between 3100 BCE and 1600 BCE intended for the light to shine that way on the solstice. But the builders of Manhattan? Not so much.
Chicagohenge in Illinois and Baltimorehenge in Maryland both occur when the sunset lines up with the grid systems in those cities around the spring and fall equinoxes in March and September. In Canada, Torontohenge occurs in February and October.
Despite acing a flight test of its newest Starship capsule, SpaceX has to speed through an obstacle course of tech hurdles to win the race to land astronauts on the Moon.
Bioluminescence is everywhere in nature, but it puts on its biggest light shows underwater. In the deepest regions of the oceans, as much as 90 percent of all living creatures may possess at least some ability to shimmer thanks to cellular chemical reactions. However, the ethereal displays aren’t limited to these deep, dark waters. The cold blue glow from bioluminescent algae like Pyrocystis lunula is occasionally visible atop waves for other organisms to see.
Still, spotting these glimmers is difficult for the naked eye. P. lunula only shines for a few milliseconds at a time when agitated. However, those lights could hypothetically remain illuminated for much longer if certain chemical switches are flipped on in the algae. The possibilities would be vast—suddenly, harmless organisms could replace environmentally toxic chemicals used to produce artificial glows, and even cut back on electricity usage for lights.
“This project was a moonshot idea,” University of Colorado Boulder civil engineer Wil Srubar said in a recent profile. “I was curious if we could create a world in which we don’t use electricity but rather use biology to produce light.”
Drawing on previous research, Srubar and his colleagues assessed P. lunula’s bioluminescent response to basic and acidic compounds. They tested one acidic compound with a pH of 4 (similar to tomato juice) and a more basic compound with a pH of 10 (similar to hand soap).
Their results, published in the journal Science Advances, suggest algae could be part of a brighter, more sustainable future. In both cases, P. lunula began to shine. Acidic exposure made the algae glow brightly for up to 25 minutes, while the basic compound produced a shorter, more diffused light.
“It was a very exciting moment when we found the right chemical stimulant that allowed the light to stay on for a long time,” said engineer and study co-author Giulia Brachi. “This is the first time we have figured out how to sustain luminescence.”
The team took things even further from there. The engineers embedded the algae into various shaped objects made with naturally sourced, 3D-printed hydrogel. Because the acid and base solutions aren’t lethal to P. lunula, the organisms survived for weeks while constantly glowing. After four weeks, the acid-treated examples still retained 75 percent of their brightness.
According to the team, there are a range of uses for P. lunula. Autonomous robots and even space exploration equipment could produce battery-free light illuminated by the algae. If the algae responds to other chemicals, then it may show promise as a tool to test water quality or toxicity. What’s more, the photosynthetic algae doesn’t produce any carbon—it devours it.
“We’re storing carbon while we’re producing light, whereas conventionally, we emit carbon to light up spaces,” said Srubar. “This discovery really paves the way for engineering other living light materials and devices.”
NASA on Tuesday outlined the first phase of a sprawling moon base plans on Tuesday, less than two months after the Artemis II's record-breaking lunar flyaround, with visualisations of landers, rovers and drones. The space agency also awarded hundreds of millions of dollars in contracts to four US companies.
Tyrannosaurus rex is iconic for its ferocity and big teeth, as well as those teeny-tiny arms. The Cretaceous Period apex predator wasn’t the only carnivore with underdeveloped forelimbs, however. At least five groups of two-legged, mostly meat-eating theropod dinosaurs experienced a shortening of the upper arms over the course of their evolutionary journey. But why did they have such comically small claws? One team of researchers believes the answer is simple.
“It’s a case of ‘use it or lose it,’” University College London paleontologist Charlie Scherer said in a statement.
Scherer and his colleagues recently examined the data for 82 theropod species, including those in T. rex’s tyrannosaurid family. Their study published today in the Proceedings of the Royal Society B Biological Sciences argues a combination of massive skulls and crushing jaws—coupled with increasingly large prey—had many theropods relying increasingly less on their forearms.
“We sought to understand what was driving this change and found a strong relationship between short arms and large, powerfully built heads,” explained Scherer. “The head took over from the arms as the method of attack.”
The team based their conclusions on a new system of assessing dinosaur skull strength based on attributes like overall dimensions, how tightly bones were joined in the head, and bite force. Unsurprisingly, T. rex came in first place for bite force, followed by the Tyrannotitan. Almost as large as a T. rex, the Tyrannotitan lived in present-day Argentina during the Early Cretaceous over 30 million years before its famous descendent. In each example, the reason for short arms likely coincided with hunting larger and larger dinner targets.
“Trying to pull and grab at a 100–foot–long sauropod with your claws is not ideal. Attacking and holding on with the jaws might have been more effective,” added Scherer.
Overall, the team identified a bigger correlation between skull strength and smaller arms than with either skull or body size. This conclusion is further supported by some theropod dinosaurs with strong heads, tiny forelimbs, and a relatively small stature. For example, Majungasaurus roamed present-day Madagascar 70 million years ago while weighing about 1.75 tons—around a fifth the size of T. rex.
Not every dinosaur’s limbs shrank in the same way, either. Abelisaurids like Majungasaurus exhibited smaller arms past their elbows as well as their hands, while tyrannosaurid arms reduced proportionally. In each case, it seems that the theropods initially had far more success latching onto prey with their powerful jaws, then evolution did the rest of the work.
As to which dinosaur had the teeniest forearms, the answer according to Scherer is clear.
“The Carnotaurus had ridiculously tiny arms, smaller than the T. rex,” he said.
According to Comercializadora de Servicios Médicos Cubanos, S.A., Cuba reaffirmed its openness to foreign investment in specific sectors of the healthcare system with projects focused on wellness and rehabilitation tourism.
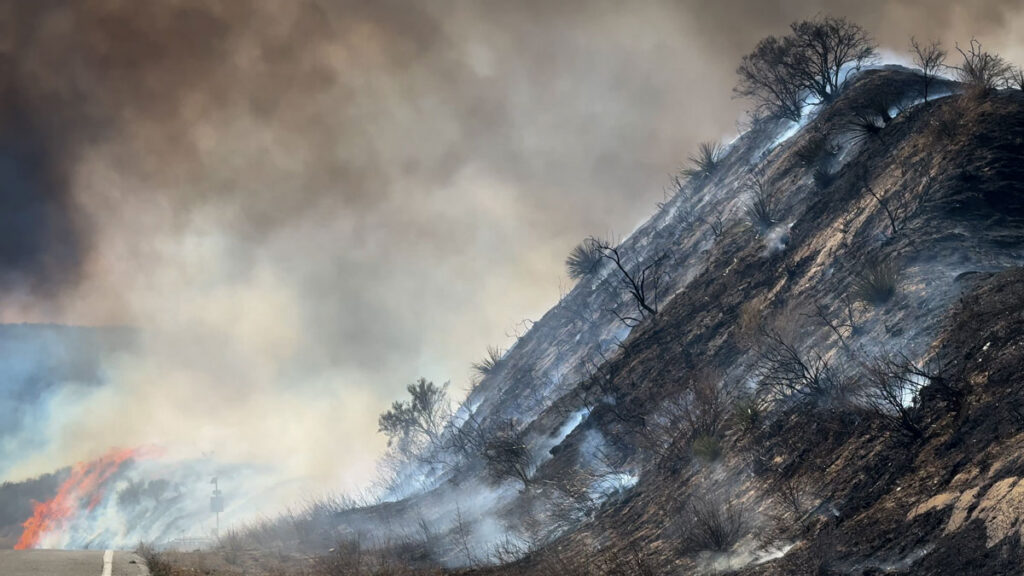
California is no stranger to the hot, dry summer weather that makes wildfires more likely. But wildfire season in the state is now stretching into the heart of winter, when it has historically been protected by cool, wet weather. In January 2025, Southern California experienced some of the deadliest and costliest wildfires in the state’s history.
Now, a new study published in Nature Communications shows that the climatic changes that increase the risk of these winter wildfires could be driven by low autumn snow levels thousands of miles away, in western Eurasia. The authors said that tracking snowfall in Eurasia could help forecast winters in California that will have higher chances of wildfires.
The researchers were motivated by the catastrophic 2025 wildfires to search for climate drivers of winter wildfire conditions in California. First, they looked for correlations between winter wildfires and ocean temperatures, especially La Niña events that are associated with drier-than-average conditions in California. They also examined variability in sea ice, which can affect global weather patterns. But they saw only weak connections.
Compared to oceans and sea ice, the influence of snow cover on global weather patterns is less studied, said Shineng Hu, a climate scientist at Duke University and lead author of the paper. But another climate researcher in Hu’s lab, Shizuo Liu (first author of the study), had previously studied the connection between snow cover and weather patterns and suggested the team look for connections between snow and fires. That’s when they found significant correlations between the winter wildfires in California and low snow cover in western Eurasia.
“When I saw the result, I was suspicious,” Hu said, “because we all know that correlation doesn’t mean causality.” But they ran hundreds of climate model simulations reducing snow cover in Eurasia and saw an increased probability of winter fires in California. “At that point, we were pretty much convinced that there could be something interesting happening over there,” Hu said.
Propagating Pressure
“I’m glad to see this group saying snow can do something similar to what ocean temperature anomalies can do.”
The scientists determined that this intercontinental link starts because the land absorbs more energy when snow cover is low, disturbing the atmosphere above it. This disturbance, like a stone thrown into water, generates large waves of air called Rossby waves that travel eastward along the jet stream across the Pacific Ocean. The Rossby waves drive the formation of a high-pressure zone that creates the hot, dry, windy conditions conducive to wildfires.
“I’m glad to see this group saying snow can do something similar to what ocean temperature anomalies can do,” said Judah Cohen, a climatologist at the Massachusetts Institute of Technology who was not involved in the study but has also studied the links between snow in North America and Eurasia. “I’ve been surprised by how important this mechanism is for U.S. weather in the winter and how little there is about it in the literature.”
“This is just one missing gap that people didn’t even realize. We want to add that to the table.”
But Cohen suggested the study tells only part of the story. In North America, dry winters in the west are paired with wet, cold winters in the east. The same is true in Eurasia, and according to Cohen’s past research, when snow levels are low in western Eurasia but high in eastern Eurasia, a temperature and pressure gradient is created across the continent. The energy released as the atmosphere works to equalize that pressure drives the Rossby waves. Cohen said the disparity between snow levels in eastern and western Eurasia would likely strengthen the Rossby waves and then the warming in California. “If all of Eurasia [had] below normal [snow levels], I don’t think you could easily excite this wave energy that propagates across the hemisphere.” He also stressed that Rossby waves don’t just travel eastward. They also travel upward into the stratosphere, where they bounce back down over North America and intensify the high pressure over the western United States.
Both Cohen and the study authors insisted that many other factors influence whether wildfires ignite in winter. “This is just one missing gap that people didn’t even realize. We want to add that to the table,” said Hu. But monitoring snow levels in Eurasia could offer signs of bad wildfire winters to come. The January 2025 Southern California fires were preceded by low snow levels in November and December in Eurasia, Hu said. “So there’s a 1‑month lag, which gives us some hope that we can use that for prediction.”
Citation: Chapman, A. (2026), Low snow in Eurasia linked to wildfires in California, Eos, 107, https://doi.org/10.1029/2026EO260138. Published on 13 May 2026.
New satellite images are helping scientists understand a major tsunami that changed the landscape of a popular tourist destination in Alaska forever.
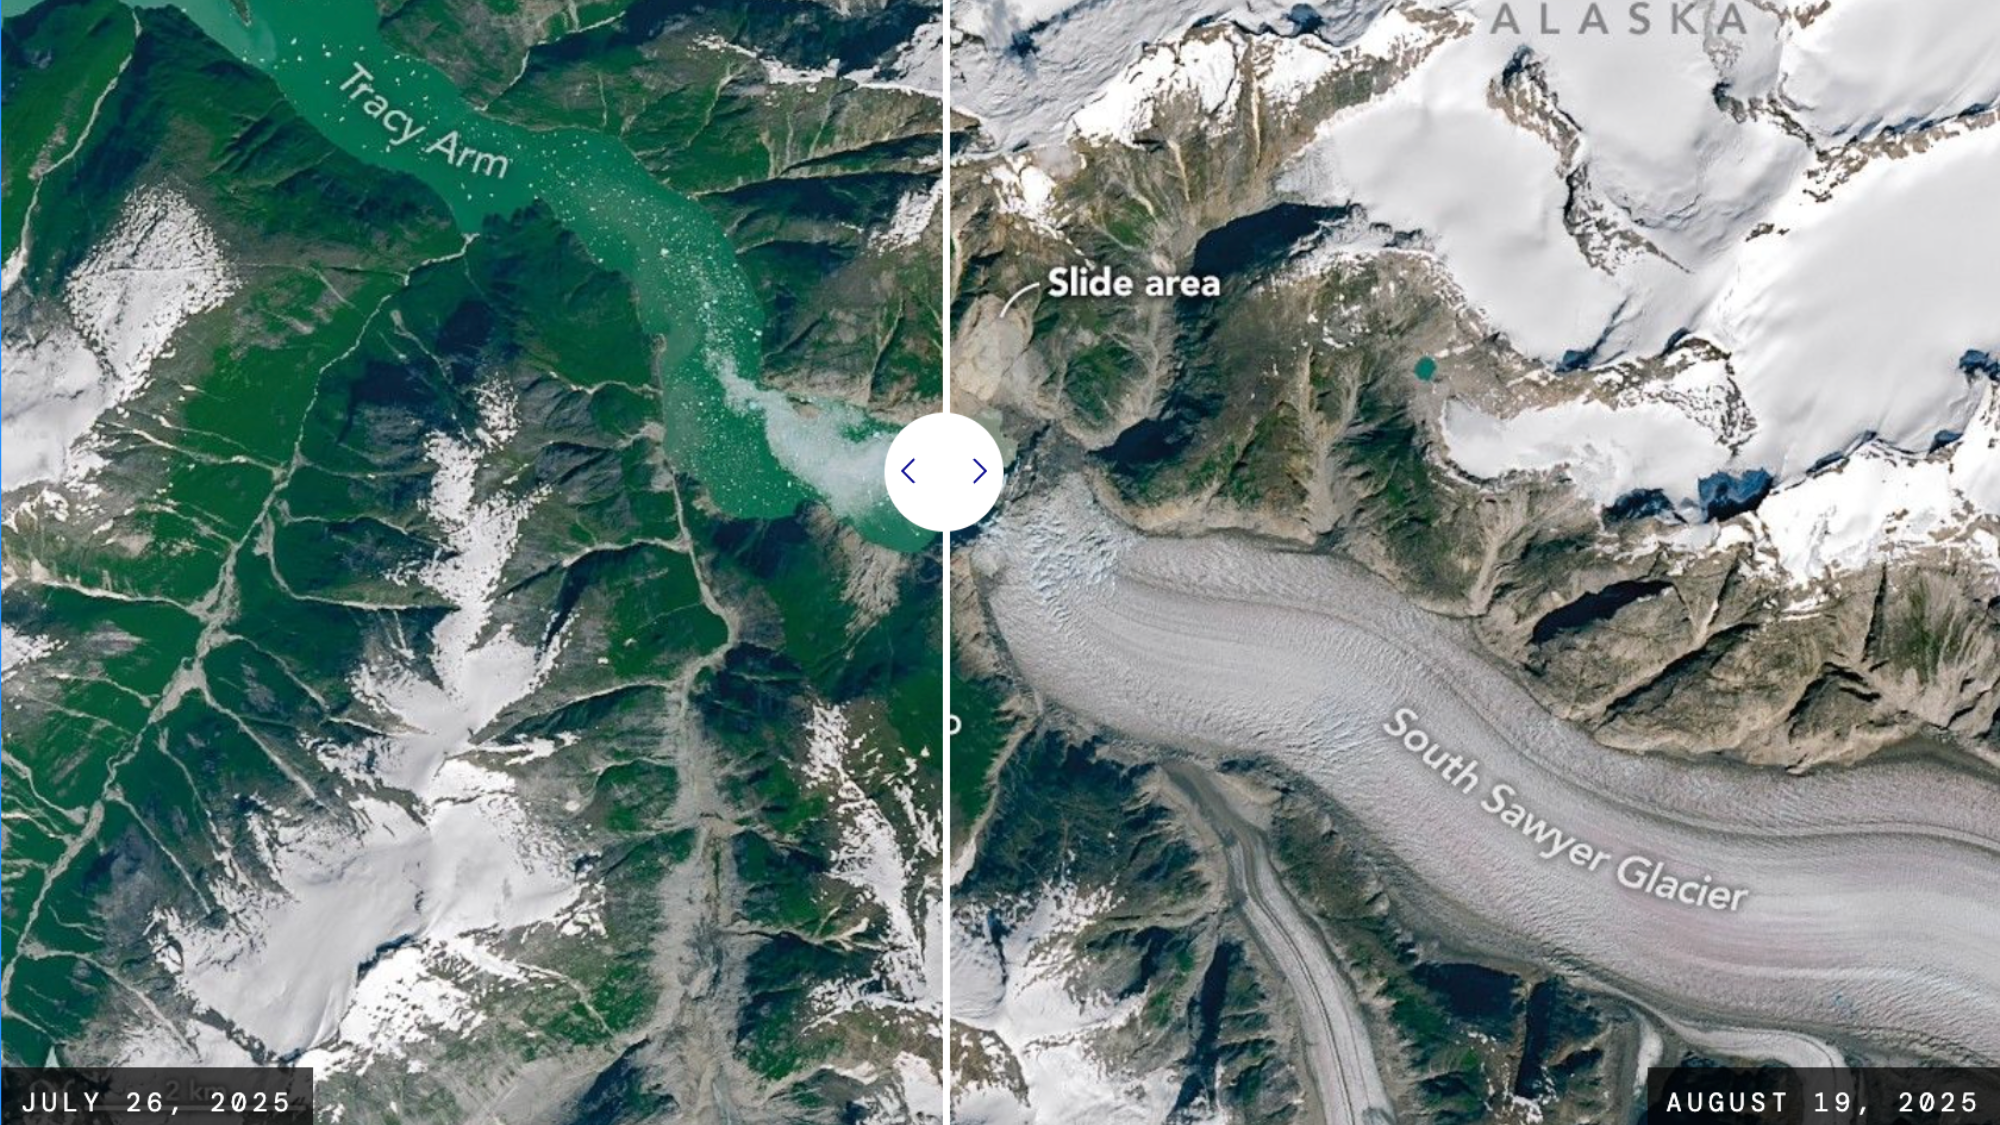
On August 10, 2025, a tsunami larger than the Eiffel Tower ripped through Tracy Arm fjord in southeast Alaska. The rapid retreat of the South Sawyer Glacier triggered a landslide that swept huge rocks down the picturesque waterway visited by millions aboard Alaskan cruises every summer. At least 64 million cubic meters of rock slid down the slope of the glacier. The rocks created an enormous tsunami that stripped trees and other vegetation from the opposing fjord wall up to 1,578 feet above sea level.
The NASA-USGS Landsat satellite images show the dramatic changes to the landscape. In one photo taken on July 26, 2025, the fjord is surrounded by green vegetation.
The shores of Tracy Arm on July 26, 2025. Image: NASA Earth Observatory images by Michala Garrison, using Landsat data from the U.S. Geological Survey.
In the second image, taken nine days after the landslide on August 19, the fjord is dominated by a gray scar made by the cascading rock.
The shores of Tracy Arm on August 19, 2025. This image was taken after the tsunami and landslide. Image: NASA Earth Observatory images by Michala Garrison, using Landsat data from the U.S. Geological Survey.Image: NASA Earth Observatory images by Michala Garrison, using Landsat data from the U.S. Geological Survey.
“The bright landslide scar on the north side of the fjord is striking, as is the ‘bathtub’ ring around the fjord showing the areas where the forest was leveled by the tsunami,” said Dan Shugar, a geomorphologist at the University of Calgary.
Sawyer Island, located about 6 miles away from the landslide, also turned from green to brown. Only a few trees still stood at the island’s higher elevations.
Over the past several months, Shugar and his colleagues combined satellite, airborne, and ground-based observations with eyewitness accounts and simulations to build a complete story with how this historic event transformed. Their analysis was published May 6 in the journal Science.
Their analysis found that water continued to slosh around the fjord for more than one day. Geologists call this water-sloshing phenomenon a seiche. Both the landslide and resulting seiche produced seismic signals that were detected around the world and equivalent to a magnitude 5.4 earthquake.
The landslide scar and the zone where vegetation was stripped by the resulting tsunami are both visible in this aerial photo of Tracy Arm and South Sawyer Glacier, captured on August 13, 2025.Image: U.S. Geological Survey/John Lyons
The Landsat images also show that the South Sawyer Glacier retreated significantly in less than a month. Typically, glacial retreat takes much longer.
“Part of that occurred between the date of the first image and the date of the landslide,” Shugar said. “But part of it is from the landslide itself, which broke off a big chunk of the terminus of South Sawyer Glacier, resulting in a slurry of icebergs in the fjord.”
Fortunately, no one was injured in the event, largely because it occurred around 5:30 a.m. local time. The wave did sweep away some gear from a group of kayakers camping on Harbor Island near the fjord’s mouth. Passengers aboard a small cruise ship in neighboring Endicott Arm also reported swings in water levels and a strong current associated with the tsunami.
In response to the event, at least six cruise lines have eliminated the Tracy Arm fjord from their itineraries for 2026 due to the hazards. The United States Geological Survey also warns that steep, mountainous landslide areas are “inherently unstable” and that the Tracy Arm fjord tsunami will likely continue to change the landscape.