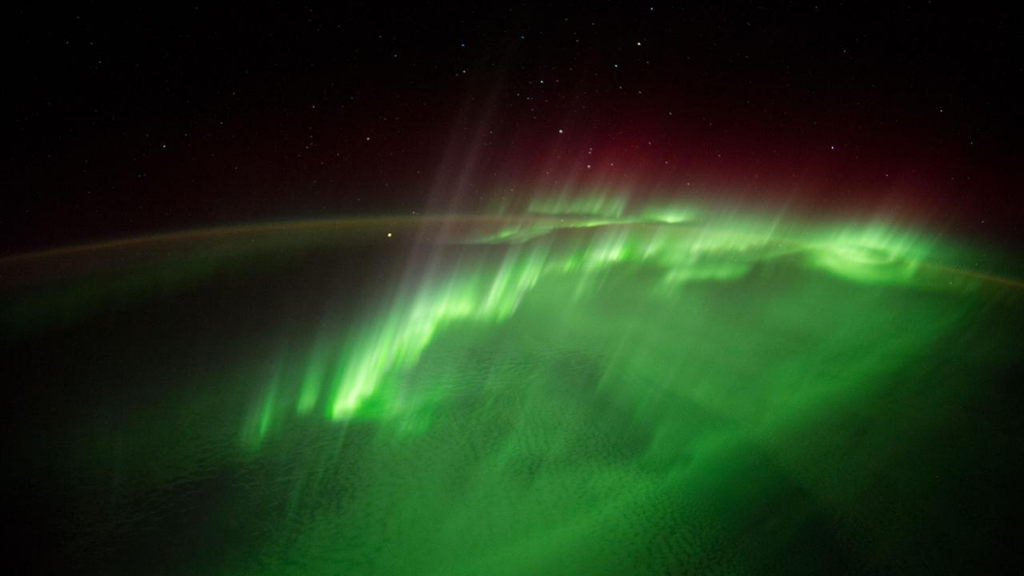
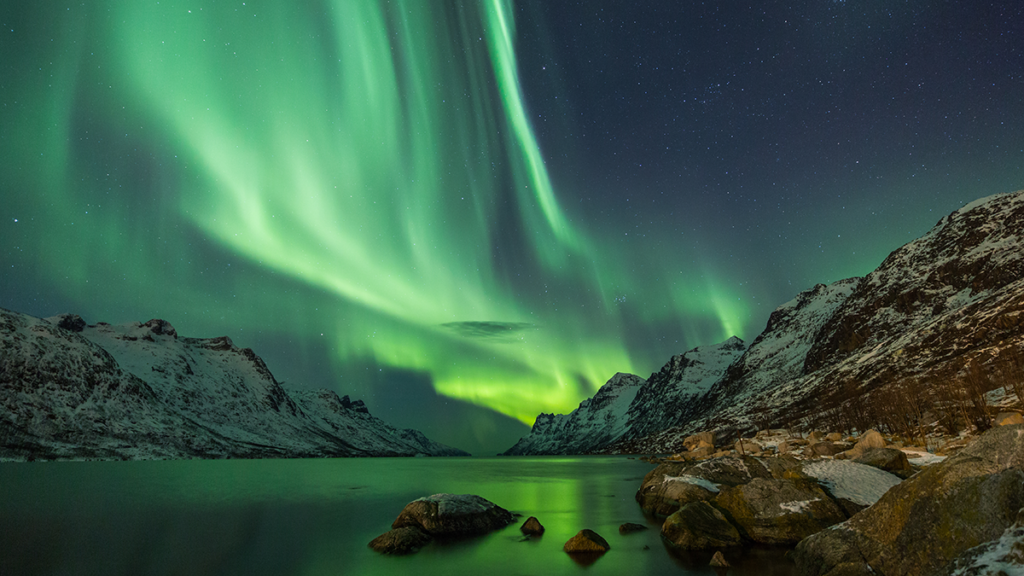
Most auroras appear in the “auroral oval” at high latitudes surrounding the magnetic poles. However, some can appear as a detached auroral arc from the auroral oval, at lower latitudes in mid-afternoon and connected to the oval only at a tip or two. Such a detached arc is believed to be linked to the “plasmaspheric plume,” the tongue-shaped extension of the plasmasphere during the recovery phase of a geomagnetic storm. (The plasmasphere is the torus-shaped region of cold, dense plasma above the low- and mid-latitude ionosphere.) The surface waves at the plume boundary cause it to ripple and modulate the various plasma waves in the plume.
Based on observations from multiple satellites and ground stations, Feng et al. [2026] find sawtooth-like undulations along the equatorward boundary of a detached auroral arc in the ultraviolet that was produced by energetic (>keV) electrons and accompanied by energetic (>10 keV) ions. The authors attribute the undulations to Electromagnetic Ion Cyclotron (EMIC) waves that are modulated by the surface waves and resonating with the energetic ions. The study unravels the fine-scale structures of detached auroral arcs and sheds important light on the dynamics underlying their formation.
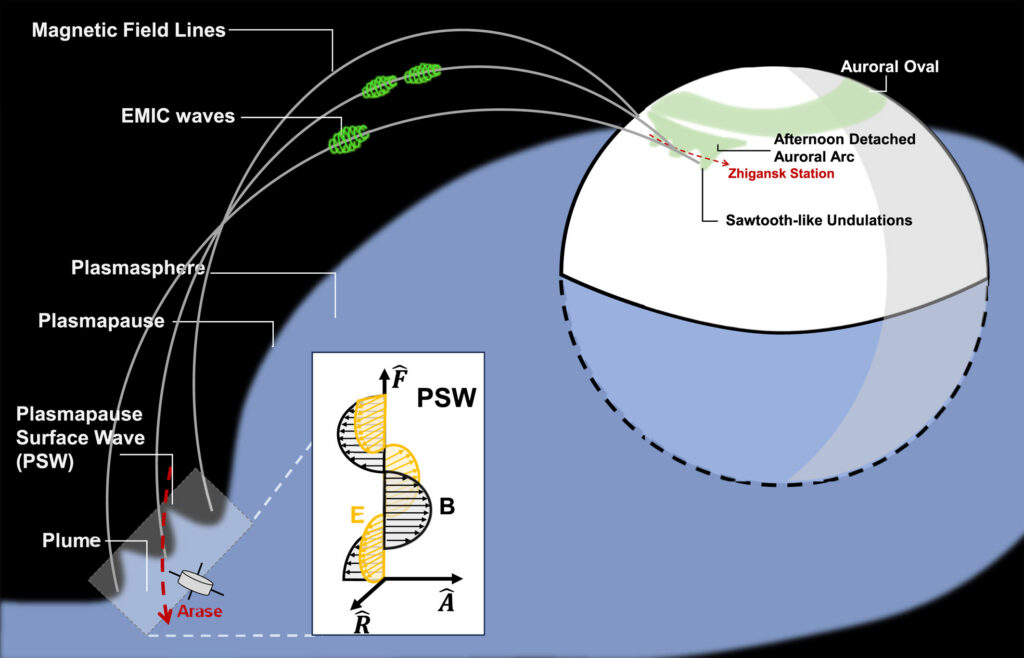
Schematic illustration of the formation mechanism for the sawtooth-like undulations of a detached auroral arc. The surface waves modulate the Electromagnetic Ion Cyclotron (EMIC) waves in the plasmaspheric plume, causing the energetic ions to precipitate into the ionosphere and resulting in the formation of an afternoon detached auroral arc with sawtooth-like undulations. Credit: Feng et al. [2026], Figure 4
Citation: Feng, H., Wang, D., Hao, Y., Miyoshi, Y., Fu, H., Jun, C.-W., et al. (2026). First observation of sawtooth-like undulations in afternoon detached auroral arcs modulated by surface waves at the plasmaspheric plume boundary. AGU Advances, 7, e2025AV002234. https://doi.org/10.1029/2025AV002234
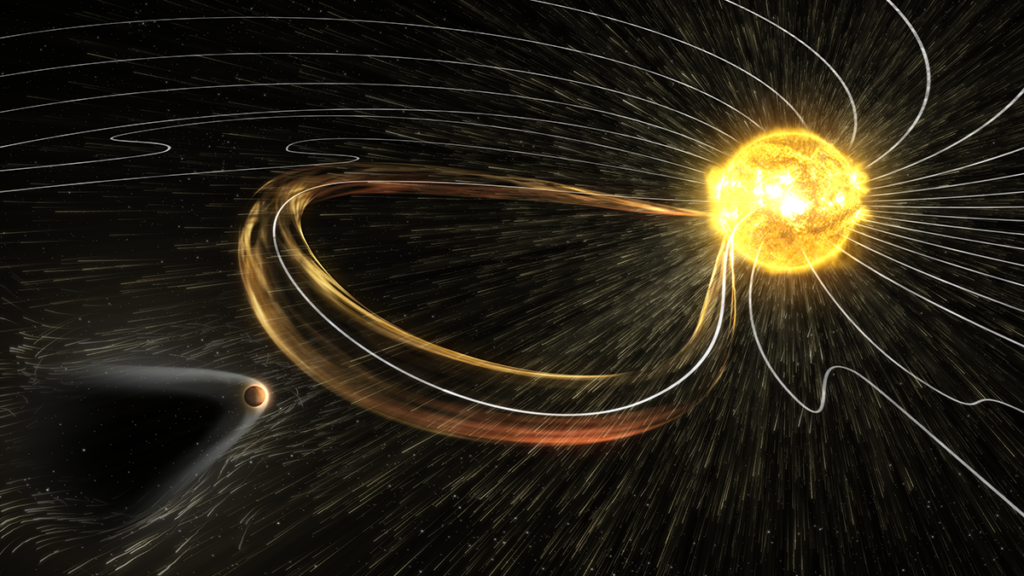
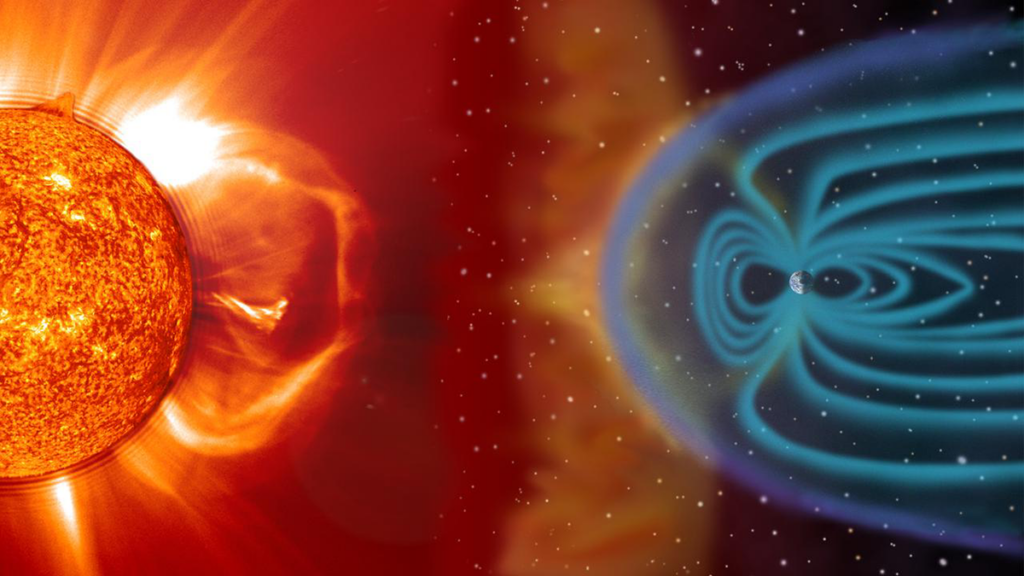
The Sun continuously blasts charged, magnetic field–carrying particles, or plasma, in all directions. This solar wind interacts with the magnetic fields and atmospheres of several of our solar system’s planets and other bodies, sculpting long magnetic tails of charged particles—magnetotails—that stretch into space behind them.
Magnetotails contain thin layers of electric current–carrying plasma sheets, which sometimes “flap” in an up-and-down waving motion. Spacecraft observations have revealed that flapping in Earth’s magnetotail can be driven by a process called magnetic reconnection, in which magnetic field lines rapidly break and then snap together in a new configuration, releasing stored energy. However, whether reconnection plays this same role beyond Earth has thus far been a mystery.
Wen et al. report the first evidence that magnetic reconnection may also trigger magnetotail flapping at Mars.
Unlike Earth, Mars lost its global magnetic field billions of years ago. But it still sports a magnetotail, thanks in large part to interactions between the solar wind and charged particles in its upper atmosphere. Strong magnetic fields embedded in certain patches of the Martian crust—remnants of its lost planet-wide field—also influence the magnetotail.
Until recently, Mars’s magnetotail could only be studied using observations from NASA’s Mars Atmosphere and Volatile Evolution (MAVEN) spacecraft. MAVEN showed that the Martian magnetotail is highly dynamic, with a structure that twists, shifts, and flaps—and from which charged particles may escape into space. But because MAVEN can observe only one part of the magnetotail at a time, it couldn’t identify what processes might trigger flapping.
Another spacecraft, China’s Tianwen-1 orbiter, has now provided a second set of eyes. The researchers analyzed simultaneous observations from the two spacecraft, finding that signatures of magnetic reconnection detected by MAVEN in the upstream part of the magnetotail tended to coincide with flapping events detected downstream by Tianwen-1.
Before or during flapping, the spacecraft also detected temporary, twisted plasma structures known as flux ropes. A similar link has previously been observed on Earth, and it suggests that flux ropes generated by magnetic reconnection upstream might propagate downstream, driving instabilities in the magnetotail’s plasma sheets and triggering flapping.
Though more research is needed to confirm these findings, they shed new light on how energy moves and is released in space around Mars—and possibly other planets and celestial objects. (AGU Advances, https://doi.org/10.1029/2026AV002343, 2026)
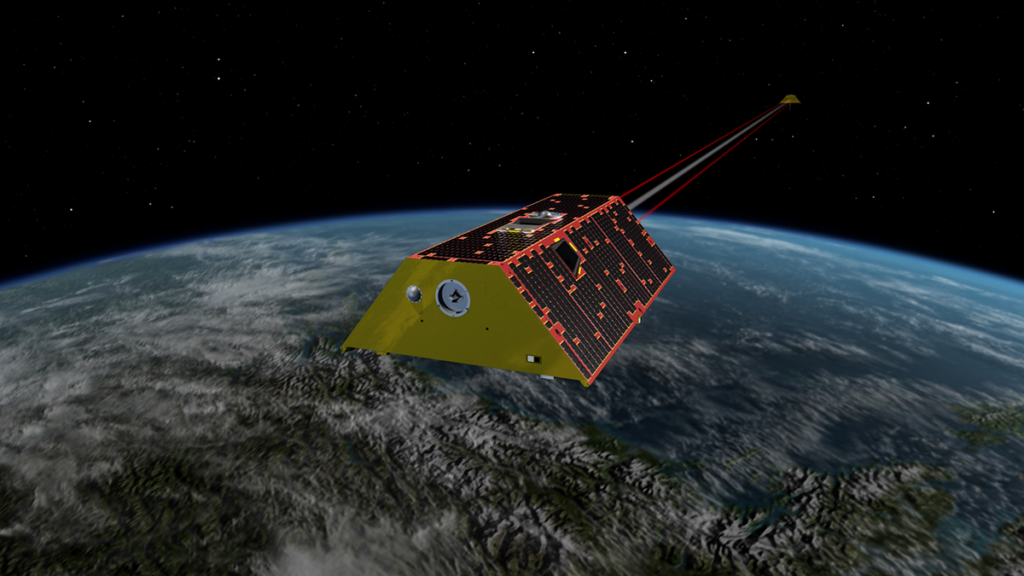
In low Earth orbit (typically below about 700 kilometers altitude), atmospheric drag is the primary source of uncertainty when predicting the trajectories of satellites. These prediction errors largely arise from limitations and inaccuracies in the models used to estimate the density of the upper atmosphere, particularly within the thermosphere.
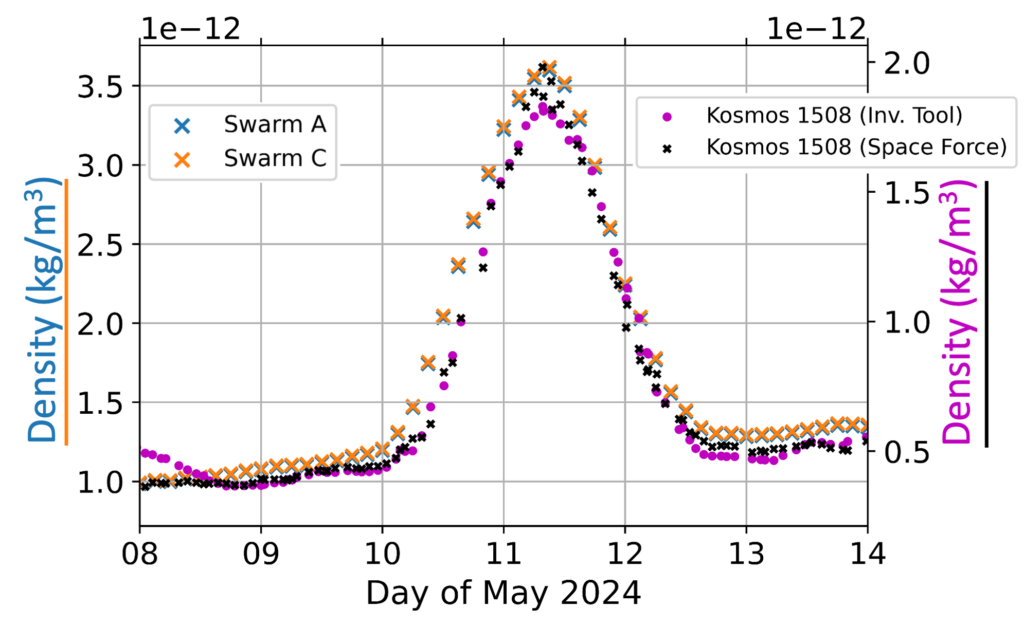
Mutschler et al. [2026] introduce a new method for estimating atmospheric density along the path of an individual satellite by using Energy Dissipation Rates (EDRs). The derived single-satellite density measurements provide valuable insight into variations in thermospheric density and can help characterize how the upper atmosphere responds to disturbances such as geomagnetic storms. Incorporating these observations can contribute to ultimately improving the accuracy of satellite orbit predictions.
Effective density and Space Force effective density estimated by the Kosmos 1508 satellite (plotted on the right-hand y axes) compared to estimates from satellites Swarm-A and Swarm-C (plotted on the left-hand y-axes). Credit: Mutschler et al. [2026], Figure 17a
Citation: Mutschler, S., Pilinski, M., Zesta, E., Oliveira, D. M., Delano, K., Garcia-Sage, K., & Tobiska, W. K. (2026). First results of a new inversion tool for thermospheric neutral mass density computations during severe geomagnetic storms. AGU Advances, 7, e2025AV002079. https://doi.org/10.1029/2025AV002079
Models of glacial flow and retreat rely on estimates of glacial ice viscosity, the measure of the ice’s resistance to flow.
Ice viscosity is dependent on the stress applied to the glacier. Most ice sheet models use a standard equation to model ice flow that includes the variable n, called the stress exponent. A larger value of n means ice viscosity is more sensitive to changes in stress. For decades, glaciologists have, almost exclusively, used an assumed n value of 3 in the models they use to predict ice flow.
However, through recent experiments and observations, researchers have found that an n value of 4 may actually better represent the conditions of Earth’s ice sheets and glaciers.
Martin et al. created a model representation of the fast-retreating Pine Island Glacier in West Antarctica. The ice sheet in their model had a true n value of 4, but they ran model projections using both n = 4 and n = 3. That allowed them to observe how their model would incorrectly predict glacial flow and resulting sea level change, given an incorrect n value.
The researchers modeled glacial retreat for 100 years under both equations with two different glacial melting scenarios. They then modeled glacial recovery for another 300 years. Under a moderate scenario, the n = 3 model underestimated glacial retreat by 18% and sea level change contributions by 21%. Under an extreme melting scenario, the model underestimated sea level contributions by 35%.
Notably, those disparities in glacial retreat and sea level change contribution predictions increased more than would be expected between the two scenarios, potentially increasing the level of uncertainty in current projections of sea level change. The researchers also suggest that incorrect n values may be mistakenly attributed to other physical processes in current ice sheet models.
The results could have far-reaching implications for predictions of future glacial melt and may prompt investigations into its effects on sea level, the authors say. (AGU Advances, https://doi.org/10.1029/2025AV001946, 2026)
—Madeline Reinsel, Science Writer
Citation: Reinsel, M. (2026), Glaciers may flow into the ocean more quickly than we think, Eos, 107, https://doi.org/10.1029/2026EO260107. Published on 14 April 2026.
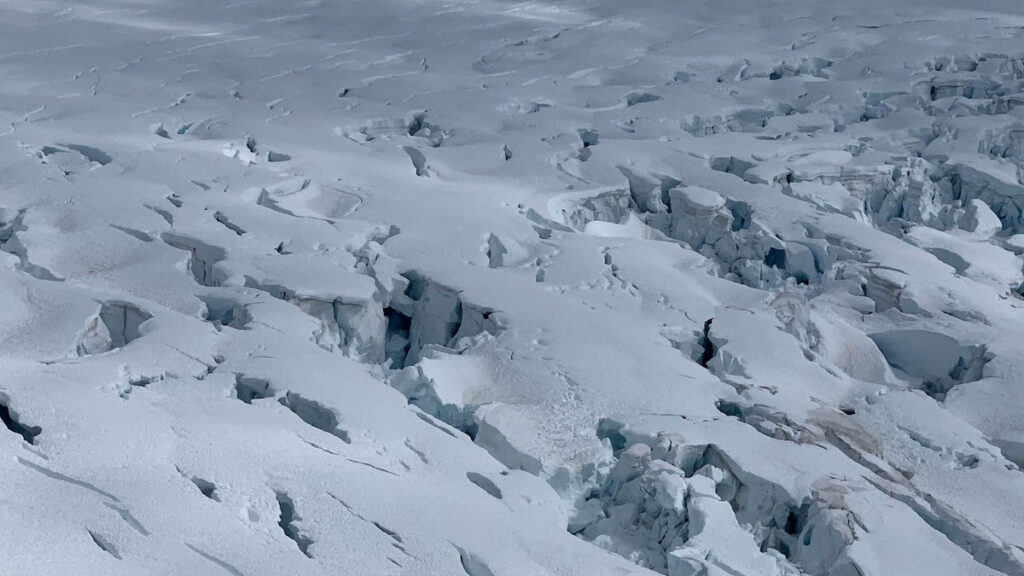
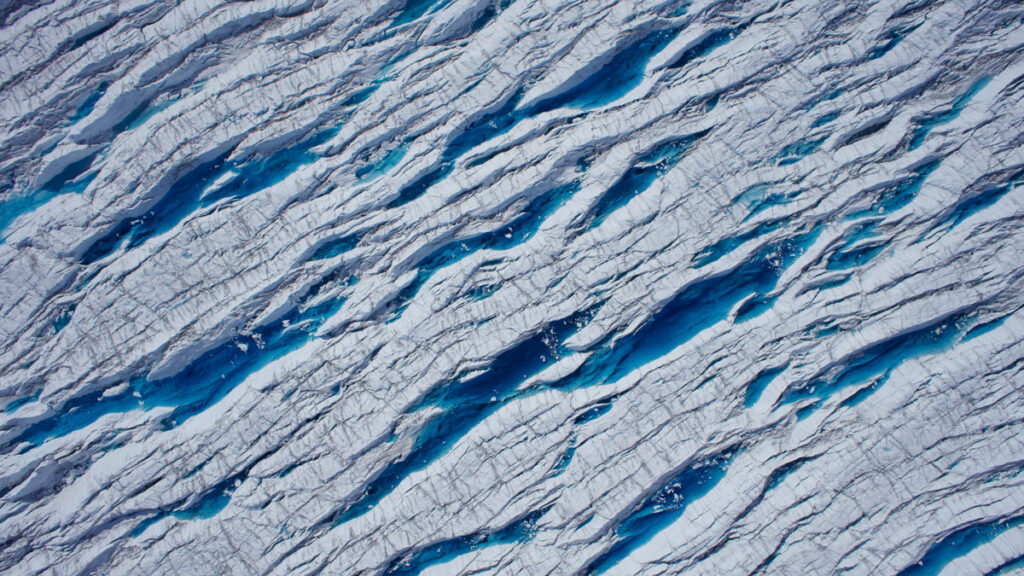
As meltwater drains through and beneath a glacier, it can alter how the ice flows and whether it breaks apart. Meltwater can also cause feedbacks that lead to more ice loss. Understanding when and how glacial meltwater drains is therefore critical to predicting how fast glaciers will lose ice and how that loss will affect sea level.
Chudleyet al. modeled how the rate of water flowing into a glacier relates to seasonal changes in the forces that squeeze and stretch ice—forces caused by gravity pulling the glacier downhill, by the ice sliding over subglacial water, and by how portions of the ice interact with the ocean.
The researchers focused on the Sermeq Kujalleq glacier (also known as Store Gletsjer or Store Glacier) in Greenland. In spring, meltwater can fill cracks, or crevasses, that run through the surface of this glacier. These crevasses sometimes go on to drain as the year progresses.
The researchers used satellite imagery from the Sentinel-2 mission to see how much water was present in crevasses between 2016 and 2022, focusing especially on 2019, when the Sentinel-2 satellites provided the best coverage of the glacier. They fed those data into a convolutional neural network to map water cover through the season and looked for a relationship between the mechanical forces acting on the ice and the formation and drainage of crevasse ponds.
The researchers found that the mechanical forces acting on ice are the dominant factor in determining when crevasse meltwater drains into a glacier. When seasonal changes cause ice to stretch, crevasses can drain suddenly, releasing the water they held.
The Greenland Ice Sheet sheds trillions of gallons of water each year, and knowing when to expect that water to drain through the ice sheet is key to understanding processes such as how the glacier slides across the bed and when meltwater emerges in the ocean. The study’s results likely also shed light on dynamic processes in other glaciers and ice sheets, the authors say, and should help inform representations of ice behavior in numerical models. (AGU Advances, https://doi.org/10.1029/2025AV002150, 2026)
Citation: Sidik, S. M. (2026), Stretching and squeezing release glacial meltwater, Eos, 107, https://doi.org/10.1029/2026EO260152. Published on 26 May 2026.
AGU Advances is excited to announce the journal’s inaugural Early Career Editorial Board! The editors of AGU Advances have selected three early career researchers to join the Early Career Editorial Fellow program:
Huilin Huang
University of Virginia
Yihe Huang
University of Michigan
Danielle Monteverde Potocek
Spark Climate Solutions
They will serve as Associate Editors from January 2026 to December 2027, under the leadership of the mentoring editors: David Schimel (Jet Propulsion Laboratory), Thorsten Becker (The University of Texas at Austin, Jackson School of Geoscience), and Eric Davidson (University of Maryland Center for Environmental Science), respectively. AGU Advances is excited to join AGU journals GeoHealth and JGR: Biogeosciences (Xenopoulos, M. A., and T. H. Nguyen, 2024) in launching an Early Career Editorial Fellow program and grateful to our exceptional Early Career Fellows for volunteering their time in service of scientific publishing. This mentorship program, designed to offer a hands-on approach for researchers interested in editorial roles, will support the next generation of researchers and journal editors and lead to stronger futures for our journals and scientific community.
The Early Career Fellows will work one-on-one with a current AGU Advances Editor.
The Early Career Fellows will work one-on-one with a current AGU Advances Editor to learn about the steps of the editorial process, the ethics of reviewing, and what goes into making a decision on a manuscript. They will also learn about the more challenging elements of the editorial process, such as securing reviewers, addressing conflicting reviews, addressing author and/or reviewer concerns.
As the scientific world, and the world at large, change and shift, so too does the world of academic publishing and the needs of future researchers. By working with these Early Career Fellows, we will gain invaluable insight on how to keep our publications at the forefront for the Earth and space sciences.
Below, we asked the Early Career Fellows about their research interests and what they are excited about as they step into this new role (responses edited for length and clarity):
What is your current role and area of research?
Danie: “My areas of research include: biogeochemistry, geobiology, climate science, and global environmental change. “
Huilin: “My area of research is land-atmosphere interaction especially biosphere-atmosphere interaction and climate modeling.”
Yihe: “My group studies the physical mechanisms of earthquakes and faulting processes using both observational methods (e.g., seismic data analysis) and numerical tools (e.g., earthquake rupture simulation). We’re particularly interested in how fluid, fault zone structure, and fault geometry can affect the nucleation, propagation and arrest of earthquakes and how earthquakes contribute to the strain budget and structural evolution of fault zones and plate boundaries. We also have a broad interest in developing physical tools for seismic hazard mitigation and bridging earthquake science and engineering applications.”
Do you have prior experience as a journal editor?
Danie: “This is my first experience in an editorial role.”
Yihe: “Yes, I’ve been an Associate Editor for JGR: Solid Earth since 2020, and I’ve been an editor for Earth, Planets and Space since last year.”
What interested you in joining the AGU Advances editorial board?
Danie: “I was eager to learn more about the publishing process from the editorial perspective, engage with fellow editors, and contribute to supporting the scientific community. I was also particularly drawn to the structure of the Early Career Board, which offers the opportunity to be mentored by a senior editor and develop editorial expertise before handling manuscripts independently. “
Huilin: “I am drawn to AGU Advances because it prioritizes high-impact studies that fundamentally shift our understanding.”
Yihe: “I’m interested in getting a broader perspective about how an editorial board works, especially for a cross-disciplinary high-impact journal like AGU Advances.”
What would you like to see next from AGU Advances or the AGU journals as a whole?
Danie: “AGU Advances already has a strong focus and track record of publishing research with global relevance and impact. I am excited to support this mission and would also like to see continued expansion of the author base to include more diverse geographies (particularly Asia and Global South) as well as a broader range of career stages.
I would also welcome AGU journals to continue their outreach and engagement with the community that balances traditional hypothesis-driven research with action-oriented perspectives addressing urgent scientific and societal challenges especially considering the rapidly shifting landscape of scientific research.”
Huilin: “I am particularly interested in seeing the conversation toward the use of new technolog[ies] (like AI/ML or new satellite, new models) to advanc[ing] process-level understanding.”
Yihe: “I would like to see editors’ perspectives on how AGU Advances distinguishes itself from other high-impact journals. I would also like to learn how we can advertise and communicate the advantages of publishing in AGU Advances through different avenues.”
We are so appreciative of our volunteer Editors, David Schimel, Thorsten Becker, and Eric Davidson, who will be mentoring our new Early Career Fellows. Here, we asked them what they are looking forward to most about the program:
What outcomes for AGU Advances do you hope to see from the Early Career Board?
Dave: “ECRs provide a fresh view and are often much closer to the methods and science in papers we receive. An ECR and a Board editor have a great combination, experience, perspective and familiarity up close with the work and the community.”
Eric: “The associate editors become interested in being full editors and are well prepared. At a minimum, they have an experience that makes them better authors and reviewers because of the perspective they’ve gained as associate editors.
Why did you decide to become a mentoring editor?
Editing scientific papers can be a true joy of learning and discovery.
Thorsten Becker
Thorsten: “We value a diversity of perspectives and background when assessing contributions during initial and formal review, and it will be terrific to benefit from Yihe’s expertise. Editing scientific papers can be a true joy of learning and discovery, and we think this position will be a great pathway to take on a larger role in this community process while having a somewhat reduced workload and being able to participate in an exchange about best practices and a mentoring system that can hopefully facilitate sharing best practices and insights gained from prolonged work in an editorial role.”
Dave: “Oh, man, when I started as a peer reviewer and then a guest editor, followed by being a member of a board, each step was sink or swim! I am happy to share a few lessons learned but also expect to learn a lot from my ECR’s view from the cutting edge. I think we’ll have fun learning from each other.”
What advice would you give to early career researchers interested in becoming journal editors?
Seeing publishing from the other side is really important for maturing scientists!
David Schimel
Dave: “Being an editor is an amazing way to broader your knowledge and network, but being an editor is serious work, is a paper going to advance science, or, with appropriate guidance could it advance science? Does it build on the literature or ignore relevant work? Accepting/rejecting papers has huge career impact on authors but we have to keep in mind we review papers to advance science, not to play career games, while recognizing publications have become very much about careers with all manner of distorted and perverse incentives. Seeing publishing from the other side is really important for maturing scientists! Also, you learn that ten extra minutes to explain a decision to an author can change a life! I’ve learned a HUGE amount from the peer reviewers and editors of my own papers!”
Eric: “Accept invitations to review manuscripts. Let an editor or EiC know of your interest. Make sure you have the time to do this.”
Citation: Schuette, A., A. Montanari, H. Huang, Y. Huang, D. Monteverde Potocek, T. Becker, E. Davidson, D. Schimel, K. Vrouwenvelder, and S. Dedej (2026), Announcing the inaugural AGU AdvancesEarly Career Editorial Fellows, Eos, 107, https://doi.org/10.1029/2026EO265018. Published on 5 May 2026.
This article does not represent the opinion of AGU, Eos, or any of its affiliates. It is solely the opinion of the author(s).
Solar eruptions can trigger geomagnetic storms that disrupt satellites, GPS, and power grids, affecting daily activities and technology. Therefore, it is extremely important to understand these storms in order to mitigate their impact. Previous studies mainly focused on interplanetary conditions.
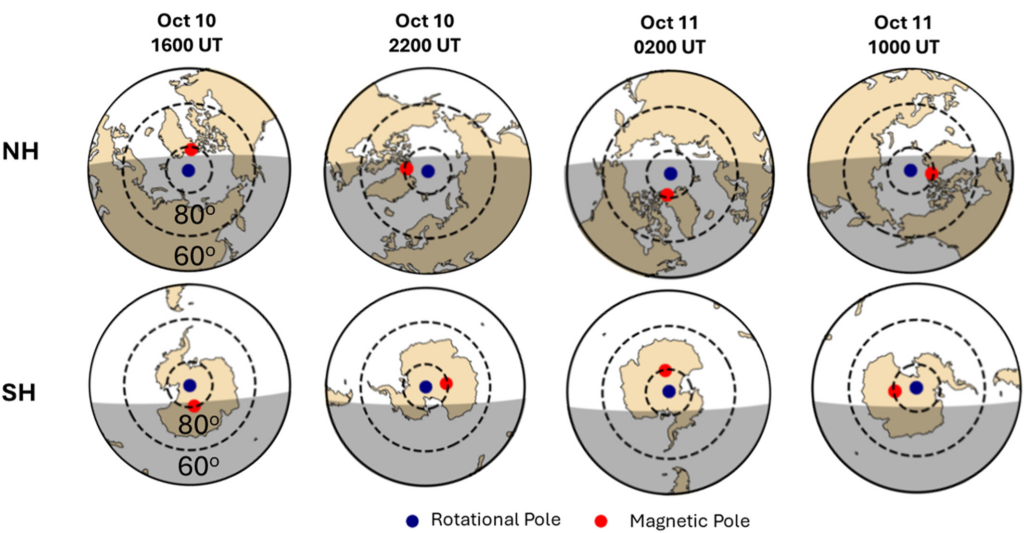
Ghag et al. [2026] investigate the interaction between solar ultraviolet light (EUV) during storms and the Earth magnetic field, taking into account its misalignment and offset with respect to the Earth’s rotational axis, which depend on time. Such misalignment and offset induce variations in EUV exposure in turn influencing the ionosphere and its interaction with the magnetosphere.
The study applies the Multiscale Atmosphere-Geospace Environment (MAGE), a physics based fully coupled whole geospace model. The causal relationship between storm timing and storm effect is explored revealing insights on our capability to predict storm impact based on the time dependent Earth system state.
The rotation of the magnetic pole around the rotational pole in the NH and SH. The location of the rotational pole is denoted in blue and the magnetic pole in red. Credit: Ghag et al. [2026], Figure 6c
Citation: Ghag, K., Lotko, W., Pham, K., Lin, D., Merkin, V., Raghav, A., & Wiltberger, M. (2026). Universal time influence on stormtime magnetosphere ionosphere coupling. AGU Advances, 7, e2025AV002071. https://doi.org/10.1029/2025AV002071
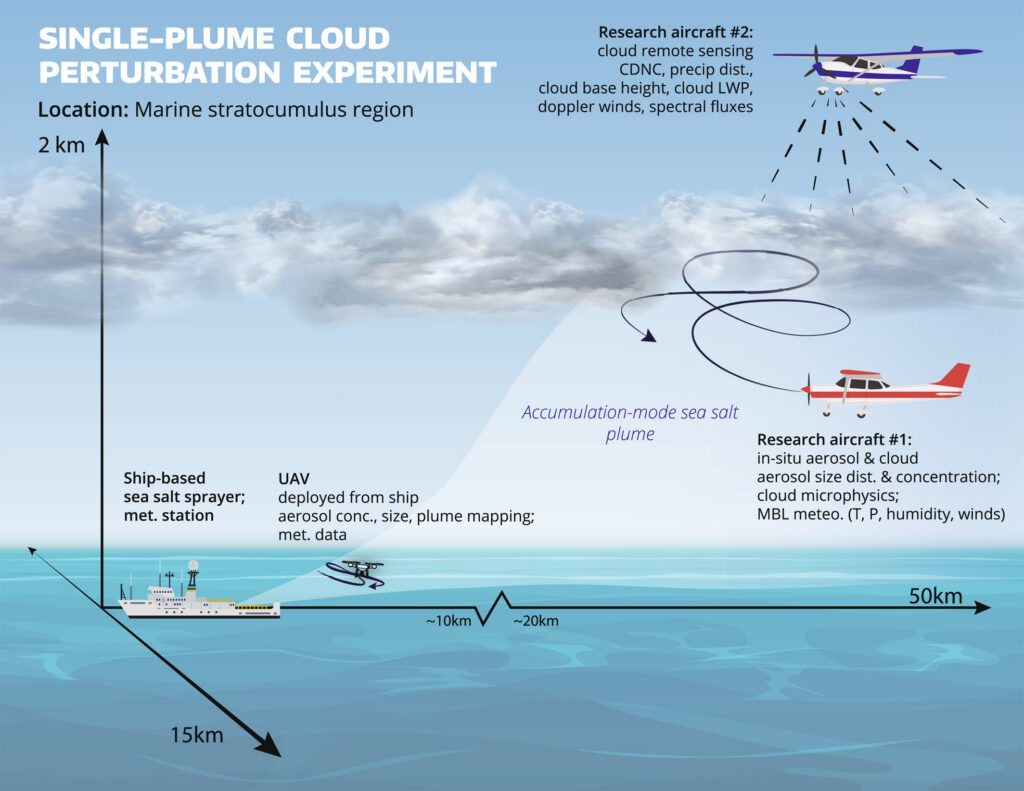
The albedo change of marine clouds is achieved by targeted additions of aerosols, and in particular, sea salt. To assess the viability of Marine Cloud Brightening (MCB) requires a fundamental understanding of the impact of aerosols on cloud evolution and properties, and on the cloud environment.
Doherty et al. [2026] propose a framework for studying MCB across scales. This includes small- to large-scale studies aimed at systematically characterizing the life-cycle of aerosols and the diurnal cycle of cloud processes, how these change with the magnitude, duration and type of aerosol applied, and monitoring potential harmful direct or indirect consequences of aerosol injection, such as regional changes in temperature or precipitation.
Possible configuration for a Stage III study for measuring local scale cloud responses to a single plume of generated sea salt aerosol sized for marine cloud brightening. Credit: Doherty et al. [2026], Figure 4
Citation: Doherty, S. J., Diamond, M. S., Wood, R., & Hirasawa, H. (2026). Defining scales of field studies and experiments to assess marine cloud brightening. AGU Advances,7, e2025AV001939. https://doi.org/10.1029/2025AV001939
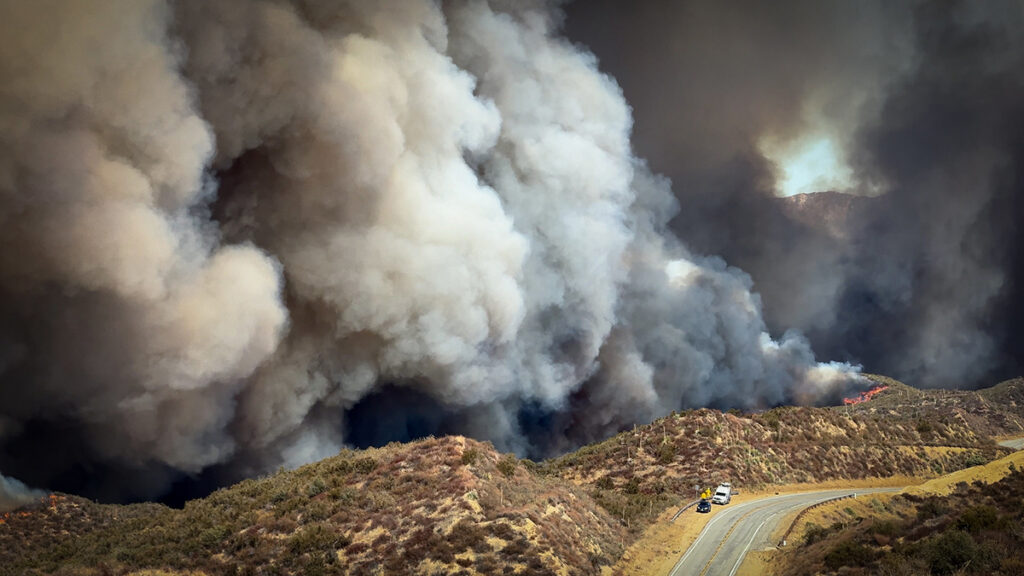
Urbanization, climate change, and fire suppression practices are contributing to increased wildfire risk at the densely populated wildland-urban interface. These factors make fires more unpredictable and harder to manage. In January 2025, this was made devastatingly clear in Los Angeles, when massive wildfires engulfed entire hillsides and canyons, destroying neighborhoods and damaging surrounding ecosystems.
The Mediterranean climate region of California, which stretches up most of the state’s coastline, is a naturally fire-prone landscape because its dry conditions support vegetation growth and also allow for fire to spread easily. As wildfires become more intense, better modeling and understanding of their drivers is crucial in efforts to predict risk.
Ward-Baranyay et al. looked at three of the January 2025 Los Angeles wildfires by analyzing preburn conditions, such as fuel characteristics, topography (including elevation and slope), and wind speed. Satellite observations gathered from the Ecosystem Spaceborne Thermal Radiometer Experiment on Space Station (ECOSTRESS) and the Earth Surface Mineral Dust Source Investigation (EMIT)—precursors to a recently announced NASA mission, the Explorer for Artemis Geology Lunar and Earth (EAGLE)—provided detailed information about the vegetation’s condition before the fires began. The researchers then built a random forest regression model to predict burn severity based on these conditions, ultimately demonstrating that prefire fuel conditions were a key driver of the destructive wildfires’ immediate effects on wildlands.
The model used in the study was able to accurately capture about 60% of the patterns in burn severity. It was most accurate for the Palisades and Hughes fires, but less accurate for the Eaton Fire. This discrepancy could be because the area burned by the Eaton Fire was more topographically variable, meaning its burn severity drivers may not have been fully captured by the model, the researchers suggest. Vegetation type was also a strong performance indicator: Terrain with shrub or scrub cover, the dominant vegetation type, offered the most accurate predictions for burn severity. The burn patterns of forests and other landscape types were less accurately captured.
Fuel conditions emerged as the dominant driver of burn severity, more so than topography or weather. In particular, how abundant, wet, dry, or stressed vegetation is can hint at how severe future fires may be. Tracking and monitoring these fuel conditions, researchers suggest, may be a way to monitor wildfire hazard in California and other fire-prone regions. (AGU Advances, https://doi.org/10.1029/2025AV002179, 2026)
Citation: Owen, R. (2026), Want to predict wildfire severity? Look to the state of vegetation, Eos, 107, https://doi.org/10.1029/2026EO260130. Published on 4 May 2026.
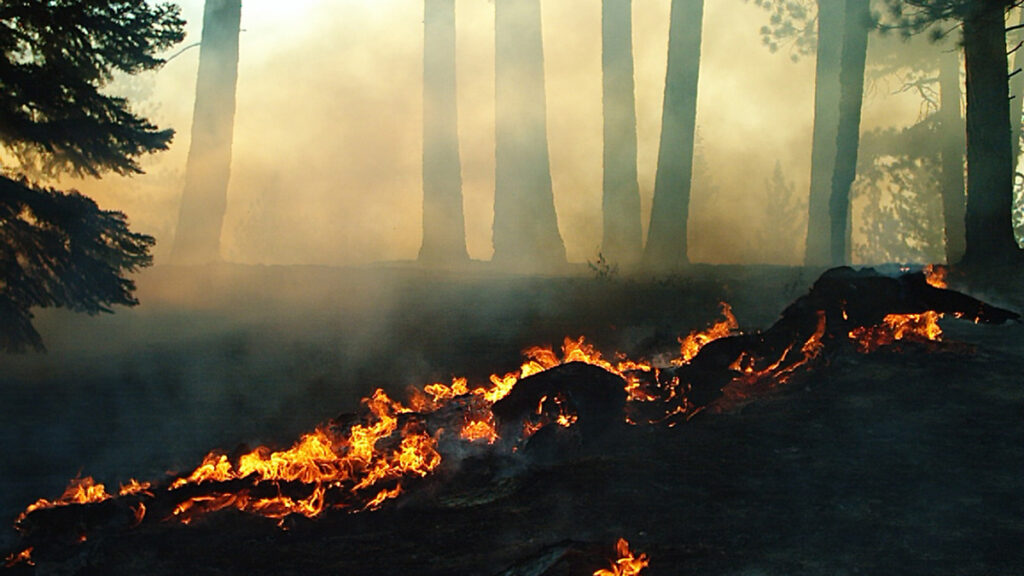
Across the western United States, wildfires are increasing in size and intensity. As the climate continues to warm, more extreme wildfires will reshape landscapes and pose a growing risk to human health and natural ecosystems throughout the West.
Climate models, used to predict other effects of climate change, are unable to directly simulate wildfires. Instead, researchers link previously burned areas to climate variables such as temperature, precipitation, drought, and evaporation, then apply those relationships to future climate projections.
Many recent studies have connected higher vapor pressure deficit (VPD)—a measure of atmospheric dryness—to more area burned in previous fires. VPD increases as the temperature rises, so models that rely on it generally predict an increase in wildfire activity as the climate warms.
Cheng et al. raise questions about the role VPD plays in modeling wildfire, suggesting that VPD is a poor measure of fuel dryness at larger scales and overestimates potential burned areas under significant warming conditions. Instead, researchers suggest soil moisture could be a more reliable indicator of fuel dryness and lead to more moderate projections of wildfire increases.
The researchers looked at five forested ecoregions in the western states. Using the Western US MTBS-Interagency wildfire dataset from 1984 to 2020 combined with climate data (temperature, VPD, and soil moisture), the researchers analyzed drivers of the area burned from May through October. They connected this information with output from climate models to look at future burn potential.
VPD-based wildfire predictions increase sharply under warming conditions. These predictions showed that under 3°C of average global warming, 16 times as much land would burn by the end of the century, compared to historical levels. Under 4°C of warming, up to 66 times more land would burn by the end of the century. This “truly massive” increase, the authors say, would mean fires consuming vegetation almost as soon as it regrows.
Soil moisture, on the other hand, provides a more moderate, though still concerning, picture. Under the same warming scenarios, soil moisture changes would lead to an increase in burned area of only 2–3 times that of the historical period. The researchers argue that projections relying on VPD severely exaggerate wildfire risk. (AGU Advances, https://doi.org/10.1029/2026AV002350, 2026)
Citation: Owen, R. (2026), How much will western wildfires worsen under warming?, Eos, 107, https://doi.org/10.1029/2026EO260147. Published on 15 May 2026.
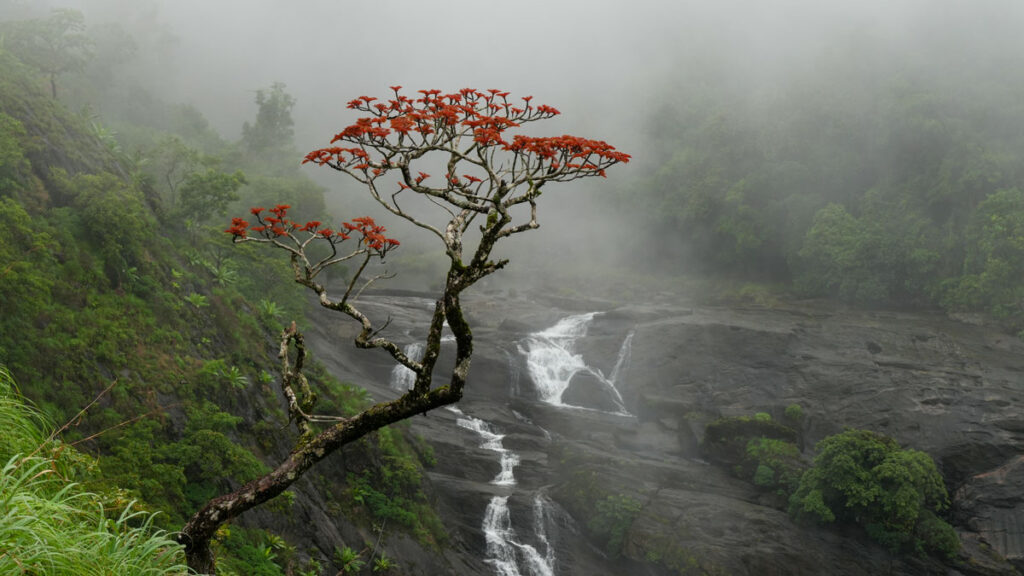
The Indian monsoon has shifted over the past quarter century. Northwest India now receives substantially more rain than it once did, while a lack of rain sends the Indo-Gangetic Plain toward drought.
More than a billion people rely on the monsoon to confer economic stability across southern Asia; further changes to this weather system could lead to widespread hardship. Scientists have struggled to predict how this weather pattern will change moving forward because commonly used climate models fail to capture changes to the monsoon that have already occurred.
Mahendra et al. suggest that models do not adequately represent either changes in the temperature of the Atlantic Ocean or how those temperature changes are linked to weather patterns around the rest of the globe. As a result, the coupled models tend to fail to predict this monsoon shift.
Specifically, current climate models lack the ability to incorporate information about the cold blob, a patch of cold water off the south of Greenland. When the researchers added the cold blob to climate model results, they found that it can alter the jet stream in a way that makes it pull moisture toward northwest India while also preventing storm systems from forming elsewhere. This is exactly the type of shift that has been observed in monsoon patterns. When a large-scale wind pattern prevents the formation of smaller-scale weather patterns in this way, it is called a barotropic governor mechanism.
This barotropic governor mechanism also explains why midlatitudes around the globe have observed more storm activity in recent years. The results highlight the importance of connecting processes from disparate parts of the globe when formulating climate models, the authors write. (AGU Advances, https://doi.org/10.1029/2025AV002173, 2026)
Citation: Sidik, S. M. (2026), The surprising link between a cold blob and the Indian monsoon, Eos, 107, https://doi.org/10.1029/2026EO260177. Published on 1 June 2026.
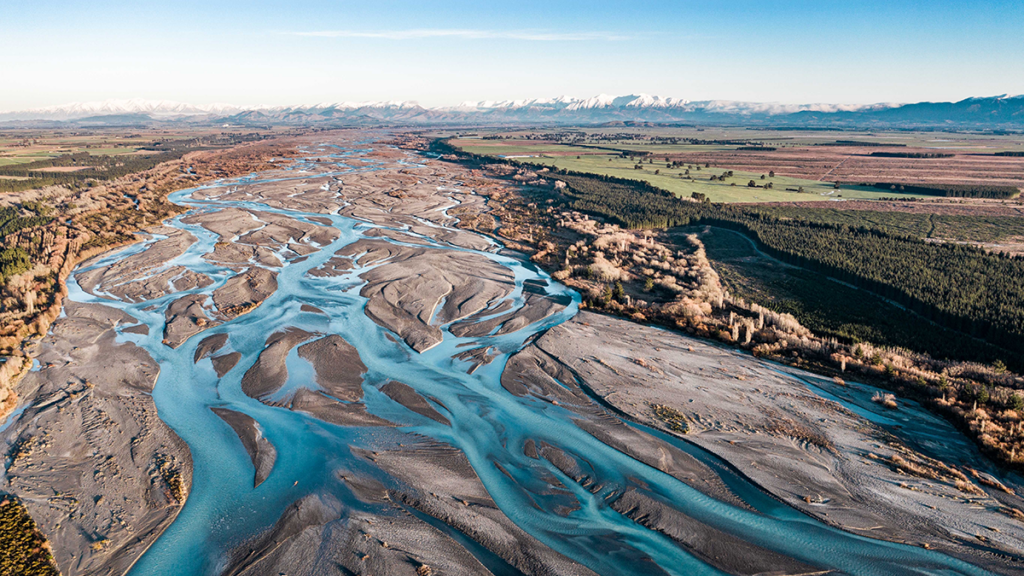
The evolution of rivers that split into multiple channels is a scientific challenge in terms of modeling and prediction. On the other hand, these rivers are widespread and play a key role for ecosystems’ life, groundwater recharge, and therefore, water security. They are also extremely sensitive to hydroclimatic changes, leading to shifts in precipitation, erosion and sediment transport.
Zhao et al. [2026] investigate the drivers of river evolution for 97 multithread river reaches worldwide, spanning diverse climates and morphologies. The study reveals the key role of intermittency for river evolution. In particular, higher flow intermittency could lead to more even flow partitioning among threads, therefore impacting hydrology and ecosystems. With flow variability increasing after climate change, rivers are likely to increase their thread count, thus impacting livelihoods and ecosystems.
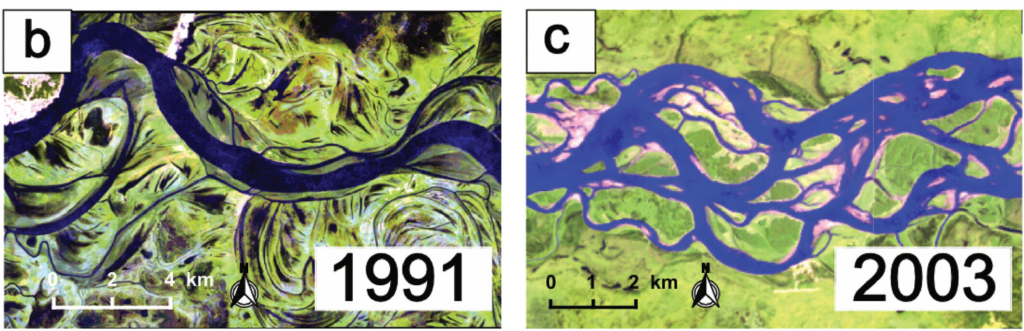
Two example multithread reaches shown in Landsat images from (b) the Irtysh River (wandering) and (c) the Yukon River (braided). Credit: Zhao et al. [2026], Figure 1(b,c)
Citation: Zhao, F., Ganti, V., Chadwick, A., Greenberg, E., McLeod, J., Liu, Y., et al. (2026). Global hydroclimatic controls on multithread River dynamics. AGU Advances, 7, e2025AV002166. https://doi.org/10.1029/2025AV002166