Following the successful ten-year run of the Ontario Reptile and Amphibian Atlas, Ontario Nature developed a Long-Term Monitoring Protocol (LTMP) to fill important knowledge gaps about Ontario’s common and at-risk snakes. Since 2019, we’ve expanded the LTMP from nine monitoring locations to over 60 sites across the province! We recently published a Story Map where you can learn all about this project and how to get involved.
The Long-Term Monitoring Protocol (LTMP)
Ontario Nature’s Long-Term Monitoring Protocol (LTMP) for snakes was launched in 2019. It uses standardized survey methods across a large geographic area to help improve our understanding of snake populations, detect changes over time, and guide conservation efforts. The LTMP brings together First Nations, scientists, landowners and volunteers to monitor snakes across the province, using plywood boards placed within snake habitat.
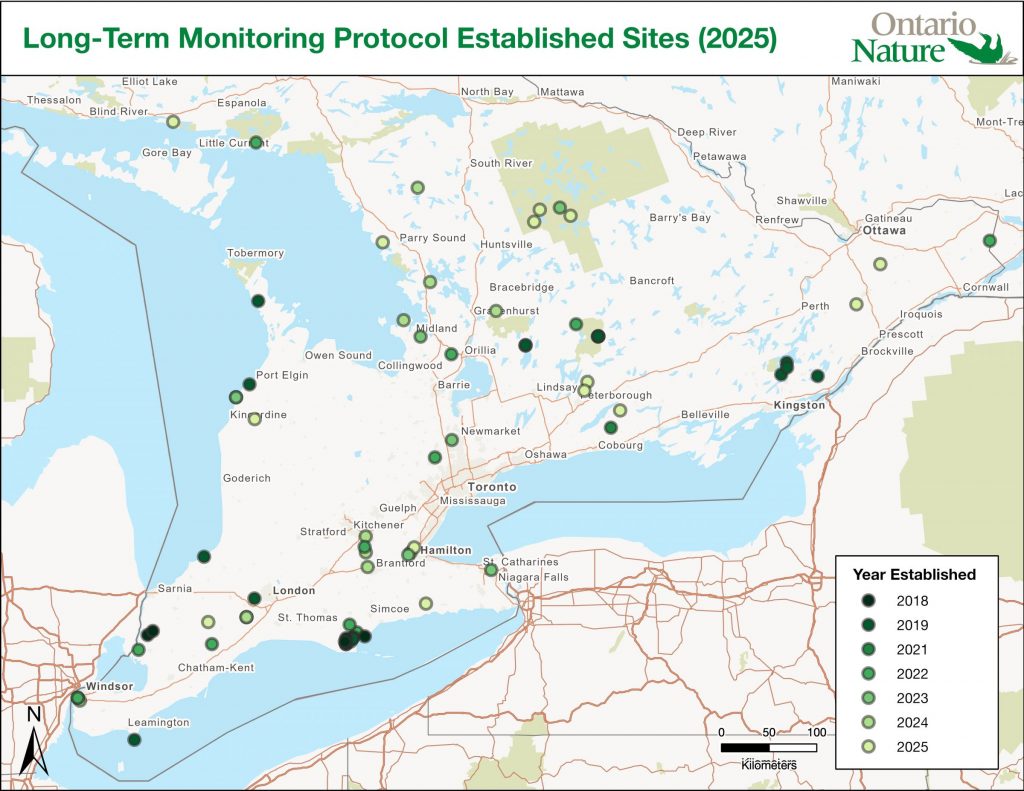
Sites conducting snake surveys using the Long-Term Monitoring Protocol. Sites in darker green have been part of the project for longer; sites in lighter green have joined the project more recently.
Help us monitor snakes!
You can participate in snake surveys as a volunteer or set up a new snake monitoring site! Many of the existing sites are monitored by volunteers and may be looking for more people to help with surveys. If you have access to land with suitable snake habitat, you could set up your own site with plywood boards, survey for snakes, and contribute data to our province-wide database.
In late 2025, astronomers spotted an interstellar comet making a quick trip through the solar system. 3I/ATLAS was discovered in July when it was just inside Jupiter’s orbit. It’s now about halfway between Jupiter and Saturn and getting farther away every day.
The European Space Agency’s Jupiter Icy Moons Explorer (ESA JUICE) mission, on its way to Jupiter, imaged 3I/ATLAS on 5 November 2025 when the comet was 64 million kilometers from the spacecraft. Credit: ESA/Juice/JANUS, CC BY-SA 3.0 IGO
Astronomers have been observing 3I/ATLAS throughout its journey inward toward the Sun and back out again, compiling the most comprehensive and detailed view thus far of an interstellar object, including the chemistry of the gases that sublimated from its surface and formed its coma and tail.
In a first-of-its-kind observation of an interstellar object (ISO), researchers have discovered that the ratio of deuterium to hydrogen in 3I/ATLAS’s outgassed water is 30–40 times higher than in solar system objects. That suggests that the comet formed in a much colder environment than our own solar system did.
“It is always hard to really pinpoint where these objects form,” said Luis E. Salazar Manzano, the lead researcher on these observations and a doctoral student at the University of Michigan in Ann Arbor. “We know that they were formed in different parts of the galaxy, but it’s hard to connect what we measure with how they were formed. These types of measurements, such as the relative abundance of deuterium to hydrogen in water, are one of the best ways we have to actually [learn] about their forming conditions and their evolution.”
Coming In from the Cold
Water appears to be ubiquitous throughout the universe, sprinkled within distant galaxies and in star-forming nebulae. But there are different flavors of water: heavy, semiheavy, and plain old H2O. In the molecular clouds where stars form, the cold environment favors a chemical reaction that increases the amount of gaseous deuterium (D), an isotope of hydrogen, relative to regular hydrogen atoms. That deuterium then bonds with hydrogen and oxygen atoms to create semiheavy water, or HDO.
By measuring the quantity of semiheavy water relative to regular water in an object, scientists can infer the object’s ratio of deuterium to hydrogen, or D/H, and decode the physical conditions in which that water formed. Astronomers have made such measurements for baby stars, planet-forming disks, solar system comets, and meteorites, as well as Earth’s ocean.
“What is fundamentally important about ISOs is that they are physical leftovers of the process of forming another planetary system and they can give us clues to that process,” said Karen Meech, an astrobiologist at the University of Hawaiʻi at Mānoa who was not involved with this research.
“The conditions in the stellar system in which 3I/ATLAS formed may have been quite different from the one in the solar system.”
The team observed 3I/ATLAS with the Atacama Large Millimeter/submillimeter Array (ALMA) in Chile on November 2025 when the comet was 335 million kilometers (208 million miles) from Earth. It had just passed its closest approach to the Sun and was as bright as it was ever going to be. This timing was critical for the measurements the team wanted to make because the signal for HDO is very subtle, especially when it has to compete with the much more abundant H2O in the comet and within Earth’s atmosphere, Salazar Manzano explained.
Those measurements showed that for every 1,000 hydrogen atoms in 3I/ATLAS, there were about 5–7 deuterium atoms. While that’s not a lot, the ratio is still at least 40 times more than what’s found in ocean water and at least 30 times the average value in solar system comets.
“The conditions in the stellar system in which 3I/ATLAS formed may have been quite different from the one in the solar system,” said Paul Hartogh, a physicist and atmospheric science researcher at the Max Planck Institute for Solar System Research in Göttingen, Germany.
The first interstellar object, 1I/ʻOumuamua, did not outgas any material, and although the second object, 2I/Borisov, did, it was not bright enough to detect deuterium. 3I/ATLAS was the first opportunity astronomers had to measure the D/H ratio of an interstellar comet. Those measurements suggest that 3I/ATLAS formed in a much colder galactic environment than the solar system did, less than 30°C above absolute zero. The team published these results in Nature Astronomy in April.
Planning for the Next Interstellar Visitor
Hartogh, who was not involved with this research, said that on the one hand, 3I/ATLAS’s high deuterium enrichment is surprising because it is higher than that of any known comet. On the other hand, he added, some scientists predicted such high values for cometary water several decades ago.
Meech said she found these results “really interesting.” She never expected all other solar systems to have formed just like ours, and 3I/ATLAS fits with that idea.
“This gives us an intriguing look into the processes of planetary system formation—and that there are differences from our own solar system,” Meech said. “It is too early to tell what this implies for the formation of planets or habitable worlds. We are just at the beginning of an exciting story.”
“The fact that we were able to make this measurement with 3I will allow us to better prepare what to expect with the next generation of interstellar objects.”
3I/ATLAS is getting harder to see with telescopes, but astronomers still have a lot of data from when it was much brighter to go through, Salazar Manzano said. Teams around the world are working on creating a holistic picture of the comet’s chemistry and evolution.
What’s more, “the fact that we were able to make this measurement with 3I will allow us to better prepare what to expect with the next generation of interstellar objects,” Salazar Manzano said.
Scientists expect that the Vera C. Rubin Observatory could discover between 6 and 51 interstellar objects within the next 10 years. If objects are detected early enough in their journey through the solar system, “there may be enough time to coordinate observations with ground-based and spaceborne telescopes, taking advantage of the recent experience gained by the multiple 3I/ATLAS observations,” Hartogh said.
“These are rare opportunities to study another planetary nursery up close, and we have to take advantage of each new ISO to learn as much as we can,” Meech said. “It may be harder for a large number of individual teams to get all the data they want, so I think coordination and collaboration is needed more than ever.”
Citation: Cartier, K. M. S. (2026), Interstellar comet was born in a very cold place, Eos, 107, https://doi.org/10.1029/2026EO260141. Published on 7 May 2026.
Scientists agree that to have a chance of keeping the world’s warming below the Paris Agreement limit of 1.5°C (2.7°F), humanity needs most oil, gas, and coal to remain in the ground. This “unburnable” or “unextractable” carbon would not contribute to global carbon emissions.
But where, exactly, should we prioritize shutting down or banning fossil fuel activities? A new study published in PLoS One provides an answer for the Arctic with an atlas showing where oil and gas activities overlap with vulnerable ecosystems, important wildlife species, and Indigenous land.
“We’re investigating the idea of unburnable carbon with a geographical perspective,” said Daniele Codato, a geographer at the Università de Padova in Italy and lead author of the new study. “We focus on where to keep oil and gas underground.”
The atlas is meant to help decisionmakers prioritize areas where it is essential to avoid opening new frontiers or where current oil and gas extraction should be halted because of social, cultural, ecological, or climate justice criteria, he said.
Overlaps, Mapped
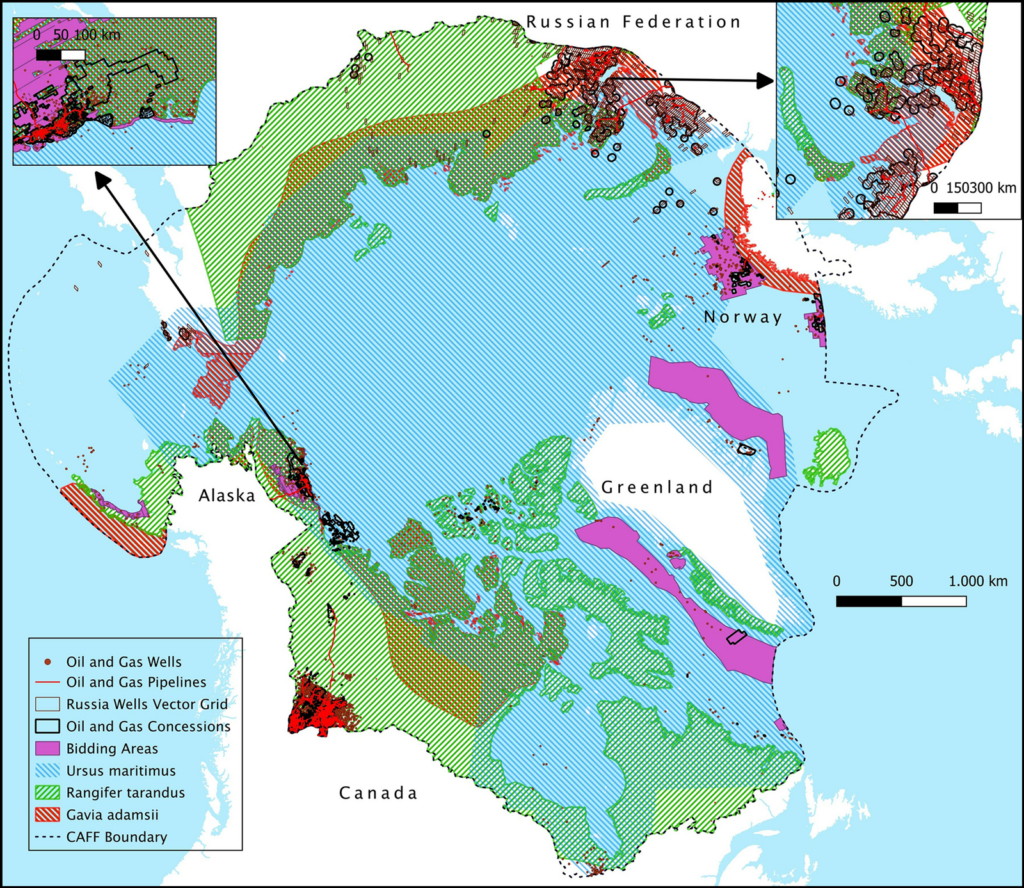
Codato and a team of researchers created their Arctic atlas with dozens of public datasets from five Arctic polities known to have oil and gas activities (Alaska (United States), Canada, Greenland (Denmark), Norway, and Russia). Though various geographic definitions of the Arctic exist, the team chose a boundary used to evaluate wildlife and conservation by the Conservation of Arctic Flora and Fauna (the biodiversity working group of the Arctic Council, an intergovernmental organization focused on Arctic governance) to include the largest possible portion of vulnerable ecosystems.
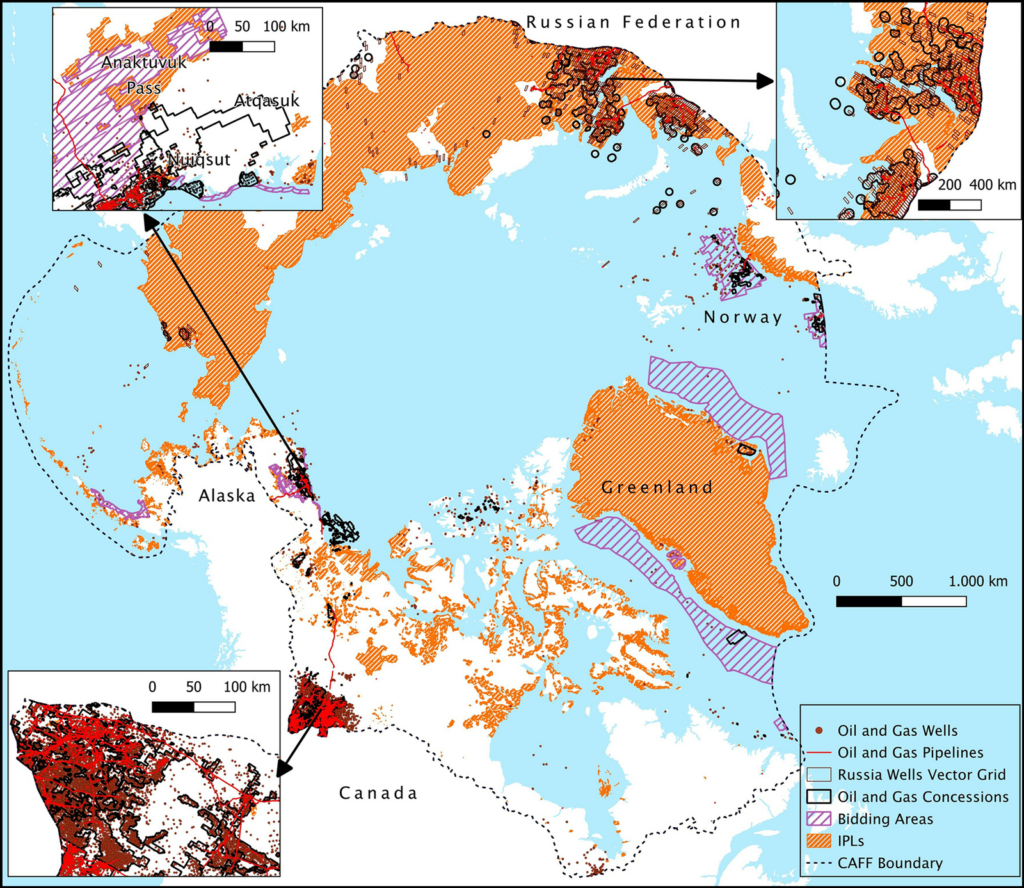
The resulting maps revealed more than 512,000 square kilometers—an area about the size of Spain—of Arctic territory with existing or planned fossil fuel activities, including leases, areas under bid, exploration licenses, and infrastructure. Within those areas, the researchers counted 44,539 active wells and nearly 40,000 kilometers (about 25,000 miles) of pipelines.
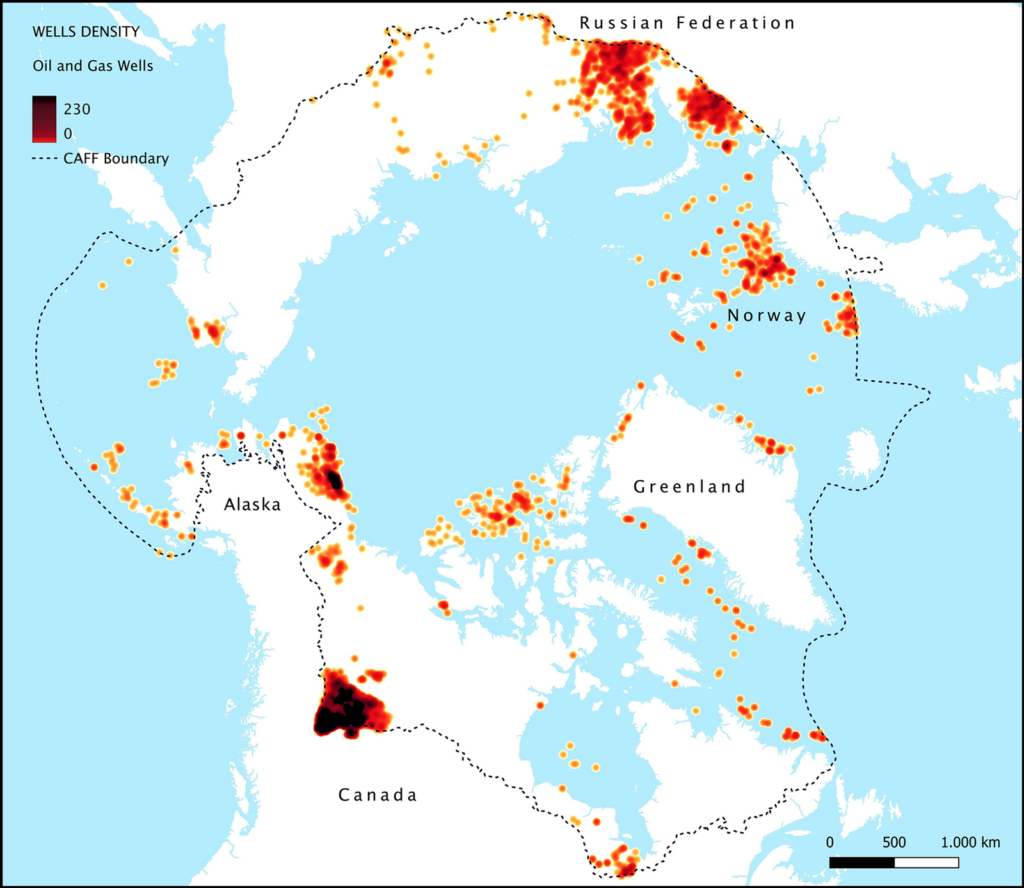
Oil and gas wells in the Arctic are highly concentrated in northwestern Canada, northern Alaska, and northern Russia. The CAFF boundary identifies the Arctic region as defined by the Conservation of Arctic Flora and Fauna (the biodiversity working group of the Arctic Council). Click image for larger version. Credit: Codato et al., 2026, https://doi.org/10.1371/journal.pone.0345775
Next, the researchers determined how oil and gas activities overlapped with protected areas defined by the International Union for Conservation of Nature and conservation priority areas defined by three other nongovernmental organizations. Fossil fuel activities threaten wildlife by altering habitats, disrupting migratory routes, and releasing pollutants.
Of the area containing oil and gas activities, more than 7% overlapped with ecologically protected areas, and more than 13% overlapped with the ranges of all of the three key Arctic species considered in the study: polar bears, yellow-billed loons, and caribou. The highest concentrations of oil and gas activities were in the Yamal Peninsula of Russia, northwestern Canada, and the North Slope of Alaska, all home to fragile ecosystems.
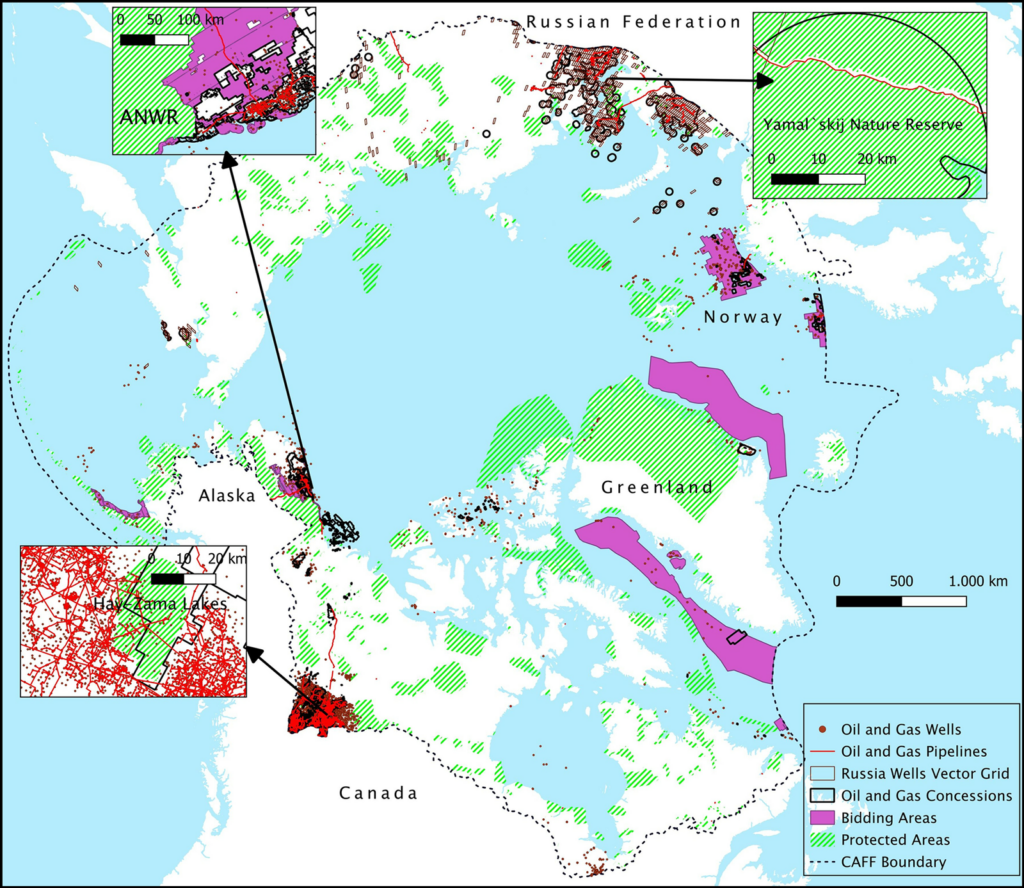
Seven percent of Arctic fossil fuel extraction areas mapped by the research team overlapped with ecologically protected areas. In some cases, such as in the Yamal`skij Nature Reserve in Russia (top right), protected area borders have been cut or delimited to avoid overlapping with protected area boundaries, possibly indicating that protected areas have been downsized or redesigned to accommodate fossil fuel infrastructure. ANWR = Arctic National Wildlife Refuge. Click image for larger version. Credit: Codato et al., 2026, https://doi.org/10.1371/journal.pone.0345775
Mapping revealed that 87.21% of leases in Alaska and more than 13% of total Arctic concessions for fossil fuel activities overlapped with the ranges of all three of the key Arctic species considered in the study (polar bears (Ursus maritimus), caribou (Rangifer tarandus), and yellow-billed loons (Gavia adamsii)). Click image for larger version. Credit: Codato et al., 2026, https://doi.org/10.1371/journal.pone.0345775
The researchers also discovered that 73% of land with oil and gas activities overlapped with Indigenous Peoples’ lands, defined in the study as lands where Indigenous communities maintain significant influence over land management. Fossil fuel activities can threaten Indigenous communities’ health and ways of life, though the authors note that overlaps between Indigenous Peoples’ lands and fossil fuel activities do not necessarily indicate an opposition between the two.
Oil and gas concessions cover more than 4% of Indigenous Peoples’ lands (IPLs) in the Arctic. Click image for larger version. Credit: Codato et al., 2026, https://doi.org/10.1371/journal.pone.0345775
“It’s a really interesting idea to create an atlas of unburnable carbon and try to make visible where tensions might occur between Indigenous land, ecosystems, [and fossil fuel activities],” said Mariel Kieval, a researcher at the Arctic Institute, a nonprofit research organization. The overlaps noted in the atlas are an “initial indicator” providing opportunities for further research that zooms in on specific areas, she said.
Kieval also said the atlas could be helpful for local communities trying to identify where extraction activities are occurring nearby.
Policy Paradigm
The atlas’s effort to express the urgency of action to the public and policymakers is useful, said Paul Ekins, an economist at University College London who was part of the team that coined the term “unburnable carbon.” “Any way in which atlases or discussions or slogans can up the political ante so that politicians become braver in seeking to address this issue is to be welcomed.”
In particular, Codato hopes the atlas will fuel a “paradigm shift” in global policy that would ultimately ban the proliferation of fossil fuel activities in the Arctic.
The need for an intergovernmental ban on fossil fuel activities is evidenced by the Arctic National Wildlife Refuge in Alaska, Codato said: The refuge received temporary protections against drilling under the Biden administration, but the Trump administration plans to open the refuge for oil and gas leases this summer. “We need something stronger” to avoid such administration-by-administration changes in Arctic protections, he said.
“If we don’t start to ban fossil fuels in the Arctic now, it could become another sacrifice zone.”
Such a paradigm shift will be more important than ever as warming in the Arctic provides new access to resources and opportunities for trade that may accelerate ecological and cultural disruptions. “If we don’t start to ban fossil fuels in the Arctic now, it could become another sacrifice zone,” like some parts of the Amazon rainforest, Codato said.
Policy actions have fallen far behind the science, Ekins said. “There should have been an agreement not to exploit fossil fuels in the Arctic well before the ice had melted to a sufficient extent to make that a practical possibility.”
In 2023, the research team published a similar atlas identifying unburnable carbon in the Ecuadorian Amazon and plans to continue to expand their atlas to include the rest of the world. The team is currently working on projects that cover Brazil, Italy, Nigeria, and the United Kingdom.
Citation: van Deelen, G. (2026), This Arctic atlas shows where oil and gas activities overlap with wildlife and Indigenous communities, Eos, 107, https://doi.org/10.1029/2026EO260139. Published on 7 May 2026.
Dust and water ice clouds are ubiquitous on Mars; they regulate the planet’s climate and can affect measurements of other atmospheric components. Constraining their spatial and temporal variability is also essential for improving Martian general circulation models.
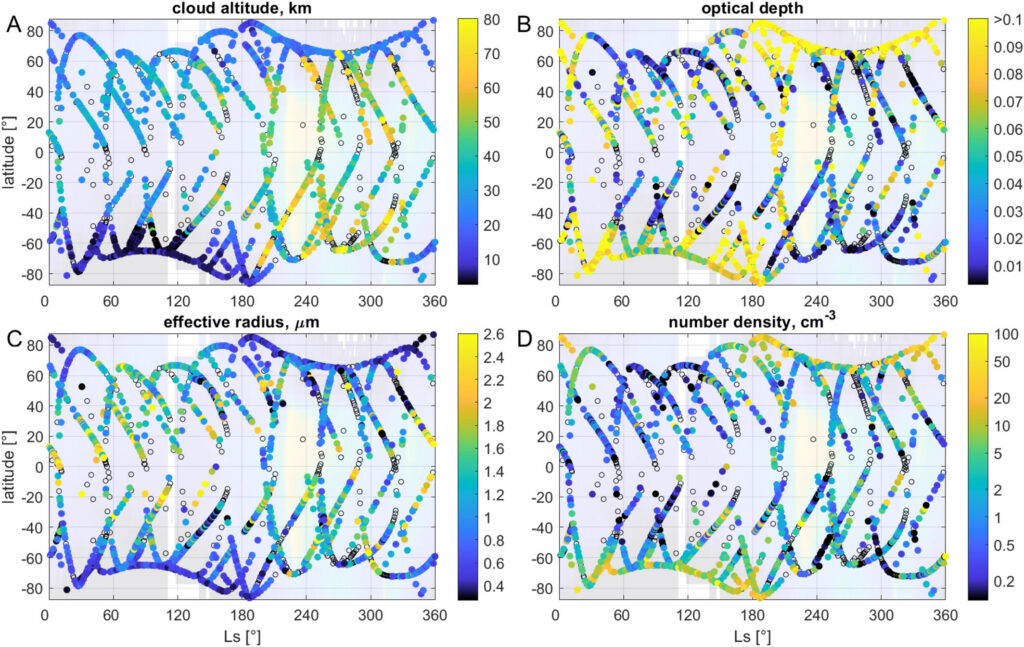
Fedorova et al. [2026] use solar occultation measurements from the SPICAM infrared spectrometer on board the Mars Express orbiter to characterize nine Martian years (MY 28 through 36) of dust and water ice clouds. Because the spectrometer could not distinguish between these particles’ types, the researchers employ a new method integrating Mars Climate Sounder data and general climate model predictions to identify them.
The analysis reveals that the particles can reach altitudes up to 80 kilometers during perihelion, while their size remains relatively uniform with height. This suggests that Martian dust distribution is driven more by atmospheric dynamics and horizontal transport, capable of lifting and moving particles over vast distances, rather than by turbulent mixing against gravity alone.
The study also provides a detailed seasonal and spatial climatology of major Martian atmospheric features, including the Polar Hood Clouds, the Aphelion Cloud belt, and the Mesospheric Clouds. The detection of high-altitude clouds (70–90 km) during dust events confirms enhanced transport of water vapor into the upper atmosphere during both global and regional storms. These findings are consistent with simultaneous observations from the Atmospheric Chemistry Suite on the Trace Gas Orbiter.
These observations show that large-scale atmospheric dynamics, rather than local mixing alone, control how aerosols are distributed vertically on Mars, with important implications for the transport of water to the upper atmosphere and the planet’s climate evolution.
The figure shows how the water ice cloud layers vary with latitude and season (Ls), based on SPICAM observations. (a) altitude of the cloud layer in kilometers; (b) thickness of the cloud (optical depth); (c) average size of the ice particles in micrometers; and (d) number of particles within the layer (number density. The background color is the amount of dust in the atmosphere from Montabone et al. [2015]: red areas indicate high dust levels, while dark blue areas indicate low dust. Black open circles mark locations where no clear water ice clouds were detected. Credit: Fedorova et al. [2026], Figure 12
Citation: Fedorova, A. A., Luginin, M., Montmessin, F., Korablev, O. I., Bertaux, J.-L., Stcherbinine, A., & Lefèvre, F. (2026). Multiyear monitoring of aerosol vertical distribution on Mars by SPICAM IR/MEX. Journal of Geophysical Research: Planets, 131, e2025JE009388. https://doi.org/10.1029/2025JE009388
—Arianna Piccialli, Associate Editor, and Beatriz Sanchez-Cano, Editor, JGR: Planets
Female mud snails are developing male reproductive organs near marinas. In Florida, alligators living in lakes contaminated with pesticides are being born with smaller genitals and disrupted hormones. Sea turtle populations are becoming almost entirely female as nesting sands get warmer. The same types of chemicals responsible for these wildlife changes are now found in human placentas, testes, and semen. A new peer-reviewed review brings all of this evidence together for the first time.
A cross-species review published April 23 in npj Emerging Contaminants, led by Oregon State University toxicologist Susanne Brander and Mount Sinai researcher Shanna Swan, brings together evidence from many animal groups, including invertebrates, fish, birds, reptiles, amphibians, marine mammals, rodents, and humans. The main finding is that pollution and climate change together are now the biggest single cause of biodiversity loss. The chemicals at the heart of this problem—phthalates, bisphenols, PFAS, and microplastics—are lowering fertility and reproductive success in many species, including humans.
Of more than 140,000 synthetic chemicals registered under the EU’s REACH chemical safety regulation, only about 1% have been properly tested for safety, and over 1,000 are known endocrine-disrupting chemicals (EDCs). Each year, more than 2,000 new chemicals are introduced worldwide. The review’s authors say these chemicals can be effective at concentrations so low they are “analogous to a whisper that is powerful enough to redirect a hurricane.” Because the endocrine system is very similar across vertebrates, scientists have used fish to predict effects in mammals. This is why the human findings in the review are not surprising when compared to what has happened in wildlife.
The article provides new clarity on how climate change and chemical exposure interact. Warmer temperatures have been shown to worsen endocrine disruption. In some fish, heat combined with EDCs changes sex ratios more than either factor alone. At the world’s largest green turtle rookery, almost all hatchlings are now female. In humans, an 80-year study of U.S. birth data found that hotter weather is linked to fewer conceptions. Other studies show that higher temperatures are connected to lower semen volume, sperm count, and sperm quality.
Plastics aren’t inert and “BPA-free” doesn’t mean safe
The article pays special attention to microplastics and nanoplastics, which were only recently recognized as reproductive toxicants. In 2021, researchers found microplastics in human placentas. In 2023, another study found microplastics in human testis and semen samples. A follow-up study found microplastics in every canine and human testis examined, with higher levels in humans. Several studies in the review show that polystyrene microplastics lower fertility, fertilization, and hatching rates in fish, and these effects can last for generations.
The issue of chemical substitution is important here as well. Older PFAS chemicals like PFOA have mostly been replaced, but their substitutes, such as GenX chemicals and other similar compounds, show equal or even stronger estrogen-like effects in lab tests. BPA substitutes like BPS and BPF act almost the same way on hormones. The review also points out that bio-based plastics like polylactic acid (PLA) caused reproductive harm in earthworms, similar to regular polyethylene. This pattern of “regrettable substitution,” where a banned chemical is swapped for a similar, unregulated one that causes the same harm, is now well documented.
The federal regulatory response is the focus of much controversy. EPA finalized the first national drinking water limits for six PFAS in 2024, setting PFOA and PFOS at 4 parts per trillion. In May 2025, the agency announced it would keep those two limits but extend the compliance deadline to 2031, and eliminate limits on four other PFAS. In January 2026, the D.C. Circuit denied EPA’s request to summarily vacate those four limits; final briefs are due this spring, and a decision is expected in the second half of 2026. While that plays out, individual filtration is the only consumer-side lever that actually removes PFAS from the water already in the tap.
What you can do to reduce your family’s exposure
Individual actions alone cannot solve a problem this big. The review’s main point is that we need broad regulatory changes for whole classes of chemicals, not just one at a time. Still, you can lower your own exposure, and the most effective changes come from a few key steps. The list below is ordered by impact, not by how easy the steps are.
Drinking water: this is where to start
Start by checking your water. Enter your ZIP code into EWG’s Tap Water Database to find out what has been found in your local water supply. You can also use the EPA’s PFAS Analytic Tools for more information. If you have a private well, have it tested by an EPA-certified lab. Mail-in kits from SimpleLab and Cyclopure cost between $85 and $300.
Use a filter for your tap water. Choose filters that are certified to NSF/ANSI 53 (carbon-based) or NSF/ANSI 58 (reverse osmosis) for reducing PFAS. Be aware that “tested to NSF standards” is just a marketing term that can be abused, so check that the filter is actually certified. Reverse osmosis and granular activated carbon are proven to work, but most pitcher and refrigerator filters are not certified for PFAS.
Change filter cartridges on time. EWG senior scientist Tasha Stoiber points out that a used-up filter can release more PFAS than untreated tap water. Keeping up with the maintenance schedule is essential for protection.
Avoid using bottled water as a long-term fix. A 2024 Columbia University study found about 240,000 plastic particles per liter of bottled water, which is 10 to 100 times higher than earlier estimates. Around 90% of these particles are nanoplastics.
Food contact materials
Do not heat food in plastic containers. Phthalates are more likely to leach out when heated. Use glass or ceramic in the microwave. If you plan to reuse plastic food containers, avoid putting them through the dishwasher’s high-heat cycle.
Reduce takeout and fast food when possible. A 2016 study found that people who ate more fast food had higher levels of phthalate metabolites in their urine, likely due to plastic gloves, wraps, and containers. Maine will ban PFAS in food packaging starting in May 2026, with a wider ban by 2030. Other states are following Maine’s lead, but for now, eating fewer plastic-wrapped meals means less exposure.
Replace nonstick cookware when it becomes chipped or scratched, as it is damaged. PTFE-coated pans can release particles into food. Stainless steel, cast, good, long-lasting alternatives. Also, nonstick pans are not ideal for high-heat cooking like searing.
Store food in glass or stainless steel containers. This is the easiest change you can make. Glass jars and stainless containers do not release microplastics or phthalates and can last for decades. Replace plastic containers only when they break or stain, instead of buying more. products
Be cautious when you see the word “fragrance” on a product label. Diethyl phthalate (DEP) is often used as a fragrance carrier and does not have to be listed separately under U.S. labeling rules; it just appears as “fragrance” or “parfum.” Choose products that list all fragrance ingredients or are certified EWG VERIFIED or EPA Safer Choice.
Plug-in air fresheners are especially high in phthalates, so the easiest solution is to remove them and use ventilation instead.
Get rid of vinyl shower curtains. The “new shower curtain” smell comes from phthalates being released from PVC. Cotton, hemp, and PEVA shower curtains are easy to find and cost about the same as vinyl ones.
Check your cleaning products for parabens, triclosan, and APEs. EWG’s Guide to Healthy Cleaning rates products based on an EDC database. Laundry detergent and fabric softener residues stay on clothes and touch your skin for hours, so exposure can add up quickly.
Be careful with plastic toys labeled with codes 3, 6, or 7, especially for young children who put toys in their mouths. Code 3 is PVC, which contains phthalates. Code 6 is polystyrene. Code 7 is a general category that often includes polycarbonate, a source of BPA. Safer alternatives include wood, natural rubber, organic cotton, and silicone.
Stop pesticides at the property line.
Think twice before using pyrethroid-based treatments for your home or lawn. Bifenthrin, one of the most common pesticides in the U.S., has been shown to disrupt estrogen receptors in fish at levels often found in urban runoff after rain. The review also notes that people with higher levels of pyrethroid metabolites in their urine tend to have lower semen quality and more sperm DNA damage. If you hire a pest control service, ask about the active ingredients they use and request safer alternatives.
Buy organic for the produce items with the highest pesticide loads. EWG’s Shopper’s Guide to Pesticides in Produce (the “Dirty Dozen” / “Clean Fifteen”) lets you prioritize organic where it matters most, rather than treating the produce aisle as all-or-nothing.
Where individual action stops working
The authors of the review make it clear that consumer choices alone are not enough. These chemicals are found even in Arctic rainwater, can cross the placenta, and last for centuries in the environment. The solution they propose is coordinated regulatory action: a strong Global Plastics Treaty that targets harmful chemicals, not just plastics in general; regulations that cover whole classes of chemicals rather than one at a time; and rules that make polluters responsible for cleanup costs, rather than passing those costs to utilities and customers.
The reason the review looks at different species is to show that what happens to snails, alligators, and seabirds also happens to humans, just at a different pace. Wildlife data have been warning us for 40 years, and now human data are starting to show the same patterns.
A used aluminum can is worth more, pound for pound, than almost anything else you put at the curb. In late 2024, a ton of crushed and baled cans was selling for around $1,338. Glass, by comparison, sells for roughly, well, nothing. Mixed plastics often cost the recycler money to handle. A single bale of cans, about the size of a small refrigerator, can be worth $40,000 in scrap. In a lot of towns, that one bale is the reason the whole truckful of recyclables is worth picking up.
That makes aluminum the quiet engine of curbside recycling. And right now, fewer Americans are putting cans in their bins than at any time since the early 1990s. According to a 2024 report from the Aluminum Association and Can Manufacturers Institute, the U.S. consumer aluminum-can recycling rate fell to 43 percent in 2023, well below the 30-year average of about 52 percent. Consequently, more than half of every can you finish ends up buried in a landfill instead of back on a store shelf as a new can.
How a recycling plant makes its money
Your bin doesn’t go straight to a recycling factory. It goes to a sorting facility called a MRF, pronounced “murf,” short for material recovery facility. A MRF is essentially a giant conveyor belt with magnets, screens, optical scanners, and people, all pulling the stream into separate piles: cardboard here, paper there, plastics by type, glass, metal.
Each of those piles becomes a bale, a compressed cube of a single material wrapped in wire. The MRF sells the bales to processors, who melt or pulp them into raw material for new products. That sale price, minus what it cost to sort, is the MRF’s revenue.
Most of the bales barely break even. Glass usually loses money. Mixed plastics sometimes make a loss, and sometimes don’t. The bale that consistently makes money is aluminum. A used can returned to a mill is back on a shelf, full of soda or seltzer, in as little as 60 days, using about 95 percent less energy than making aluminum from raw ore. And the metal doesn’t degrade. The same atoms can be recycled over and over, forever, with minimal losses of material during the recovery process.
That combination of high value and infinite recyclability is why aluminum is the only material in your bin that the recycling system genuinely wants. The rest of the content rides on the can’s profit.
Why fewer cans are getting back to mills
The 43 percent national rate hides a sharp split between two kinds of states.
Ten states have a system called a deposit-return scheme, more commonly known as a bottle bill. You pay an extra five or 10 cents when you buy a canned drink and get it back when you return the empty to a store or a redemption center. Those states are California, Connecticut, Hawaii, Iowa, Maine, Massachusetts, Michigan, New York, Oregon, and Vermont, where return rates run from 65 to 90 percent, with Michigan and Oregon — both at $0.10 deposits — consistently reporting the highest recovery rates, according to Container Recycling Institute data.
The other 40 states rely solely on curbside collection. Their rates are about half as high.
The reason is simple. A deposit turns a can from “trash” into “money I’m holding.” It doesn’t take an environmental conviction to bring it back; it takes ten cents on the table. Curbside recycling doesn’t create that signal. It depends on people remembering to rinse and toss every can in the right bin, week after week, with no immediate reward. A lot of cans don’t make it.
What this costs your community
When cans miss the bin, the cost is spread across three areas.
The first is your municipal budget. Many city and county recycling contracts include aluminum revenue as a line item. When that revenue shrinks, somebody covers the gap — usually you, through a slightly higher trash bill or property-tax allocation. According to the Aluminum Association, roughly $800 million worth of cans are landfilled in the U.S. every year. That lost value has to come from somewhere; the gap shows up in your trash bill or your property taxes.
The second is energy. Every can made from raw bauxite ore rather than recycled metal requires far more electricity. Across the volume the U.S. landfills annually, the difference is the equivalent of several large coal-fired power plants’ worth of generation, every year, lit up to make new metal we already have above ground.
The third is the recycling system itself. The aluminum bale is what subsidizes the rest of the bin. When fewer cans go in, the cost of recovering everything else rises — and pressure builds on cities to drop materials they can’t afford to handle. Glass is usually first to go, and it has been abandoned by many municipalities over the last decade.
Why bottle bills are coming back
For most of the late 20th century, the beverage industry fought bottle bills hard. That has flipped. Both the Aluminum Association and Can Manufacturers Institute now back well-designed deposit programs, because the industry has set a 70 percent recovery target by 2030, and the arithmetic doesn’t work without deposits in more states.
Washington State has considered a bottle bill in several recent legislative sessions. Tennessee and Rhode Island also have active or recurring proposals. Since 2019, Vermont, Connecticut, and Oregon have expanded or updated their programs by adding wine and spirits containers, raising deposit amounts, or installing reverse-vending machines that process returns automatically.
Whether recycling scales to your community’s needs depends largely on how loud and informed the local civic conversation gets in the next five years.
What You Can Do
At home
Rinse and recycle every can. Make sure it’s empty and dry before putting it in the bin. A little residue is okay, but food waste lowers the value of the bale.
If you live in a bottle-bill state, don’t crush your cans. Reverse-vending machines need to scan the barcode, and a crushed can can’t be read, so you lose your deposit.
Aluminum foil and trays can be recycled too, but they are sorted separately.
If your state has a deposit system, return your cans for redemption. Cans returned this way go straight to mills with almost no loss during sorting. Curbside cans take a longer route and more are lost along the way.
In your community
Support bottle-bill legislation if your state is thinking about adopting one.
Encourage updates to deposit programs in states with older systems. A five-cent deposit set in the 1970s doesn’t motivate people like it used to. Ten cents is now the standard that works.
Ask your city council how recycling revenue is used. It’s a real part of the budget and directly affects your trash bill. Most people never ask, but those who do usually get answers.
A wonderful new paper on the huge Tracy Arm landslide and tsunami will have profound but challenging implications for the management of risk in an age of increased tourism and rapid climate change.
The journal Science has published an excellent new paper (Shugar et al. 2026) that examines the extraordinary 10 August 2025 landslide and tsunami at Tracy Arm fjord in Alaska. The paper is open access, so you can read it for yourself (it is very accessible), and there has been a plethora of media coverage (quite rightly).
That large landslides occur in fjords is not a surprise, and that they can generate enormous displacement waves is also not news. We know that landslide occurrence in these environments in general is increasing, and specifically so in Alaska. However, this paper is the most comprehensive and systematic analysis of such an event, and it has shown the remarkable threat that these events can generate. The tsunami created by this landslide had a 481 metre run-up; it is remarkable that there were no fatalities. If a large cruise ship had been in the area, with passengers being ferried ashore on small boats and exploring the shoreline, the consequences would have been catastrophic. It is unsurprising then that cruise companies are now amending their itineraries.
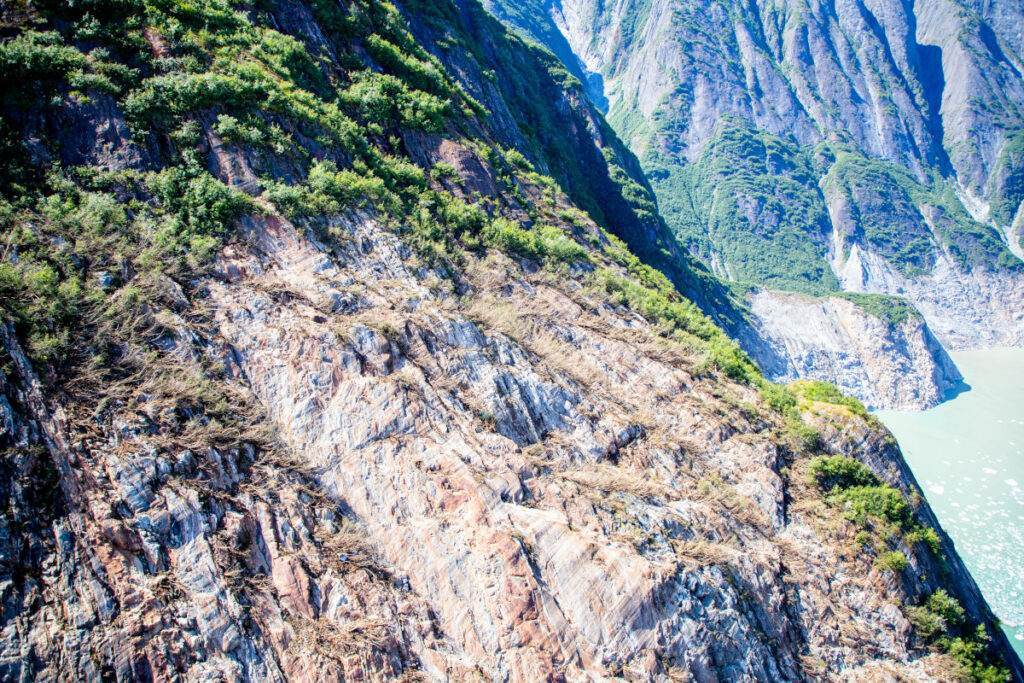
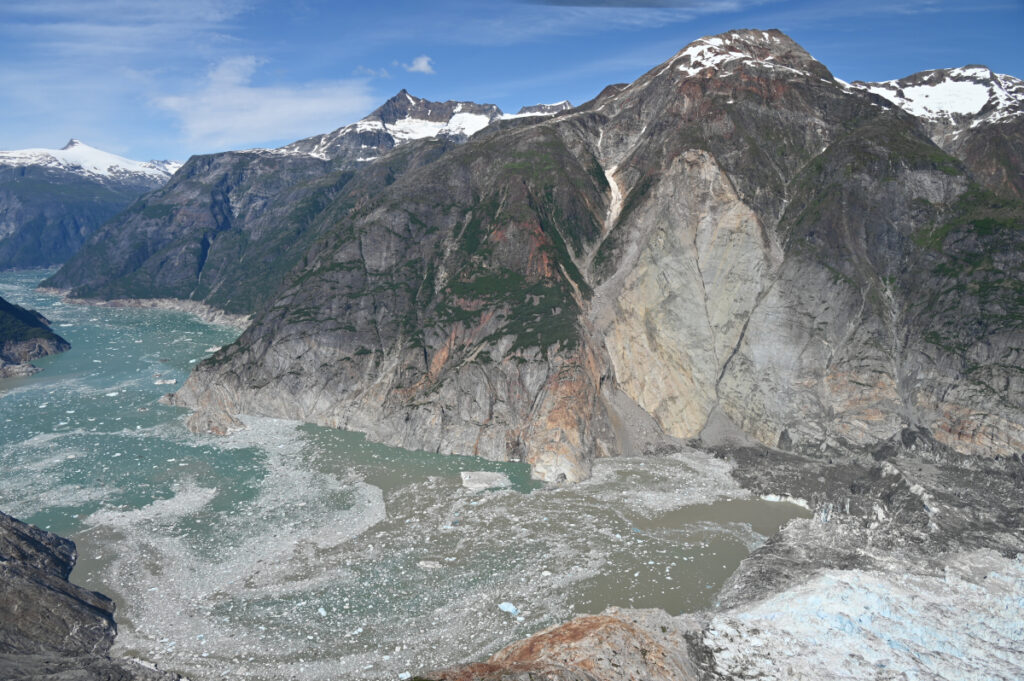
The USGS released the image below of the aftermath of the landslide and tsunami – scale is hard to understand in such images, but the crown of the landslide is over 1,000 metres above the level of the fjord, and the landslide had a subaerial volume of over 63 million cubic metres.
This aerial photo shows the north side of Alaska’s Tracy Arm Fjord in the aftermath of the 2025 landslide and tsunami. The lighter-colored rock is the exposed surface, where the mountainside collapsed and fell into the water. The foot of South Sawyer Glacier is visible at lower right; in decades past, the ice extended much farther and was thick enough to hold the rock slopes in place. Credit: Cyrus Read/U.S. Geological Survey
Shugar et al. (2026) has a brief section that examines the implications of this event, and of the understanding that it provides of the hazards posed by very large landslides in fjord settings. These are locations with extensive human activity – local communities, trade, fishing and tourism. There is some evidence that these landsldies are more likely to occur in the spring and summer months, when human occupation is higher. Our resilience to a tsunami wave that starts off being hundreds of metres high is low.
A case in point lies in Milford Sound in New Zealand, where (for example) an earthquake on the Alpine Fault has the potential to trigger a large landslide that could result in a major tsunami. Milford Sound is an extremely popular tourism location. Should such an event occur, and mass fatalities result, there is no doubt that the public inquiry would find that the societal risk was known and that it was probably unacceptable. However, to ban tourism, including cruise ships, in this area would carry heavy risks in its own right – it would profoundly impact the vital tourist economy of the area, on which many livelihoods depend. This is a substantial risk in its own right, and of course politics plays a major part too. Balancing these risks is a major challenge for any society.
Some hope is offered by the fact that this landslide showed substantial precursory seismic activity, which might represent a route to providing a warning for at least some of these rock slope failures. But research in this area is immature at the moment, and of course there will be no warning for a landslide triggered by a major earthquake.
So, the landslide at Tracy Arm fjord presents us with a host of major challenges, but it also represents a big step forward in our understanding of these events. Well done to Dan and his colleagues for another brilliant paper. I shall watch the debate with great interest.
As glaciers retreat in warming regions, the risk of related hazards can increase, and improved monitoring may help reduce some of those dangers, according to a new study.
This massive landslide produced a tsunami that reached 481 meters on the opposite side of the fjord—higher than all but the world’s 14 tallest buildings—and registered on seismic detectors around the globe. For days after the slope collapsed, the waters of the fjord churned with a standing wave known as a seiche.
This drone video shows a man paddling through the iceberg-filled Tracy arm fjord in the aftermath of a landslide. Credit: Bill Billmeier
This event was the second-largest tsunami ever recorded and the largest not linked to an earthquake. A new paper published in Science presented strong evidence that the Tracy Arm landslide was instead the result of the rapid retreat of South Sawyer Glacier, itself a consequence of global climate change.
“It’s like if you have a kid and they said they cleaned their room but really all they did was throw everything in the closet. As soon as you open that door, everything falls out.”
Nobody was harmed by the rockslide or tsunami, but cruise ships were scheduled to visit the fjord later that morning. If the collapse had happened just a few hours later, it could have been disastrous.
“While the [South Sawyer] Glacier is in the fjord, it’s supporting those valley walls, like the buttresses on a cathedral,” said Daniel Shugar, a geomorphologist at the University of Calgary who led the study. “As that glacier retreated over the last few decades, it retreated just past the spot that did fail. It’s like if you have a kid and they said they cleaned their room but really all they did was throw everything in the closet. As soon as you open that door, everything falls out.”
This animation shows an overhead view of the 10 August 2025 Tracy Arm landslide. Credit: Patrick Lynett, University of Southern California
In other words, the glacier that carved the fjord in the first place was also holding its slopes in place, and the ice’s retreat under warming temperatures exposed rock that became vulnerable to crumbling. The proximate cause of the landslide might have been something else—as Shugar noted, rainfall is plentiful in that part of Alaska, which could have weakened the fjord’s walls further—but it might also have been a combination of small, individually insignificant factors. In any case, the removal of that glacial “closet door” was what made the collapse and tsunami possible.
“We know that steep slopes are very sensitive to the things that climate [change] is exacerbating, whether it’s losing permafrost, glacier retreating, or more water in the soil,” said glaciologist Leigh Stearns of the University of Pennsylvania, who was not involved with the Tracy Arm study. “Often, we think of glacier retreat as a long and continuous thing, but [it] can trigger sudden catastrophic events.”
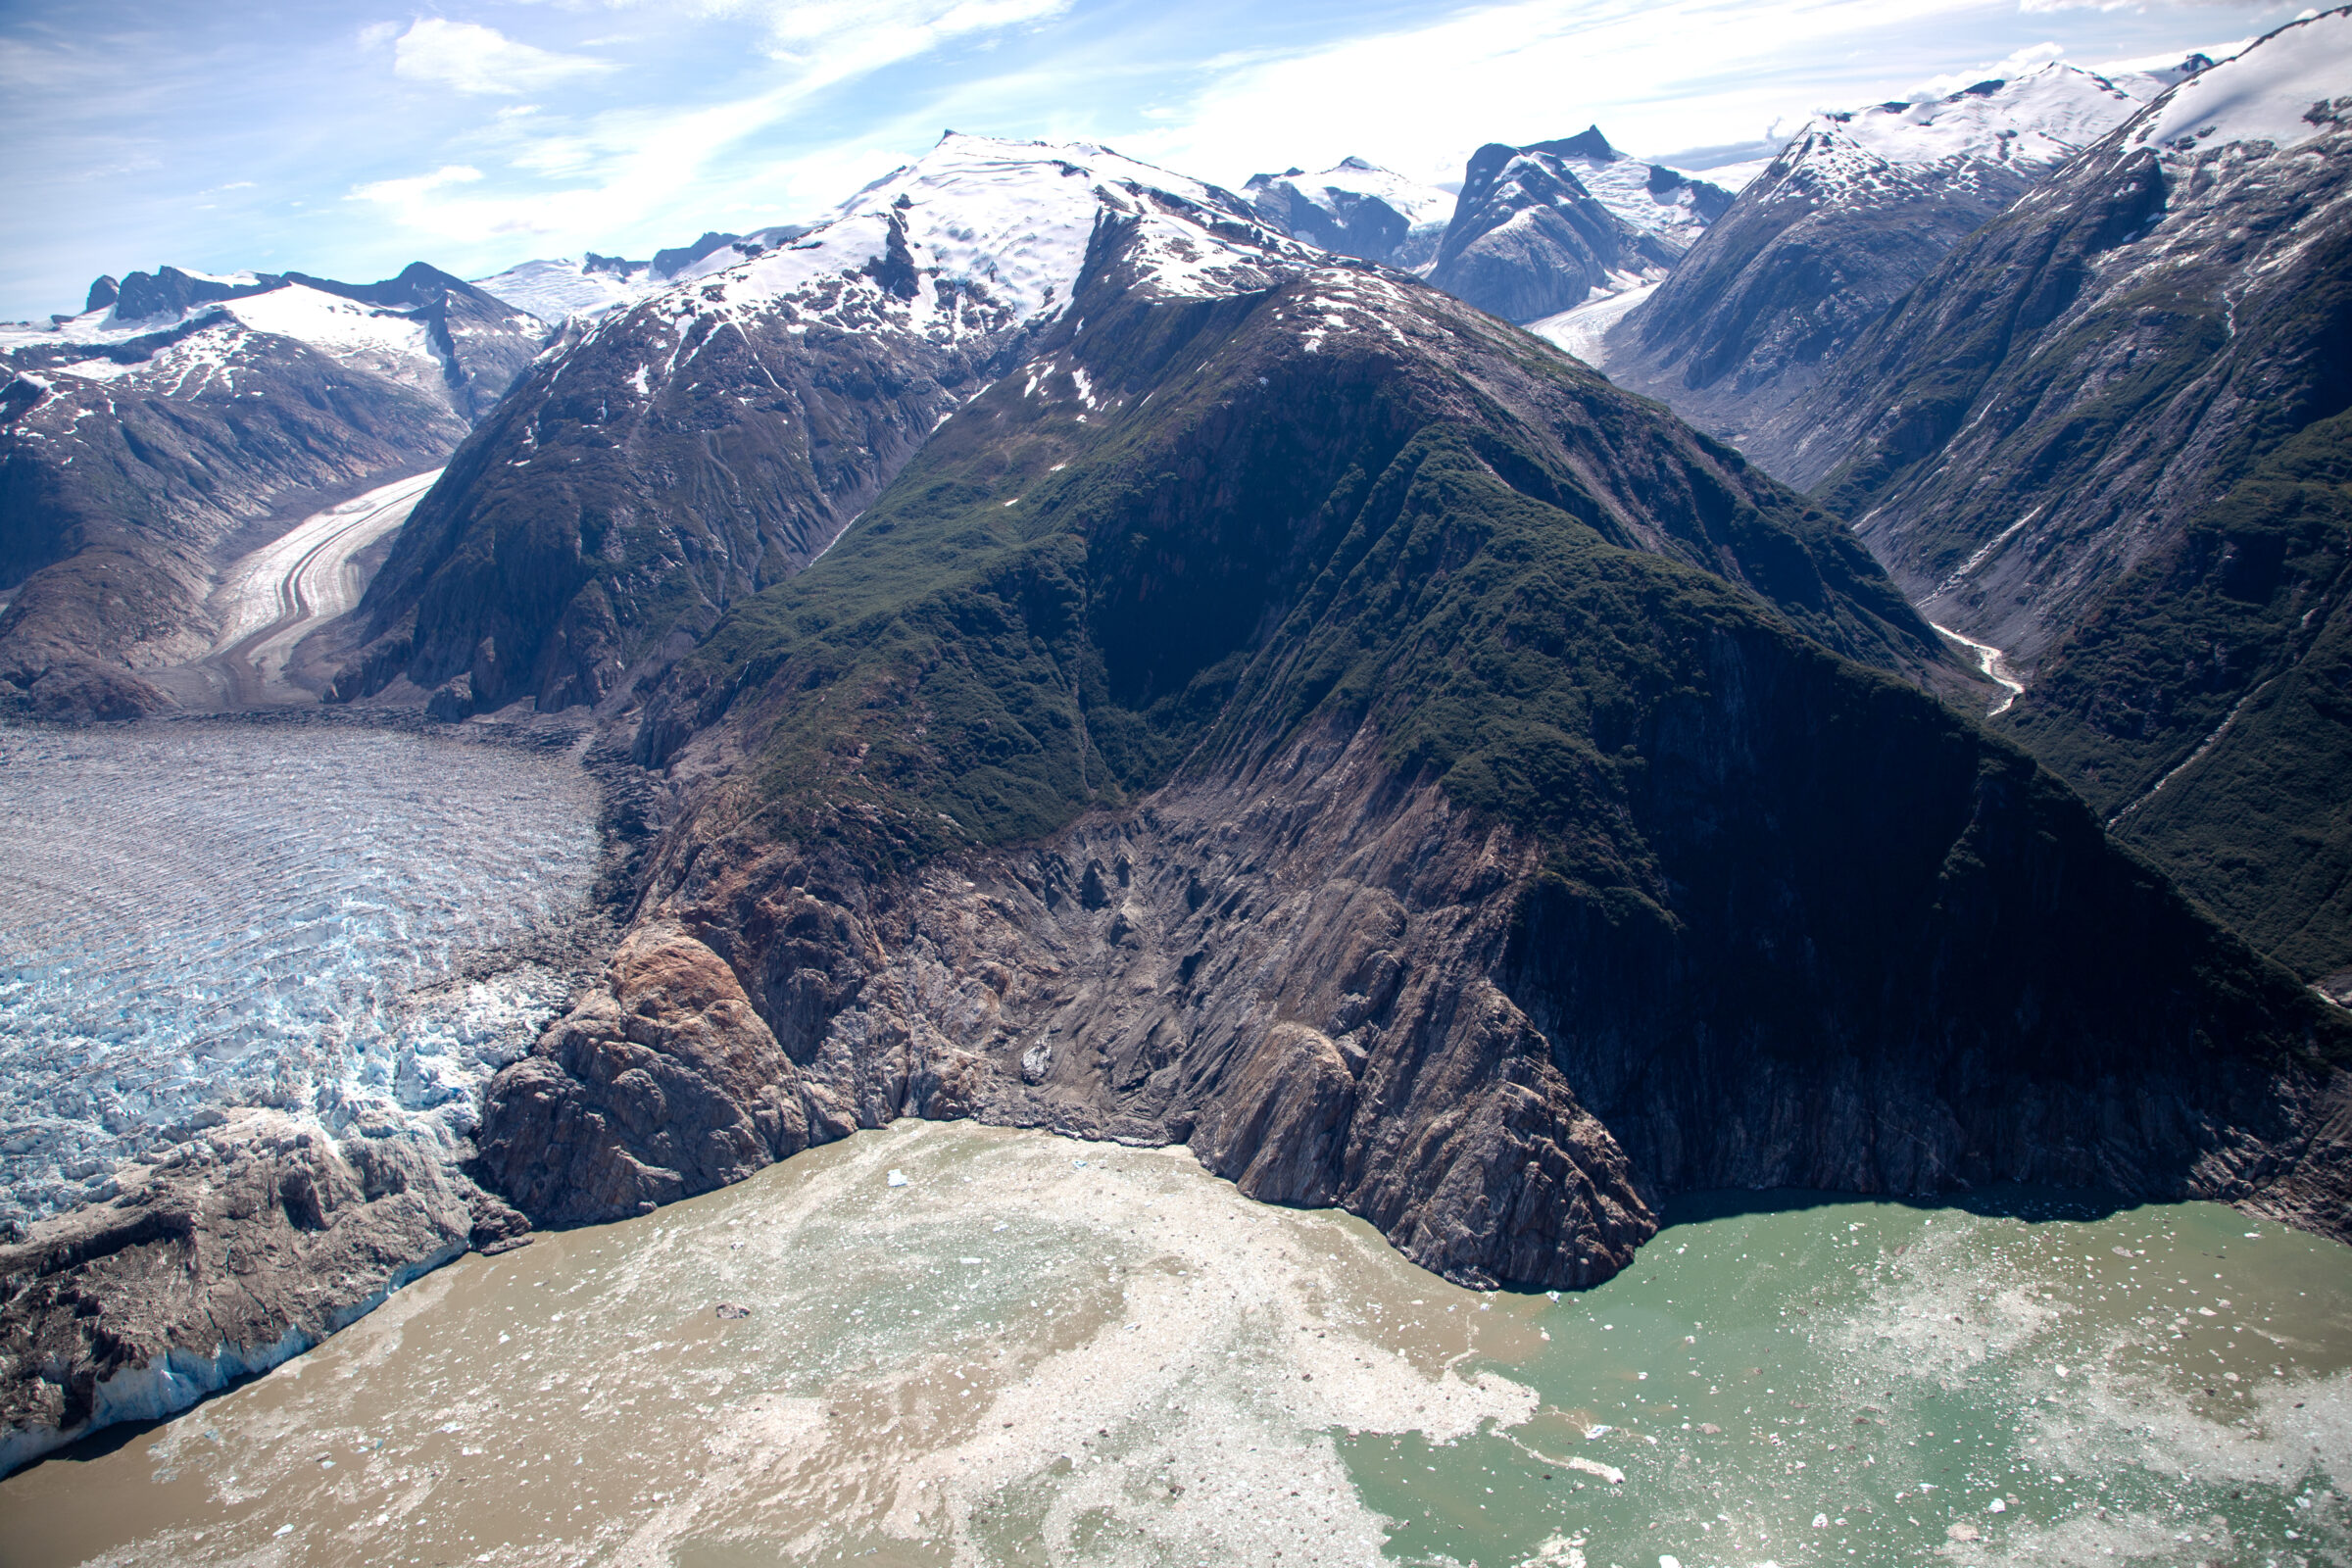
This aerial photo shows the highest run-up resulting from the 10 August 2025 landslide-triggered tsunami in Tracy Arm. It was captured during a U.S. Geological Survey field reconnaissance overflight on 13 August 2025. Credit: John Lyons/U.S. Geological Survey.
The Tracy Arm tsunami, like the record-setting Lituya Bay 524-meter megatsunami in 1958, was so dramatic in part because it happened in a fjord. The steep sides of the relatively narrow channel concentrated the energy generated by the rockfall into water.
A drone video shows the tsunami-affected part of the fjord, including the highest run-up area and the landslide itself. Credit: Bill Billmeier
Unlike Lituya Bay, which resulted from an earthquake, Tracy Arm provided very little seismic warning before the slope collapsed, requiring forensic work to determine what caused it.
Shugar noted that South Sawyer Glacier had retreated by roughly 500 meters in the spring of 2025 alone, on top of the general trend of shrinking and thinning over the decades. And it’s not alone: Interferometric synthetic aperture radar (InSAR) images taken by satellites indicate that many slopes in Alaska and beyond are in motion, pointing to potential future danger.
“Not every single one, but it seems like a huge majority of [shifting slopes] are above the lower parts of thinning glaciers,” Shugar said. He described this phenomenon as “debuttressing,” as in losing the glacial buttress holding a slope up. He added, “I think in the next 5 years or so, we’ll probably have a much better understanding of just how and how quickly slopes respond to that debuttressing.”
Threats, Hazards, and Climate Change
“We were unbelievably lucky that the [tsunami] occurred with the timing that it did, and not 5 hours later.”
Most tsunamis are set in motion by earthquakes and travel across the open ocean, wreaking their destruction when they reach shallower water near coasts; the word “tsunami” means “harbor wave” in Japanese. The Tracy Arm tsunami joined the ranks of other landslide-driven tsunamis, like the ones in Taan Fiord (Alaska) and Dixon Fjord (Greenland), in being linked to human-driven climate change. Beyond the immediate impact of the waves, this category of hazard requires rethinking potential risks from abrupt catastrophes like debuttressing as well as slower effects such as sea level rise.
“The risk to any particular cruise ship [from a tsunami] on any particular day is very low,” Shugar said. “We were unbelievably lucky that the [tsunami] occurred with the timing that it did, and not 5 hours later. The risk certainly still could be increasing as we build new settlements, new mining camps, or new oil and gas infrastructure.”
Both Shugar and Stearns highlighted the importance of learning lessons from Tracy Arm and related events.
“Climate is a threat multiplier, and the research is really forcing us to look at these cascading hazards,” Stearns said. Tracy Arm “is one example of this: Small slow changes can trigger big events. Hopefully, we don’t need so many disasters to spur some change.”
A drone video shows Sawyer Island in the Tracy Arm Fjord and evidence of the tsunami on the fjord walls. Credit: Bill Billmeier
This aerial photo shows the north side of Alaska’s Tracy Arm Fjord in the aftermath of the 2025 landslide and tsunami. The lighter-colored rock is the exposed surface, where the mountainside collapsed and fell into the water. The foot of South Sawyer Glacier is visible at lower right; in decades past, the ice extended much farther and was thick enough to hold the rock slopes in place. Credit: Cyrus Read/U.S. Geological Survey