Normal view

  • ✇Eos
  • How Einstein’s Lost Theory Could Help Us Find Minerals Bill Morris
    Albert Einstein postulated in his 1905 theory of special relativity that the speed of light in a vacuum is constant. Ever since, that’s been one of the fundamental assumptions of physics. Now Enbang Li, a physicist at the University of Wollongong in Australia, has challenged this idea by building a machine he says is capable of detecting changes in the speed of light as it crosses Earth’s surface. The findings suggest that light is, in fact, sped up by gravity, which could have implications
     

How Einstein’s Lost Theory Could Help Us Find Minerals

12 June 2026 at 12:00
An empty elevator shaft illuminated by blue light.

Albert Einstein postulated in his 1905 theory of special relativity that the speed of light in a vacuum is constant. Ever since, that’s been one of the fundamental assumptions of physics.

Now Enbang Li, a physicist at the University of Wollongong in Australia, has challenged this idea by building a machine he says is capable of detecting changes in the speed of light as it crosses Earth’s surface. The findings suggest that light is, in fact, sped up by gravity, which could have implications for Earth science applications ranging from climate monitoring to mineral resource exploration.

An Old Conundrum

The idea that light is influenced by gravity is not new. Einstein’s ideas, which were further developed with his theory of general relativity in 1915, predicted massive objects in space would bend light with their gravitational grab. This theory was famously proven in 1919 when two independent teams measured starlight passing a solar eclipse at two different points on Earth’s surface and found the results matched Einstein’s predictions.

This bending of light’s path, according to general relativity, is achieved by a warping of the space-time fabric. Under this scenario, the speed of light remains constant—it just has to travel farther as it navigates the warped space-time around celestial bodies, so to a distant observer, it appears to have been slowed.

But what if light doesn’t navigate warped space-time and actually is slowed down or sped up by the gravity of large objects?

Li pointed out that Einstein himself was not always convinced the speed of light was constant. In 1911, he wrote a paper postulating that light speed changed depending on the gravity of objects it passed by. However, “when he published his general theory,” said Li, “he just abandoned this model.”

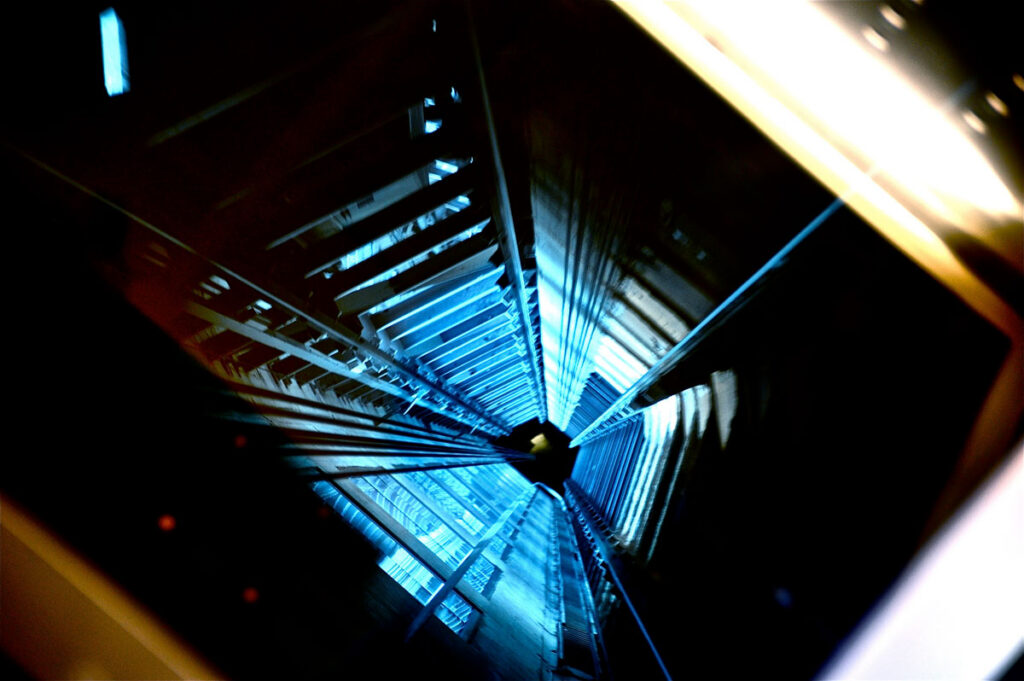
If the movement of light can be affected by gravity, Li reasoned, it might be possible to detect variations in its speed on a local level—such as an elevator shaft in a building on the campus of the University of Wollongong.

Raising the Big Issues

Gravity on Earth varies locally, depending on altitude, underground density, and topography. Gravity at the top of a tall building, for example, is measurably weaker than it is at the bottom.

With these variations in mind, Li installed an experiment in an elevator. It consisted of a coil of fiber-optic cable that if stretched out in one direction, would be 10 kilometers (6.2 miles) long. Laser beams were fired through the cables and then reflected back, thus traveling 20 kilometers (12.4 miles) before reaching an ultrafast photodetector. An oscilloscope measured the time it took for the beam to travel that distance. The experiment was run at the top of the shaft and at the bottom.

The biggest challenge, Li said, was filtering out all the surrounding environmental “noise,” such as changing temperature and humidity, electromagnetic disturbance, and building vibrations. Li designed a temperature control system, and the experiment was sealed in an enclosure with electromagnetic shielding to isolate air flows. Li ran the experiment and found light moved minutely faster at the bottom of the shaft than at the top.

Gravity Sensing on the Go

Next, Li took his research a step further by building a small, portable machine he claims can detect changes in the speed of light as it nears more gravitationally dense objects.

In this second experiment, Li positioned a moveable 72-kilogram (159-pound) weight near the machine. Light, he found, moved faster when the weight was near the machine than when it was farther away.

The results, which were published in Scientific Reports, are consistent with the variable speed of light model Einstein proposed in 1911, although Li’s preliminary results are much larger than that model predicts.

If proven, the findings would present a fundamental challenge to our understanding of both general and special relativity.

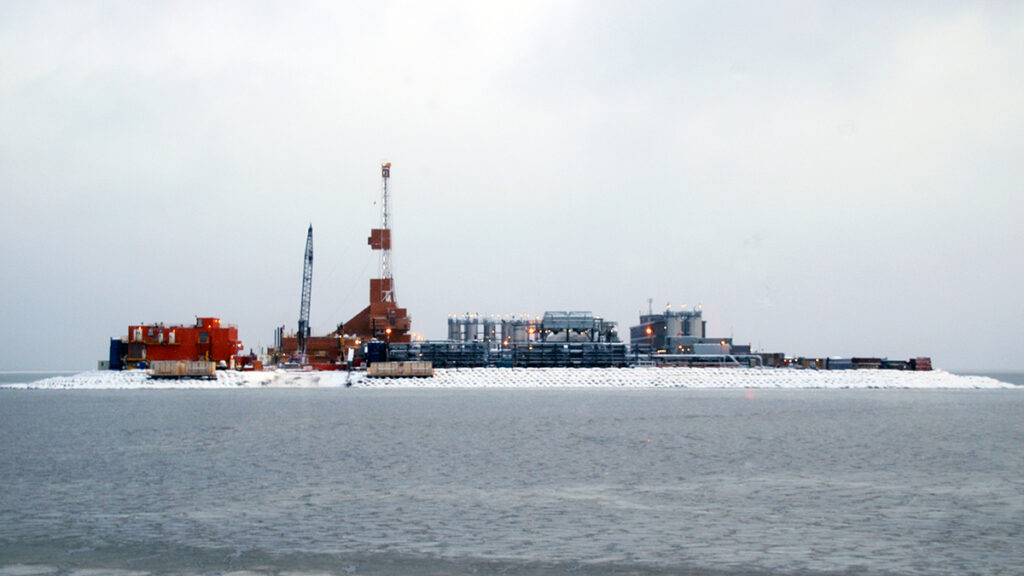
In the world of Earth sciences, they could lead to greatly improved gravity-sensing technologies. Because of their sensitivity to changes in mass, gravity sensors are used to map the seafloor and to locate underground mineral reserves. Gravity sensing can also improve our understanding of Earth’s climate as variations in the gravity field can be linked to factors like changes in ice mass and shifts in groundwater.

Currently, gravimeters are vulnerable to vibrations and movement, whereas Li’s machine, which has no moving parts, could even be used on board a plane or submarine.

“A Striking Claim”

Chris Stevens, a numerical relativist with the University of Canterbury in New Zealand, called the work “intriguing and ambitious.” While Stevens, who was not involved in the research, said that Li’s work is “well founded,” he noted that any observable effects of gravity on light on Earth would be “extraordinarily small” and therefore these results must be treated with caution.

“In my own research on observable gravitational phenomena,” he explained, “I usually require a few black holes colliding somewhere in the universe. Separating genuine gravitational signatures from environmental and instrumental noise will therefore be exceptionally demanding.”

“The work is exciting because it pushes precision photonic measurement techniques into a regime where relativistic effects may become practically useful for geophysics and sensing applications.”

Stevens said the implications of Li’s research, if validated, would be far-reaching. “The work is exciting because it pushes precision photonic measurement techniques into a regime where relativistic effects may become practically useful for geophysics and sensing applications.”

John Norton, an historian of physics at the University of Pittsburgh who was also not involved in the research, called the findings a “striking claim.” He was, however, skeptical of them, saying “if there is a coupling between light and gravity of magnitude greater than general relativity predicts, it is hard to see how the 1919 eclipse test and later studies of gravitational lensing would not have found it.”

Li acknowledged there is a long way to go before his device finds everyday use. Disentangling the intricacies of space and time, he said, is a vast challenge. “In physics, people still say gravity is a mystery. Light is another mystery. So if you put these two mysteries together, that’s going to be a giant mystery.”

—Bill Morris, Science Writer

Citation: Morris, B. (2026), How Einstein’s lost theory could help us find minerals, Eos, 107, https://doi.org/10.1029/2026EO260189. Published on 12 June 2026.
Text © 2026. The authors. CC BY-NC-ND 3.0
Except where otherwise noted, images are subject to copyright. Any reuse without express permission from the copyright owner is prohibited.
  • ✇Eos
  • This Arctic Atlas Shows Where Oil and Gas Activities Overlap with Wildlife and Indigenous Communities Grace van Deelen
    Scientists agree that to have a chance of keeping the world’s warming below the Paris Agreement limit of 1.5°C (2.7°F), humanity needs most oil, gas, and coal to remain in the ground. This “unburnable” or “unextractable” carbon would not contribute to global carbon emissions. But where, exactly, should we prioritize shutting down or banning fossil fuel activities? A new study published in PLoS One provides an answer for the Arctic with an atlas showing where oil and gas activities overlap wi
     

This Arctic Atlas Shows Where Oil and Gas Activities Overlap with Wildlife and Indigenous Communities

7 May 2026 at 13:10
Industrial facilities cover a small island, with gray-blue water in the foreground.

Scientists agree that to have a chance of keeping the world’s warming below the Paris Agreement limit of 1.5°C (2.7°F), humanity needs most oil, gas, and coal to remain in the ground. This “unburnable” or “unextractable” carbon would not contribute to global carbon emissions.

But where, exactly, should we prioritize shutting down or banning fossil fuel activities? A new study published in PLoS One provides an answer for the Arctic with an atlas showing where oil and gas activities overlap with vulnerable ecosystems, important wildlife species, and Indigenous land.

“We’re investigating the idea of unburnable carbon with a geographical perspective,” said Daniele Codato, a geographer at the Università de Padova in Italy and lead author of the new study. “We focus on where to keep oil and gas underground.”

The atlas is meant to help decisionmakers prioritize areas where it is essential to avoid opening new frontiers or where current oil and gas extraction should be halted because of social, cultural, ecological, or climate justice criteria, he said.

Overlaps, Mapped

Codato and a team of researchers created their Arctic atlas with dozens of public datasets from five Arctic polities known to have oil and gas activities (Alaska (United States), Canada, Greenland (Denmark), Norway, and Russia). Though various geographic definitions of the Arctic exist, the team chose a boundary used to evaluate wildlife and conservation by the Conservation of Arctic Flora and Fauna (the biodiversity working group of the Arctic Council, an intergovernmental organization focused on Arctic governance) to include the largest possible portion of vulnerable ecosystems.

The resulting maps revealed more than 512,000 square kilometers—an area about the size of Spain—of Arctic territory with existing or planned fossil fuel activities, including leases, areas under bid, exploration licenses, and infrastructure. Within those areas, the researchers counted 44,539 active wells and nearly 40,000 kilometers (about 25,000 miles) of pipelines.

A map of the Arctic shows oil and gas well density. The highest density of oil and gas wells is in northwestern Canada, northern Alaska, and northern Russia.
Oil and gas wells in the Arctic are highly concentrated in northwestern Canada, northern Alaska, and northern Russia. The CAFF boundary identifies the Arctic region as defined by the Conservation of Arctic Flora and Fauna (the biodiversity working group of the Arctic Council). Click image for larger version. Credit: Codato et al., 2026, https://doi.org/10.1371/journal.pone.0345775

Next, the researchers determined how oil and gas activities overlapped with protected areas defined by the International Union for Conservation of Nature and conservation priority areas defined by three other nongovernmental organizations. Fossil fuel activities threaten wildlife by altering habitats, disrupting migratory routes, and releasing pollutants.

Of the area containing oil and gas activities, more than 7% overlapped with ecologically protected areas, and more than 13% overlapped with the ranges of all of the three key Arctic species considered in the study: polar bears, yellow-billed loons, and caribou. The highest concentrations of oil and gas activities were in the Yamal Peninsula of Russia, northwestern Canada, and the North Slope of Alaska, all home to fragile ecosystems.

A map of the Arctic shows where oil and gas wells overlap with protected areas in the Arctic.
Seven percent of Arctic fossil fuel extraction areas mapped by the research team overlapped with ecologically protected areas. In some cases, such as in the Yamal`skij Nature Reserve in Russia (top right), protected area borders have been cut or delimited to avoid overlapping with protected area boundaries, possibly indicating that protected areas have been downsized or redesigned to accommodate fossil fuel infrastructure. ANWR = Arctic National Wildlife Refuge. Click image for larger version. Credit: Codato et al., 2026, https://doi.org/10.1371/journal.pone.0345775
A map of the Arctic shows where oil and gas activities overlap with the ranges of three key Arctic species: polar bears, yellow-billed loons, and caribou.
Mapping revealed that 87.21% of leases in Alaska and more than 13% of total Arctic concessions for fossil fuel activities overlapped with the ranges of all three of the key Arctic species considered in the study (polar bears (Ursus maritimus), caribou (Rangifer tarandus), and yellow-billed loons (Gavia adamsii)). Click image for larger version. Credit: Codato et al., 2026, https://doi.org/10.1371/journal.pone.0345775

The researchers also discovered that 73% of land with oil and gas activities overlapped with Indigenous Peoples’ lands, defined in the study as lands where Indigenous communities maintain significant influence over land management. Fossil fuel activities can threaten Indigenous communities’ health and ways of life, though the authors note that overlaps between Indigenous Peoples’ lands and fossil fuel activities do not necessarily indicate an opposition between the two.

A map of the Arctic shows where oil and gas activities overlap with Indigenous lands.
Oil and gas concessions cover more than 4% of Indigenous Peoples’ lands (IPLs) in the Arctic. Click image for larger version. Credit: Codato et al., 2026, https://doi.org/10.1371/journal.pone.0345775

“It’s a really interesting idea to create an atlas of unburnable carbon and try to make visible where tensions might occur between Indigenous land, ecosystems, [and fossil fuel activities],” said Mariel Kieval, a researcher at the Arctic Institute, a nonprofit research organization. The overlaps noted in the atlas are an “initial indicator” providing opportunities for further research that zooms in on specific areas, she said.

Kieval also said the atlas could be helpful for local communities trying to identify where extraction activities are occurring nearby.

Policy Paradigm

The atlas’s effort to express the urgency of action to the public and policymakers is useful, said Paul Ekins, an economist at University College London who was part of the team that coined the term “unburnable carbon.” “Any way in which atlases or discussions or slogans can up the political ante so that politicians become braver in seeking to address this issue is to be welcomed.”

In particular, Codato hopes the atlas will fuel a “paradigm shift” in global policy that would ultimately ban the proliferation of fossil fuel activities in the Arctic.

The need for an intergovernmental ban on fossil fuel activities is evidenced by the Arctic National Wildlife Refuge in Alaska, Codato said: The refuge received temporary protections against drilling under the Biden administration, but the Trump administration plans to open the refuge for oil and gas leases this summer. “We need something stronger” to avoid such administration-by-administration changes in Arctic protections, he said.

“If we don’t start to ban fossil fuels in the Arctic now, it could become another sacrifice zone.”

Such a paradigm shift will be more important than ever as warming in the Arctic provides new access to resources and opportunities for trade that may accelerate ecological and cultural disruptions. “If we don’t start to ban fossil fuels in the Arctic now, it could become another sacrifice zone,” like some parts of the Amazon rainforest, Codato said.

Policy actions have fallen far behind the science, Ekins said. “There should have been an agreement not to exploit fossil fuels in the Arctic well before the ice had melted to a sufficient extent to make that a practical possibility.”

In 2023, the research team published a similar atlas identifying unburnable carbon in the Ecuadorian Amazon and plans to continue to expand their atlas to include the rest of the world. The team is currently working on projects that cover Brazil, Italy, Nigeria, and the United Kingdom.

Codato said he hoped the Arctic atlas would inform discussions to update the European Union’s Arctic policy that are scheduled to occur this year.

—Grace van Deelen (@gvd.bsky.social), Staff Writer

Citation: van Deelen, G. (2026), This Arctic atlas shows where oil and gas activities overlap with wildlife and Indigenous communities, Eos, 107, https://doi.org/10.1029/2026EO260139. Published on 7 May 2026.
Text © 2026. The authors. CC BY-NC-ND 3.0
Except where otherwise noted, images are subject to copyright. Any reuse without express permission from the copyright owner is prohibited.
  • ✇Ontario Nature Blog
  • Protecting West Lake: Community Stewardship with a Collaborative GIS Project Ontario Nature Staff
    Like many regions across Ontario, West Lake in Prince Edward County is experiencing altered shorelines, habitat fragmentation, and growing development pressure. The 1,903-hectare lake is bordered by the largest freshwater baymouth barrier dune system in the world, found within Sandbanks Provincial Park. West Lake contains a large provincially significant wetland and is home to at least 35 species at risk. West Lake Community Association (WLCA) is a volunteer non-profit that was formed to engag
     

Protecting West Lake: Community Stewardship with a Collaborative GIS Project

26 February 2026 at 19:29

Like many regions across Ontario, West Lake in Prince Edward County is experiencing altered shorelines, habitat fragmentation, and growing development pressure. The 1,903-hectare lake is bordered by the largest freshwater baymouth barrier dune system in the world, found within Sandbanks Provincial Park. West Lake contains a large provincially significant wetland and is home to at least 35 species at risk.

West Lake Community Association (WLCA) is a volunteer non-profit that was formed to engage residents and visitors of the small community with the aim of preserving its uniqueness and protecting West Lake’s biodiverse and fragile ecosystems. WLCA is a member of Ontario Nature’s Nature Network.

Understanding the Threats to West Lake

WLCA and Ontario Nature began a collaborative project with a fundamental question: where is the most vulnerable habitat around West Lake? Several major threats are impacting the ecosystems in and around the lake, including shoreline erosion and development pressure. Parts of West Lake are being choked out by rapidly spreading invasive aquatic vegetation. These threats are affecting a variety of species at risk in the area, including Blanding’s turtle, monarch butterfly and bobolink.

Bobolink, Threatened, Species at Risk, Species at Risk in Ontario
Bobolink © David Watkins

Creating Habitat Suitability Models for Species at Risk in West Lake

Through a collaborative effort to identify where species are most vulnerable in West Lake, partners created habitat suitability models to show where important habitat exists and where habitat restoration and stewardship efforts may be needed.

Selecting Species for Our Models

Our project chose four “representative species” whose habitat needs overlap with those of many other plants and animals in the area: butternut, Eastern meadowlark, Eastern musk turtle and pugnose shiner. These species were selected because together they represent a range of terrestrial and aquatic habitat needs. When the models for these four species were combined, it highlighted these specific vulnerable habitats: healthy woodlands that support butternut, open meadows and fields used by Eastern meadowlark, wetlands and shorelines that are needed by Eastern musk turtles, and clean, vegetated water where pugnose shiner live.

Model of suitable habitat for a variety of species in West Lake, Ontario (green indicates the most ideal habitat).

Identifying Important Habitat for Protection and Restoration

Much of the ideal habitat was near the provincially significant West Lake Wetland, along shorelines in the northeast corner of the lake, and within Sandbanks Provincial Park. These areas may represent priority locations where habitat restoration and conservation efforts could be focused.

Sharing the Importance of West Lake with an Interactive Story Map

Engaging with the community and sharing knowledge about West Lake was another goal of the project. WLCA works to encourage interest and engagement among residents to help preserve the uniqueness of the West Lake watershed. They have hosted numerous educational workshops and events, including an annual Environmental Symposium, creating signage to raise awareness of the West Lake Wetland, and partnered with Water Rangers on their Youth Engagement project to train youth on water quality monitoring.

West Lake Community Association and Ontario Nature have published an interactive StoryMap to learn about threats to its ecosystems and recent stewardship projects.

Through collaboration, partners have created the West Lake StoryMap, an interactive mapping tool that blends maps and images to share information about West Lake’s history and ecology. The West Lake StoryMap allows residents and visitors to:

  • Discover the history of West Lake
  • Identify threats to its ecosystems
  • Explore areas vulnerable to flooding, erosion and other natural hazards
  • Learn about actions WLCA has taken to steward West Lake

By bringing together community perspectives and spatial analyses, the West Lake community has a clear picture of what makes this place special and what threatens its ecosystems. These tools are intended to inspire residents and visitors to get involved in the conservation and protection of West Lake, through shoreline restoration, invasive species removal or by simply learning more about the species that call this area home. With this StoryMap and the continued leadership of the West Lake Community Association, everyone can play a part in keeping West Lake in Prince Edward County healthy for generations to come.

Wetlands and dunes, Sandbanks Provincial Park, West Lake, Prince Edward County
Wetlands and dunes, Sandbanks Provincial Park, West Lake © John Brebner

Contact Us

If you or your organization are interested in exploring a conservation or habitat modelling project in Ontario like this, please reach out to Graeme Smith by email at graemes@ontarionature.org or by submitting a request form.


By Graeme Smith and Cathie Coultis

Graeme Smith is the GIS Coordinator at Ontario Nature. He has completed a B.Sc. in biology at Laurentian University and a M.Sc. in environmental and life sciences at Trent University. In his spare time, he enjoys reading, playing board games and exploring the outdoors.

Cathie Coultis is the Chair and Co-Founder of West Lake Community Association. She lives in the hamlet of West Lake with her husband and family dog, enjoys kayaking, cycling, bird watching, gardening, snowshoeing and being active in their rural community.

  • ✇Eos
  • Tree Lines Are Migrating. Some Up, Some Down. Emily Gardner
    As the climate warms, tree lines are generally understood to move up, because regions that were previously too cold for trees to survive now have higher, more tree friendly temperatures. A tree line is clearly visible in the Swiss National Park, in Graubünden, Switzerland. Credit: Sabine Rumpf, University of Basel This migration can be seen in these images of Canada’s Waterton Lakes National Park… Rising tree lines are visible in Canada’s Waterton Lakes National Park,
     

Tree Lines Are Migrating. Some Up, Some Down.

12 May 2026 at 13:08
A clear tree line is visible on a mountain range.

As the climate warms, tree lines are generally understood to move up, because regions that were previously too cold for trees to survive now have higher, more tree friendly temperatures.

A tree line is clearly visible in the Swiss National Park, in Graubünden, Switzerland. Credit: Sabine Rumpf, University of Basel

This migration can be seen in these images of Canada’s Waterton Lakes National Park…

Rising tree lines are visible in Canada’s Waterton Lakes National Park, seen here in 1913 (left) and 2007 (right). Credit: Mountain Legacy Project

…and of Jackson Glacier in Montana’s Glacier National Park, for example.

A black-and-white image shows a glacier in a mountain pass.
Jackson Glacier, in Montana’s Glacier National Park, is seen here in 1912 and 2009. As the climate has warmed, the glacier has receded significantly, and tree lines have risen. Credit: MJ Elrod, U of M Library–9/3/2009, L McKeon, USGS

But new research, published in the International Journal of Applied Earth Observation and Geoinformation, paints a more complicated picture: Between 2000 and 2020, 42% of tree lines shifted up, true. But 25% of them actually moved downhill.

Sabine Rumpf, an ecologist at the University of Basel in Switzerland, said many studies of tree line shifts tend to be concentrated in limited geographic areas. A preponderance are based primarily on data from North America, Europe, and the Himalayas, where researchers are more likely to have funding to head to the field to take measurements themselves.

“But that also means that a large proportion of the surface of our planet is so understudied,” Rumpf said. “And [to remedy] that, remote sensing data [are] really amazing because you can get a truly global picture, even though there’s nobody, or too few people, observing things in the field.”

Tree Lines Aren’t Living up to Their Potential

So the team set out to take a more global look. They used a world mountain map, developed in 2018, with a 250-meter resolution. They did exclude some regions from their analysis: cells with less than 10% high-mountain coverage (which have so few trees that they don’t have much of a tree line) and cells more than 95% covered with trees (which have so many trees that they don’t have much of a tree line). For their purposes, the team defined the “observed tree line” as the upper limit of trees that stand 3 meters or taller.

Then, said Rumpf, they used a model to calculate the potential tree lines for each area, because, thanks to human effects on the environment, “where these trees could be surviving is almost always higher than where the trees are currently.” The model looked at the growing season length and mean growing season temperature for each cell in the map’s grid. The researchers determined that if a cell had a growing season length of 94 days or longer, and an average growing season temperature of 6.4°C or higher, it could potentially host trees. Cells that didn’t meet both criteria were considered unable to be covered in forest, and thus above the potential tree line.

With this model, “you can calculate based on climatic data where trees could potentially occur or not occur, even though they might not be there in the field,” Rumpf said. “It’s actually super simple. And that’s the beauty of it.”

Credit: Sabine Rumpf, University of Basel

Jordon Tourville, a terrestrial ecologist with the Appalachian Mountain Club, said the overall findings are not surprising, because other studies have shown seemingly “paradoxical downslope shifts in some cases.” But he noted that whereas this study estimated potential tree lines based on temperature constraints, some scientists have suggested that factors such as nutrient availability and wind exposure are also important in determining tree line position.

Unsurprising, on Second Thought

In areas with more human disturbance, the upward spread of trees is suppressed, or even reversed.

Armed with this information about observed versus potential tree lines, the researchers hypothesized that areas with the smallest deviation between the two were mostly responding to climatic factors. In contrast, they speculated, areas with a greater difference between observed and potential tree lines were likely experiencing more anthropogenic disturbance, such as logging, agriculture, and infrastructure development.

Their hypothesis held up. In areas with less human disturbance, tree lines were moving upward more quickly (the researchers noted, though, that the upward migration of tree lines lagged behind the rate of climate change). In areas with more human disturbance, the upward spread of trees is suppressed, or even reversed.

Fire played a big role in tree line shifts as well: The researchers found that 38% of the downslope shifts were linked to fire events. Wildfires played a particularly big role in western North America and Alaska.

Wildfires played a particularly large role in the downward shift of tree lines in western North America. Here, a tree line is visible in California’s Little Lakes Valley. Credit: mlhradio/Flickr, CC BY-NC 2.0
Blue circle with white text reading "Visit Teach the Earth for classroom activities to pair with this ENGAGE article." "Teach the Earth" is a logo with lines and triangles depicting mountains above the words and a shape denoting waves below them.

Rumpf and several of her colleagues are located in the Alps, where glaciers are retreating, tree lines are climbing, and towns are generally more threatened by mudslides than by wildfires.

Some of the study’s findings, like a quarter of tree lines shifting down, or such a clear signal from wildfires in some areas, were at first unexpected. But after some reflection, Rumpf realized the diversity of data was a perfect example of why global-scale research is important.

“A lot of scientific funding is based in North America and Europe,” Rumpf said, which means many studies return similar results. “Then we do something global and we are surprised that things are different somewhere else on the globe?… I mean, well, duh.”

—Emily Gardner (@emfurd.bsky.social), Associate Editor

This news article is included in our ENGAGE resource for educators seeking science news for their classroom lessons. Browse all ENGAGE articles, and share with your fellow educators how you integrated the article into an activity in the comments section below.

Citation: Gardner, E. (2026), Tree lines are migrating. Some up, some down., Eos, 107, https://doi.org/10.1029/2026EO260146. Published on 12 May 2026.
Text © 2026. The authors. CC BY-NC-ND 3.0
Except where otherwise noted, images are subject to copyright. Any reuse without express permission from the copyright owner is prohibited.
  • ✇Eos
  • New USGS Tool Fills in the Gaps on U.S. Water Supply Emily Dieckman
    Research & Developments is a blog for brief updates that provide context for the flurry of news that impacts science and scientists today. In the contiguous United States, crop irrigation, municipal water supplies, and thermoelectric power generation use more than 224 billion gallons of fresh water every day. Conducting water research or making decisions about water use, until now, often required referencing datasets across various agencies. The U.S. Geological Survey (USGS) National
     

New USGS Tool Fills in the Gaps on U.S. Water Supply

29 April 2026 at 16:27
A bridge crosses a river beneath a relatively short waterfall. A city skyline is on the other side of the river.

Research & Developments is a blog for brief updates that provide context for the flurry of news that impacts science and scientists today.

In the contiguous United States, crop irrigation, municipal water supplies, and thermoelectric power generation use more than 224 billion gallons of fresh water every day. Conducting water research or making decisions about water use, until now, often required referencing datasets across various agencies. The U.S. Geological Survey (USGS) National Water Availability Assessment Data Companion (NWDC), announced this week, aims to streamline this process. In part, the tool is designed to help decisionmakers better understand the balance between how high demand and limited supply affect water availability in their communities.

“While the United States has abundant water nationally, regional imbalances between supply and demand may create water challenges affecting millions of Americans,” said lead scientist Shirley Leung in a USGS press release. “What once required significant resources and time can now be done in minutes, giving communities of all sizes the same foundation for water planning.”

The lower 48 states are home to about 80,000 sub-watersheds, from those in the arid southwest to the Great Lakes Basin, where about 84% of North America’s surface fresh water is located. According to the USGS, the NWDC is the first tool that integrates information about water availability in individual watersheds at a national scale.

The tool is designed to complement Water Data for the Nation (WDFN), another USGS product that consolidates observational data from the agency’s thousands of local monitoring stations gathering data on streams, lakes, reservoirs, precipitation, water quality, and groundwater. The new tool uses modeling to fill in spatial and temporal gaps between the observations made at these stations.

Water managers, researchers, agricultural experts, and others can use the NWDC to compare watershed conditions, identify seasonal patterns in water use, or to create data visualizations of statewide water use, for example. Though the tool currently covers only the contiguous United States, it will soon be extended to Alaska, Hawaii, and Puerto Rico, according to the USGS.

David Tarboton, a professor of civil engineering at the Utah Water Research Laboratory, said he was “intrigued” by the new tool, and is interested in examining the data its model produces. 

While Tarboton was disappointed that the tool’s most recent available data are from 2020, “having a sort of integrated, wall-to-wall dataset that’s consistently produced is very valuable,” he said. He works, in part, in the areas of hydroinformatics and data sharing, and noted that the modern methods the agency is using to share the data could be useful in developing automated tools.

—Emily Gardner (@emfurd.bsky.social), Associate Editor

These updates are made possible through information from the scientific community. Do you have a story about science or scientists? Send us a tip at eos@agu.org.

A photo of a hand holding a copy of an issue of Eos appears in a circle over a field of blue along with the Eos logo and the following text: Support Eos’s mission to broadly share science news and research. Below the text is a darker blue button that reads “donate today.”
Text © 2026. AGU. CC BY-NC-ND 3.0
Except where otherwise noted, images are subject to copyright. Any reuse without express permission from the copyright owner is prohibited.
❌
Subscriptions