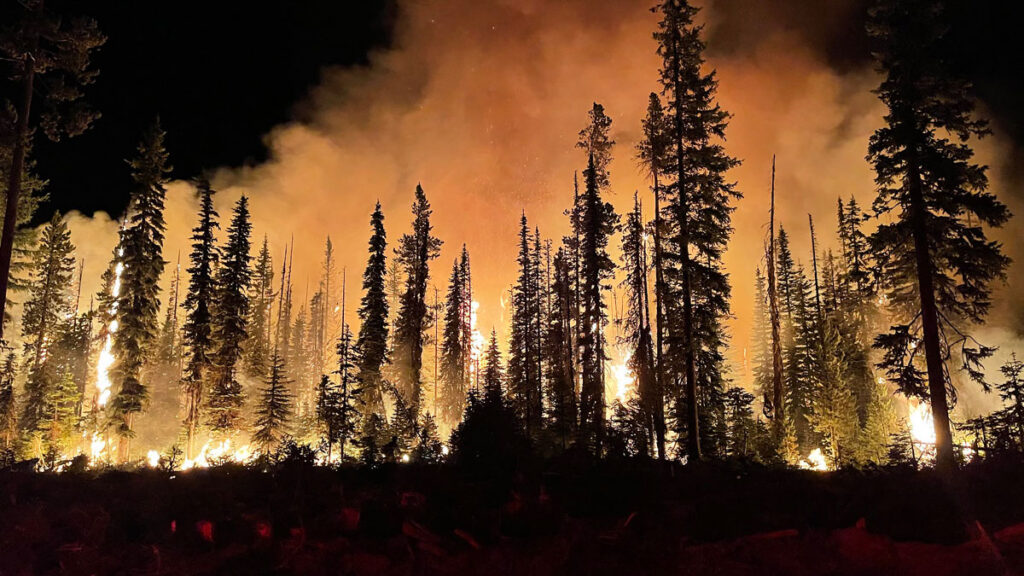
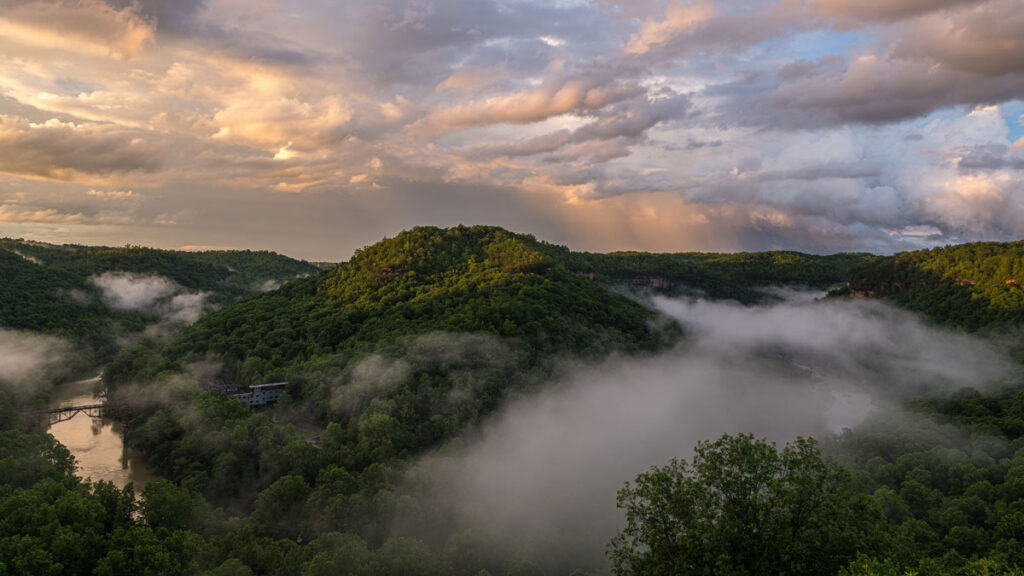
A warm, dry spring has set the stage for above-average significant wildland fire risk across much of the southern and western United States this summer, and no part of the United States will have below-average fire potential through the end of August.
“It’s not necessarily a foregone conclusion that we’re going to have a really busy season, but everything is pointing that way.”
These predictions are part of a 4-month outlook produced monthly by the National Interagency Fire Center (NIFC), a group of wildland fire experts from eight federal agencies that coordinates wildland fire resources across the country.
The most recent outlook, published 1 May, projects the likelihood of significant fires (defined as those that require an NIFC response) from May to August using long-term forecasts from NOAA’s Climate Prediction Center, current precipitation and drought conditions, and an assessment of the fuels available in different regions (like grasses, brush, and timber).
This year, 1,848,210 acres across the country have already burned—nearly twice the annual average over the past 10 years.
“It’s not necessarily a foregone conclusion that we’re going to have a really busy season, but everything is pointing that way,” said Jim Wallmann, a meteorologist for the U.S. Forest Service at the NIFC and one of the outlook’s authors.
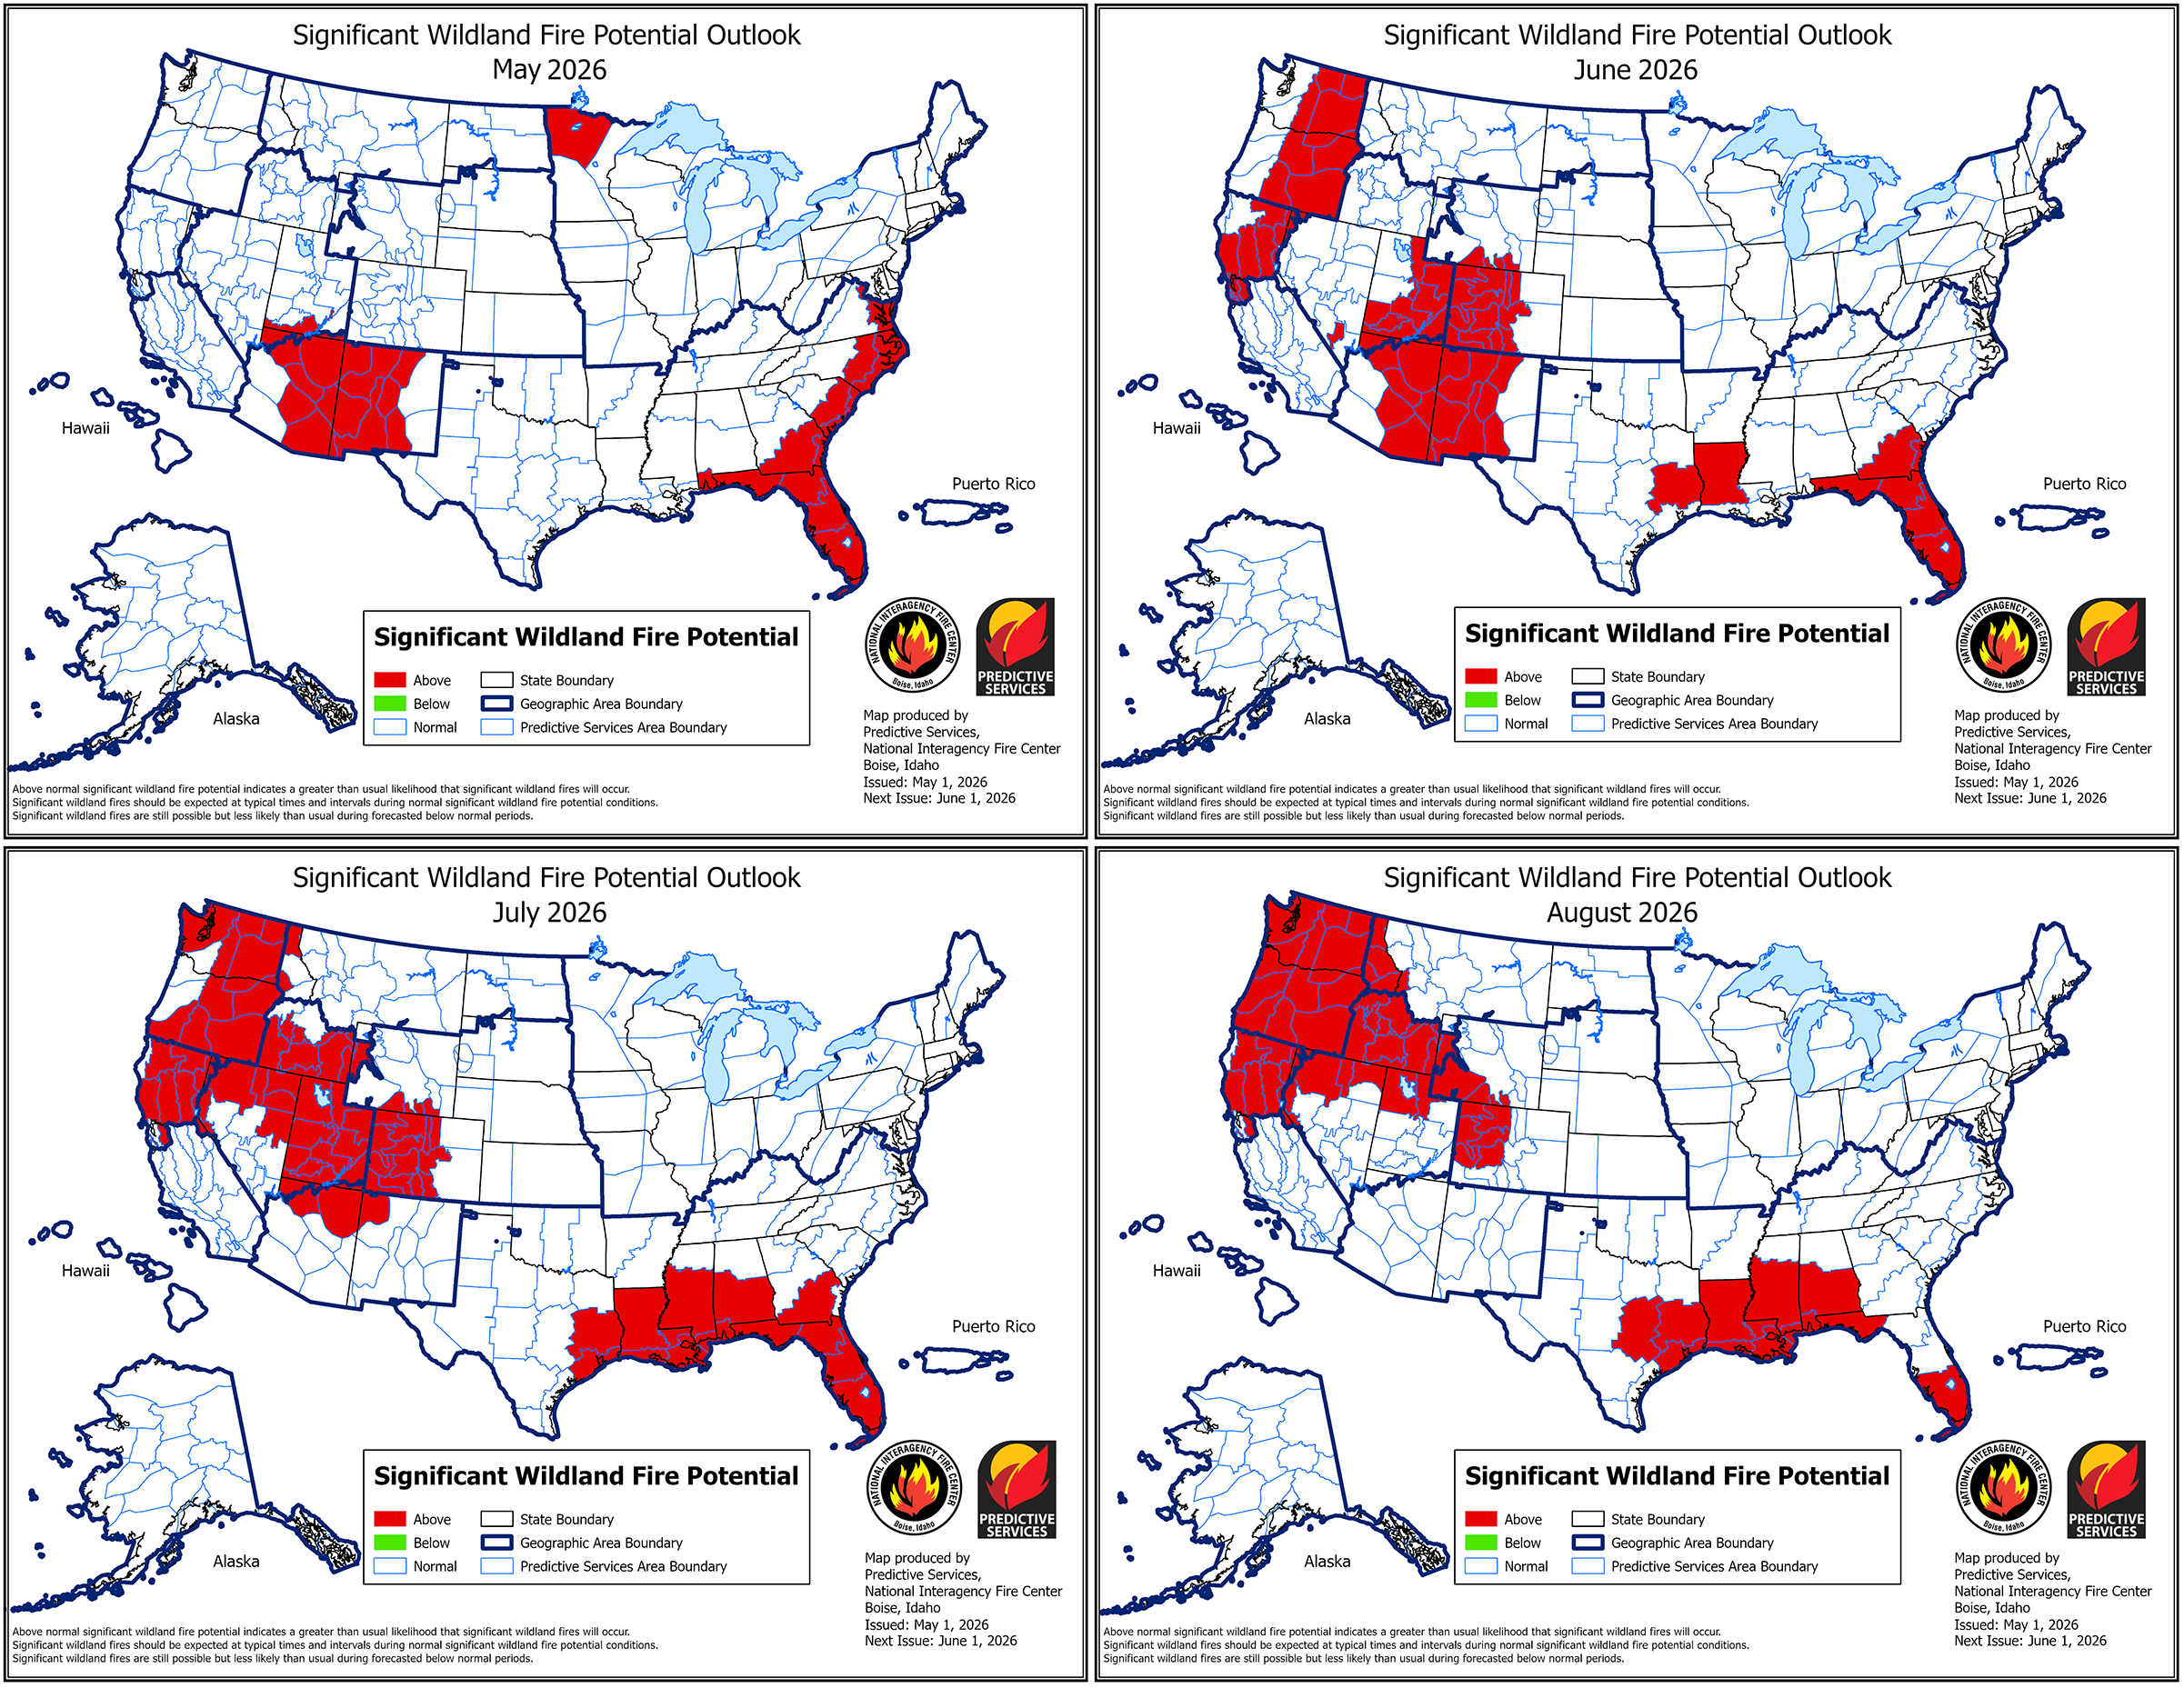
Significant wildland fire potential will be elevated across much of the West and Southeast this summer. Click image for larger version. Credit: National Interagency Coordination Center, Public Domain
Drought in the West
In the West, wildfire season typically peaks in late summer. This most recent outlook predicts an above-average significant fire potential for much of the West as the season peaks.
In May, the above-average risk is concentrated in eastern Arizona and western New Mexico, though that risk fades to normal by August as the Southwest’s monsoon season begins. In June, the above-average risk extends to western Colorado and parts of the Pacific Northwest. In July and August, that risk covers much of the Northwest, including Utah, Idaho, Oregon, Washington, and Northern California.
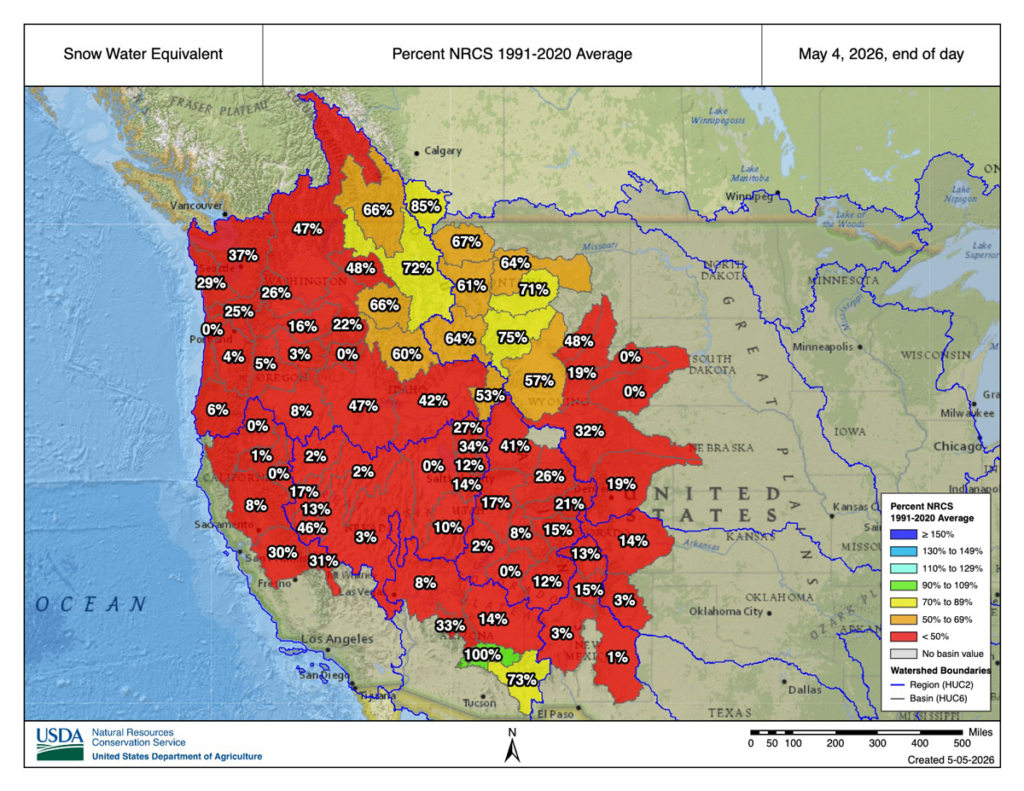
Above-average spring temperatures and a far-below-normal snowpack across the West are contributing to the elevated risk in Washington, Oregon, Idaho, and Northern California, in particular. Many river basins across the West contain less than 20% of their normal amount of snow, and some are already snow-free at all observed locations due to melting caused by warm temperatures in March.
As of May, many river basins in the West have a snow water equivalent—the amount of water held in their current snowpack—that is less than 50% (in red) of the 1991–2020 average level. Credit: USDA Natural Resources Conservation Service, Public Domain
“The snowpack being lower this time of year, and melting out, affects the soil moisture throughout the rest of the summer, which then affects the fuel moistures,” said Craig Clements, a meteorologist at San Jose State University’s Fire Weather Research Laboratory who was not involved in the outlook. Early snowmelt also uncovers fuels, like pine needles and leaf litter, that would typically be under snow, exposing them to the air to dry and catch fire.
Southern California and the Sierra Nevada mountain range, though, remain at an average significant fire risk throughout the summer, as a result of higher-than-average precipitation earlier in the year.
The Southeast and Beyond
Fire risk will also be elevated in the Southeast this summer. Florida, for example, remains at an above-average significant fire potential through the end of August. Southern Georgia, Mississippi, Louisiana, Arkansas, and the eastern halves of Virginia, North Carolina, and South Carolina will also have above-average significant fire potential.
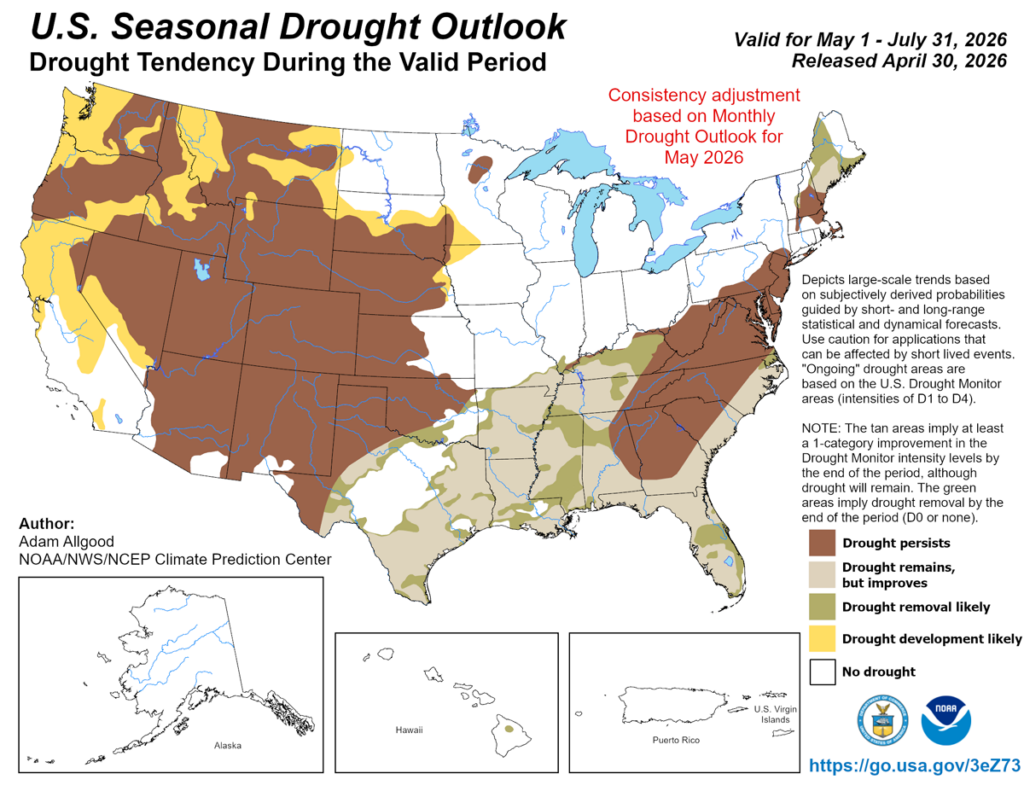
The above-average risk is fueled, in part, by a worsening drought affecting the Southeast alongside the drought in the West. As of 1 May, nearly 63% of the country was experiencing drought, and 19% of the country was experiencing extreme or exceptional drought, according to the U.S. Drought Monitor.
The Midwest and the Northeast will remain at an average significant fire potential from May to August, though northwestern Minnesota faces an above-average potential in May.
No place in the United States is projected to have a below-average significant fire potential through the end of August.
Preparing Amid Uncertainty
A developing El Niño—a climate phenomenon that affects heat storage in the ocean—could alter the fire risk projections. Scientists expect that a strong El Niño could lead to a below-normal hurricane season, worsening drought in the Southeast. In the Pacific, a strong El Niño could intensify the hurricane season, which may lower wildfire risk.
However, a stronger El Niño could drive more lightning strikes in the Sierra Nevada, which could increase fire risk there, Clements said. In 2020, for example—a strong El Niño year—Hurricane Elida in the Pacific contributed to a lightning outbreak that supercharged wildfires in the West.
“We’re still not sure exactly how [El Niño] is going to impact the season.”
“We’re still not sure exactly how [El Niño] is going to impact the season,” Wallmann said. As late summer approaches, meteorologists will better understand how El Niño will develop and affect wildfire risk.
Weather patterns can change, and day-to-day conditions still play a role in fire occurrence. “If the weather shifts, or we get a really big heat wave, it can modify [the forecast]. Or if it remains relatively moderate, that might lessen the fire danger,” Clements said. “We’ll just have to see how the weather plays out.”
Wallmann and Clements emphasized that those living in areas with elevated fire risk should be aware of their surroundings and think ahead about where they might go for safety should a wildfire occur. “Having that situational awareness ahead of time can help you make better decisions,” Wallmann said.
Citation: van Deelen, G. (2026), Most of the U.S. West will face above-normal wildfire risk this summer, Eos, 107, https://doi.org/10.1029/2026EO260145. Published on 11 May 2026.
Scientists agree that to have a chance of keeping the world’s warming below the Paris Agreement limit of 1.5°C (2.7°F), humanity needs most oil, gas, and coal to remain in the ground. This “unburnable” or “unextractable” carbon would not contribute to global carbon emissions.
But where, exactly, should we prioritize shutting down or banning fossil fuel activities? A new study published in PLoS One provides an answer for the Arctic with an atlas showing where oil and gas activities overlap with vulnerable ecosystems, important wildlife species, and Indigenous land.
“We’re investigating the idea of unburnable carbon with a geographical perspective,” said Daniele Codato, a geographer at the Università de Padova in Italy and lead author of the new study. “We focus on where to keep oil and gas underground.”
The atlas is meant to help decisionmakers prioritize areas where it is essential to avoid opening new frontiers or where current oil and gas extraction should be halted because of social, cultural, ecological, or climate justice criteria, he said.
Overlaps, Mapped
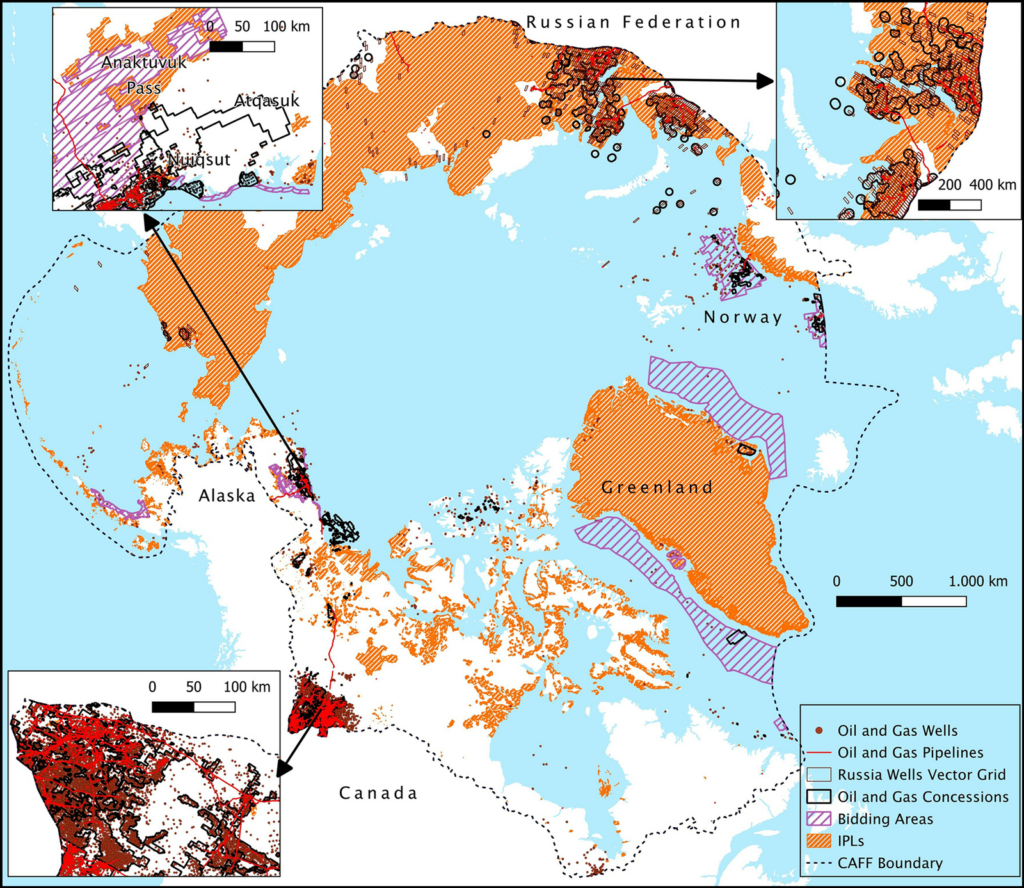
Codato and a team of researchers created their Arctic atlas with dozens of public datasets from five Arctic polities known to have oil and gas activities (Alaska (United States), Canada, Greenland (Denmark), Norway, and Russia). Though various geographic definitions of the Arctic exist, the team chose a boundary used to evaluate wildlife and conservation by the Conservation of Arctic Flora and Fauna (the biodiversity working group of the Arctic Council, an intergovernmental organization focused on Arctic governance) to include the largest possible portion of vulnerable ecosystems.
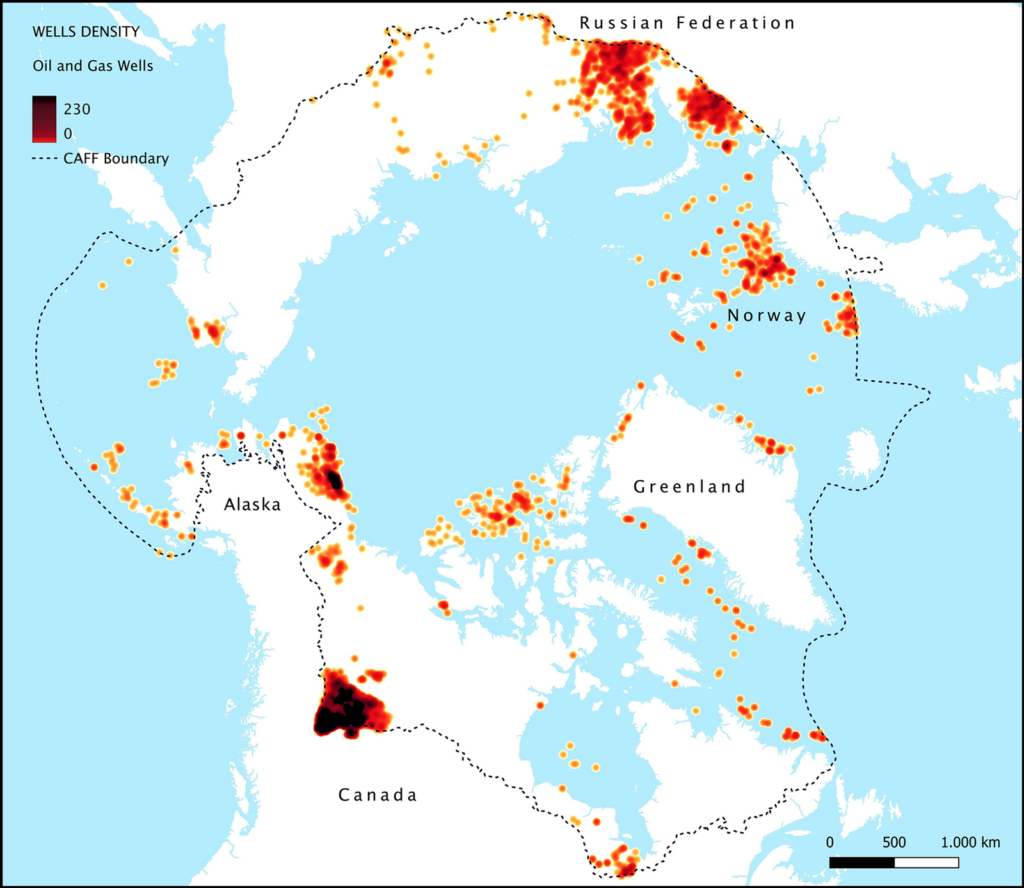
The resulting maps revealed more than 512,000 square kilometers—an area about the size of Spain—of Arctic territory with existing or planned fossil fuel activities, including leases, areas under bid, exploration licenses, and infrastructure. Within those areas, the researchers counted 44,539 active wells and nearly 40,000 kilometers (about 25,000 miles) of pipelines.
Oil and gas wells in the Arctic are highly concentrated in northwestern Canada, northern Alaska, and northern Russia. The CAFF boundary identifies the Arctic region as defined by the Conservation of Arctic Flora and Fauna (the biodiversity working group of the Arctic Council). Click image for larger version. Credit: Codato et al., 2026, https://doi.org/10.1371/journal.pone.0345775
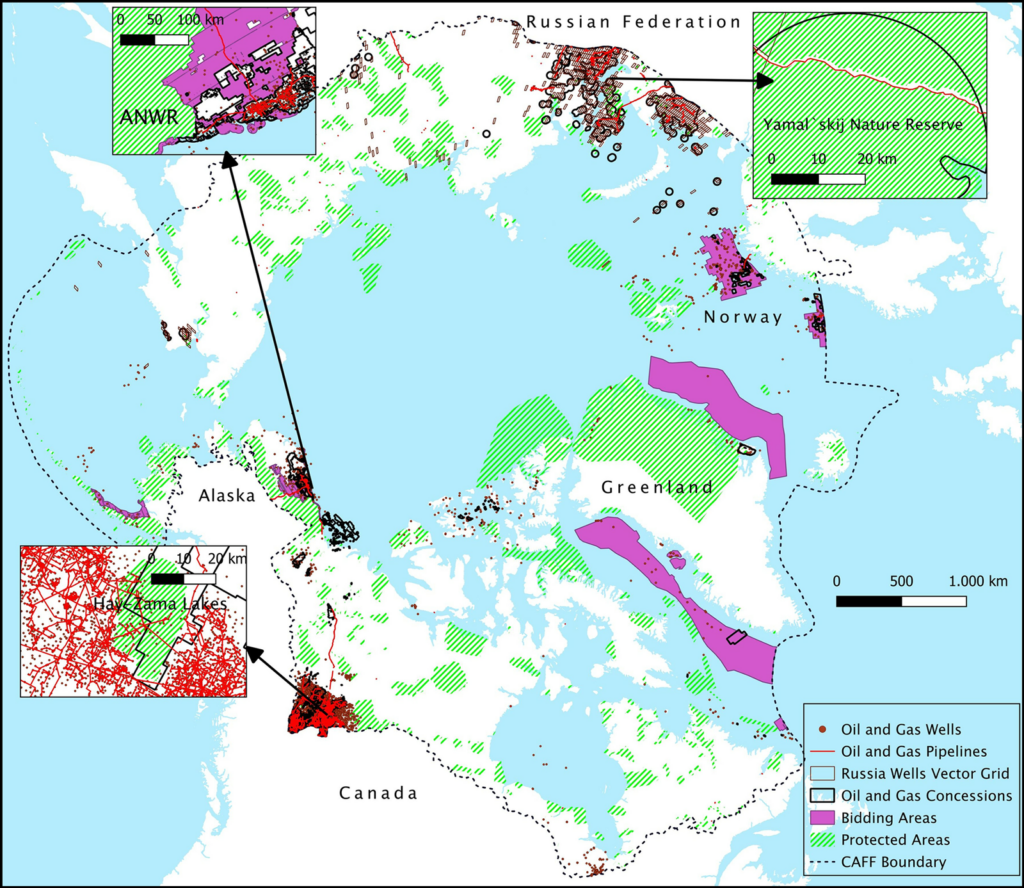
Next, the researchers determined how oil and gas activities overlapped with protected areas defined by the International Union for Conservation of Nature and conservation priority areas defined by three other nongovernmental organizations. Fossil fuel activities threaten wildlife by altering habitats, disrupting migratory routes, and releasing pollutants.
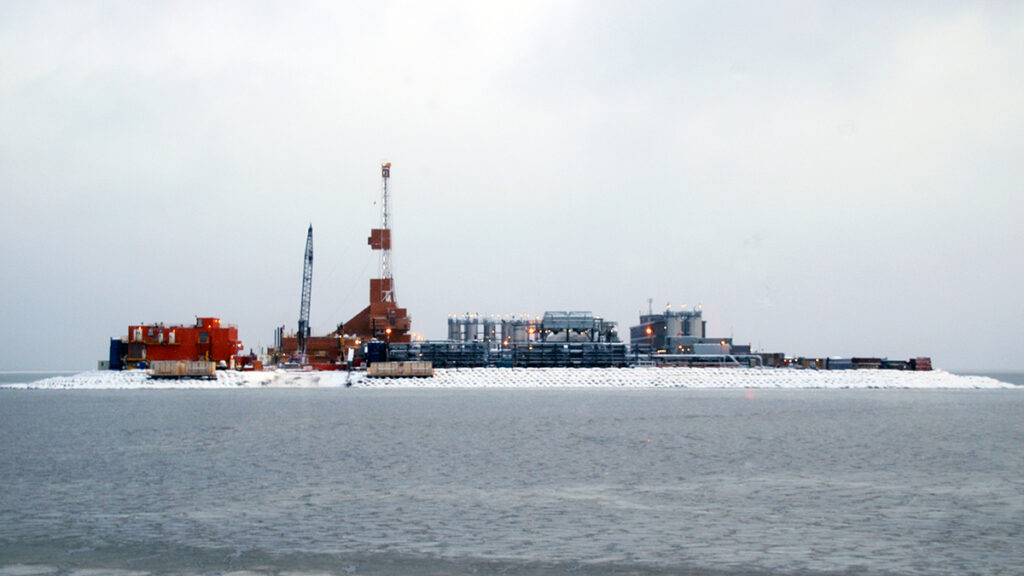
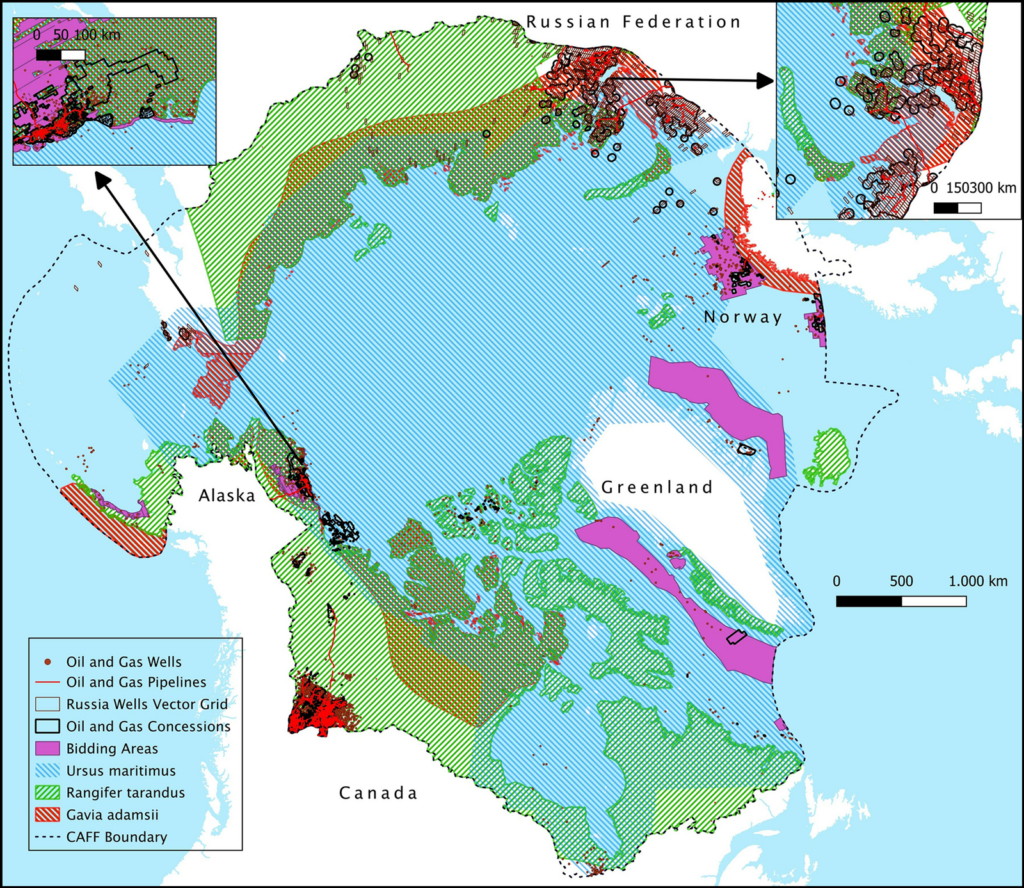
Of the area containing oil and gas activities, more than 7% overlapped with ecologically protected areas, and more than 13% overlapped with the ranges of all of the three key Arctic species considered in the study: polar bears, yellow-billed loons, and caribou. The highest concentrations of oil and gas activities were in the Yamal Peninsula of Russia, northwestern Canada, and the North Slope of Alaska, all home to fragile ecosystems.
Seven percent of Arctic fossil fuel extraction areas mapped by the research team overlapped with ecologically protected areas. In some cases, such as in the Yamal`skij Nature Reserve in Russia (top right), protected area borders have been cut or delimited to avoid overlapping with protected area boundaries, possibly indicating that protected areas have been downsized or redesigned to accommodate fossil fuel infrastructure. ANWR = Arctic National Wildlife Refuge. Click image for larger version. Credit: Codato et al., 2026, https://doi.org/10.1371/journal.pone.0345775
Mapping revealed that 87.21% of leases in Alaska and more than 13% of total Arctic concessions for fossil fuel activities overlapped with the ranges of all three of the key Arctic species considered in the study (polar bears (Ursus maritimus), caribou (Rangifer tarandus), and yellow-billed loons (Gavia adamsii)). Click image for larger version. Credit: Codato et al., 2026, https://doi.org/10.1371/journal.pone.0345775
The researchers also discovered that 73% of land with oil and gas activities overlapped with Indigenous Peoples’ lands, defined in the study as lands where Indigenous communities maintain significant influence over land management. Fossil fuel activities can threaten Indigenous communities’ health and ways of life, though the authors note that overlaps between Indigenous Peoples’ lands and fossil fuel activities do not necessarily indicate an opposition between the two.
Oil and gas concessions cover more than 4% of Indigenous Peoples’ lands (IPLs) in the Arctic. Click image for larger version. Credit: Codato et al., 2026, https://doi.org/10.1371/journal.pone.0345775
“It’s a really interesting idea to create an atlas of unburnable carbon and try to make visible where tensions might occur between Indigenous land, ecosystems, [and fossil fuel activities],” said Mariel Kieval, a researcher at the Arctic Institute, a nonprofit research organization. The overlaps noted in the atlas are an “initial indicator” providing opportunities for further research that zooms in on specific areas, she said.
Kieval also said the atlas could be helpful for local communities trying to identify where extraction activities are occurring nearby.
Policy Paradigm
The atlas’s effort to express the urgency of action to the public and policymakers is useful, said Paul Ekins, an economist at University College London who was part of the team that coined the term “unburnable carbon.” “Any way in which atlases or discussions or slogans can up the political ante so that politicians become braver in seeking to address this issue is to be welcomed.”
In particular, Codato hopes the atlas will fuel a “paradigm shift” in global policy that would ultimately ban the proliferation of fossil fuel activities in the Arctic.
The need for an intergovernmental ban on fossil fuel activities is evidenced by the Arctic National Wildlife Refuge in Alaska, Codato said: The refuge received temporary protections against drilling under the Biden administration, but the Trump administration plans to open the refuge for oil and gas leases this summer. “We need something stronger” to avoid such administration-by-administration changes in Arctic protections, he said.
“If we don’t start to ban fossil fuels in the Arctic now, it could become another sacrifice zone.”
Such a paradigm shift will be more important than ever as warming in the Arctic provides new access to resources and opportunities for trade that may accelerate ecological and cultural disruptions. “If we don’t start to ban fossil fuels in the Arctic now, it could become another sacrifice zone,” like some parts of the Amazon rainforest, Codato said.
Policy actions have fallen far behind the science, Ekins said. “There should have been an agreement not to exploit fossil fuels in the Arctic well before the ice had melted to a sufficient extent to make that a practical possibility.”
In 2023, the research team published a similar atlas identifying unburnable carbon in the Ecuadorian Amazon and plans to continue to expand their atlas to include the rest of the world. The team is currently working on projects that cover Brazil, Italy, Nigeria, and the United Kingdom.
Citation: van Deelen, G. (2026), This Arctic atlas shows where oil and gas activities overlap with wildlife and Indigenous communities, Eos, 107, https://doi.org/10.1029/2026EO260139. Published on 7 May 2026.
Research & Developments is a blog for brief updates that provide context for the flurry of news regarding law and policy changes that impact science and scientists today.
The number of peer-reviewed scientific studies authored by scientists at the EPA has declined since the beginning of Donald Trump’s second administration, according to a new analysis.
The analysis was published by Public Employees for Environmental Responsibility (PEER), a nonprofit organization that advocates for public employees in the natural resource and environmental professions. The report tracks the number of peer-reviewed scientific studies authored by EPA scientists since 1977.
According to PEER’s analysis, 61 peer-reviewed publications by EPA scientists have been published so far this year, putting the agency on track to publish 183 articles by the end of 2026. That would be 67% of the number of articles published the previous year and 54% of the number of articles published in 2024.
“These numbers represent a diminution of scientific contributions from the fewer, remaining EPA scientists,” Kyla Bennett, a science policy director at PEER and a former EPA attorney, said in a statement. “The net result is that the scientific contribution of EPA to a greater understanding of what affects human health and the environment will be diminished.”
The number of peer-reviewed publications authored by EPA scientists in 2026 will be just over half of the number published in 2024, if current publication rates continue. As of 5 May, 2026, EPA authors have published 61 peer-reviewed articles for the year. Credit: PEER, Grace van Deelen
Peer-reviewed publications can take years to review and publish, meaning the work for a publication may have occurred during a previous administration. But the decline in publications may indicate a shift away from long-term basic research at the agency, according to PEER.
Since Trump took office, hundreds of scientists have been terminated from the EPA or have chosen to resign, and scientists working within at least one of its research office have been told to pause efforts to publish research, representing “millions of dollars of research, potentially, that’s now being stopped,” one EPA employee told The Washington Post anonymously.
In February, the EPA took final steps to eliminate the Office of Research and Development, the arm of the agency responsible for conducting research. In its place, Administrator Lee Zeldin announced that a new office, called the Office of Applied Science and Environmental Solutions, would be formed but would not operate as a separate division.
Six EPA scientists who signed an open letter expressing frustration about changes to the agency, including the elimination of the Office of Research and Development, were terminated and have filed claims with the federal government arguing that their terminations were illegal retaliation.
These updates are made possible through information from the scientific community. Do you have a story about how changes in law or policy are affecting scientists or research? Send us a tip at eos@agu.org.
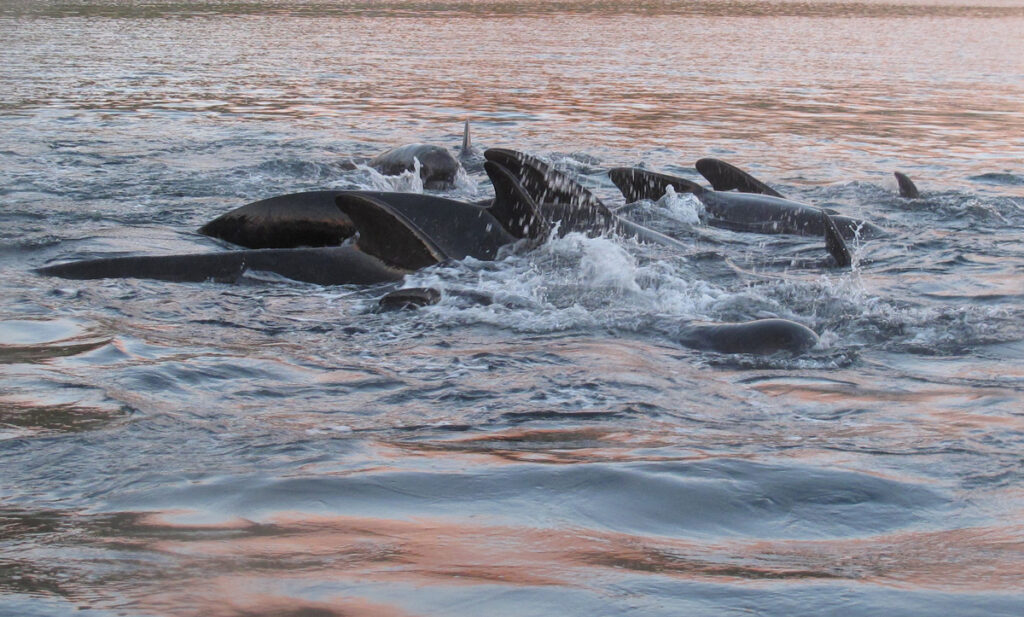
On a rocky archipelago in the North Atlantic Ocean, staff at the Faroese Environment Agency and the Faroe Marine Research Institute regularly sample tissues from the North Atlantic long-finned pilot whales that roam the waters around the islands. The archive of these samples stretches back to the 1980s and has helped researchers determine the reach of human-made contaminants in the remote marine environment.
Jennifer Sun is one of those researchers. Sun studies PFAS—per- and polyfluoroalkyl substances, commonly known as “forever chemicals”—at Harvard University and is the lead author of a recently published study that analyzed how these toxic chemicals have accumulated in pilot whale tissue over the past 2 decades.
Using samples of whale tissue collected between 2001 and 2023, Sun and her colleagues measured a parameter called bulk extractable organofluorine, which shows the overall amount of organofluorine-containing chemicals (including PFAS) in the tissue. They then used a more targeted analysis able to confirm the identity of 28 specific chemicals out of thousands of possible PFAS formulations.
The pilot whale tissue showed an expected decrease in the concentrations of older PFAS but an unexpected scarcity of newer PFAS chemicals. Credit: Jennifer Sun
The study’s results showed an expected decrease in the concentrations of older PFAS but an unexpected absence of newer PFAS chemicals. This anomaly could be indicative of an emerging question in PFAS research: Where are the newest PFAS going?
Prolific PFAS
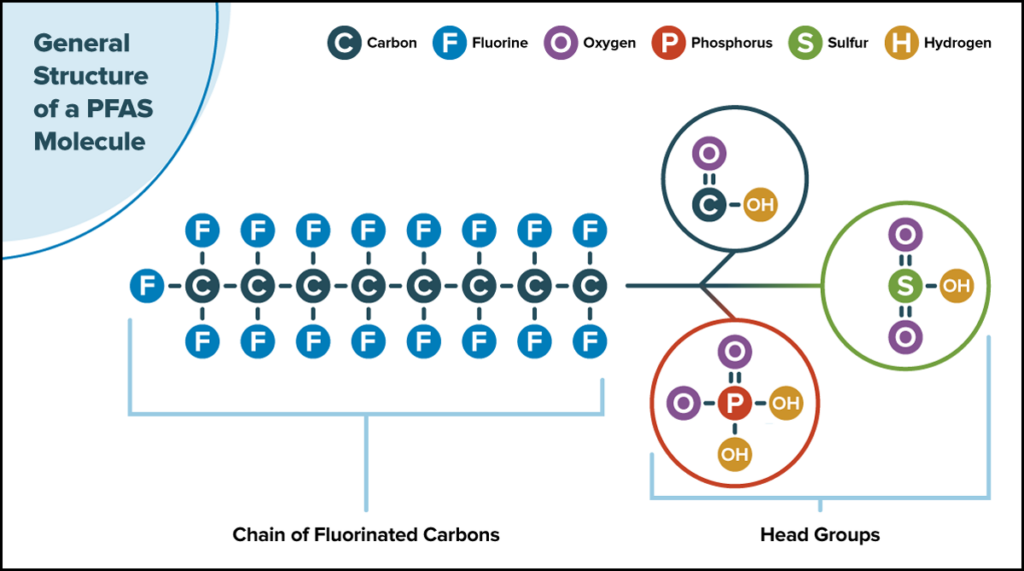
There are two general categories of PFAS. The first includes legacy PFAS such as perfluorooctanoic acid (PFOA) and perfluorooctane sulfonic acid (PFOS). Chemical manufacturers produced these compounds in the 1970s, 1980s, and 1990s for products including nonstick cookware and food packaging and in industries such as fabric waterproofing, industrial manufacturing, and firefighting.
Legacy PFAS were phased out in the early 2000s, and novel PFAS were made to replace them. The term “novel” is independent of chemical properties and instead refers to when the chemicals’ production began, though novel PFAS typically have formulations meant to reduce their persistence in the environment. For example, many novel PFAS molecules have shorter chains of fluorinated carbons than their legacy counterparts.
Novel PFAS include possibly millions of different chemical structures, and their production and use are increasing globally.
A generic PFAS molecule includes a compound head connected to a tail of fluorinated carbons. Older PFAS generally have longer tails (seven or eight carbons) than newer ones. Credit: Mary Heinrichs/AGU, after https://bit.ly/pennstate-ext-pfas
In the United States and elsewhere, regulatory structures that limit PFAS production target specific chemicals, such that every new formulation by a company must be tested individually before restrictions are put in place. With companies continually conjuring new PFAS formulations—which environmental advocates often call “regrettable substitutions” for their sometimes harmful effects—understanding the fate and transport of novel PFAS is difficult and time-consuming. Research on the behavior of specific PFAS may be a drop in the bucket when millions of potential PFAS, with millions of potential behaviors, pose current and future risks to people and the environment.
Scientists like Sun are determined to untangle how the fate of these new chemicals differs from their predecessors. As Sun expected, the phaseout of legacy PFAS was reflected in the pilot whale tissue she tested. These results are good news; they clearly show that the bans on legacy PFAS are working.
“We’re still finding [older] compounds, but clearly, they are no longer as abundant in the environment as they used to be, which is a positive,” said Bridger Ruyle, an environmental engineer at New York University who studies PFAS and assisted Sun and her coauthors in deciding which methods to use for the new study.
But Sun and her colleagues also expected an overall increase in concentrations of novel PFAS—after all, production of these chemicals is higher than ever, and researchers finally had the analytical tools to catch them.
“The inference is, if it’s not in the whales, and it’s not in the ocean…where is it?”
That wasn’t what they found. Instead, all but two of the emerging PFAS they tested for were virtually nowhere to be seen in the whale tissue, leaving the scientists leading the study to wonder where novel PFAS were accumulating or if instrumentation was limiting their detection.
“We do know that the novel PFAS are being produced, which means they’re going somewhere. Where they are, and how exposed people and other wildlife are, is not as clear,” Sun said.
“The inference is, if it’s not in the whales, and it’s not in the ocean…where is it?” asked Elsie Sunderland, an environmental scientist at Harvard University and coauthor of the new study.
Sun and Sunderland’s question—asking where novel PFAS are going—is one scientists are probing from multiple angles. Those who study particle transport are asking how novel PFAS might travel through Earth’s water and air. Those on the chemistry side of the investigation are deducing how novel PFAS might break down. And those who monitor environments are looking for traces of novel PFAS in various corners of Earth.
The answers to their questions have direct, practical implications for human and environmental health and could indicate whether a growing proportion of harmful PFAS may be ending up in close proximity to humans—where we work and eat and breathe.
A Toxic Legacy
The chemical properties of PFAS have made the chemicals useful since the 1940s. These same properties also make them highly persistent—the most durable types may not break down in the environment for several thousand years.
PFAS are linked to certain cancers and other human health harms. Much of the available data linking PFAS to poor health come from analyses of legacy PFOA and PFOS. They show an association between increased exposure to these chemicals and altered immune and thyroid function, liver and kidney disease, reproductive system disruptions, and more.
Chemical manufacturers phased out production of legacy PFAS after scientific evidence emerged associating PFAS and human health harms, businesses began to lose money in massive lawsuits, and regulations tightened. Novel PFAS were intended to show properties similar to legacy PFAS but were meant to break down more easily in the environment (lower persistence) and accumulate less easily in living tissue (lower bioaccumulative ability), though studies have shown mixed results about whether novel PFAS are actually safer for humans or break down more easily.
Because PFAS production data are often proprietary, scientists who study PFAS, like Sun, must rely on partial inventories of PFAS production or reverse-engineer those numbers from observations in the environment.
“We call it chemical Whac-A-Mole.”
Without a clear list of the chemical structures of novel PFAS, scientists don’t always have the analytical standards necessary for routine detection. And once scientists do understand the behavior of a PFAS chemical, it may be quickly replaced by another, unknown alternative. “We call it chemical Whac-A-Mole,” Sunderland said.
Legacy PFAS tend to have a high affinity for water and typically end up in the ocean, the place scientists refer to as the chemicals’ “terminal sink.” Many legacy PFAS also entered the ocean through atmospheric transport such as rain or snow. But because of the sheer number of chemical formulas and the chemical differences between legacy and novel PFAS, the pathways that novel PFAS take through the environment are less clear.
Tracking the movement and accumulation of novel PFAS in the environment is crucial for understanding how these chemicals may affect ecological and human health.
Still, the science is inconclusive about whether novel PFAS are moving or accumulating differently than their legacy counterparts, whether they have a different terminal sink, and where that terminal sink may be.
Close to Home
One possible answer to the question of the missing novel PFAS may have to do with geography. The chemicals may not have reached pilot whales in the Faroes because something about the new chemistry has led them elsewhere in the environment. To Sun, evidence suggests “that a lot of these novel PFAS, which we know are being produced, may not be transporting out into this more remote environment either at all or as quickly.”
Novel PFAS might be accumulating closer to their sources—and closer to us. “It may simply be that some of the replacement PFAS don’t make it all the way out into the open ocean. But if they are still in the terrestrial environment and the near-coastal environment, then wildlife and people who live close to the sources can be exposed, said Frank Wania, an environmental chemist at the University of Toronto Scarborough.
For example, one study monitored PFAS in coastal beluga whales in Canada’s St. Lawrence Estuary, relatively close to human communities and PFAS manufacturing sources. The study showed increasing concentrations of unregulated novel PFAS in whale tissue from 2000 to 2017, while concentrations of legacy PFAS declined.
The suggestion that novel PFAS are accumulating close to human communities is supported by measurements of PFAS in human tissue, too. Studies show that a high proportion of detectable organofluorine chemicals in human tissue are increasingly unidentifiable, suggesting that some of the novel PFAS production “is in us,” Sunderland said.
Far and Away
Though there are some indications that novel PFAS may be retained closer to human communities, there are also reasons to think some novel PFAS chemistries have resulted in substances that can actually travel farther and more easily than their legacy counterparts.
Anna Kärrman, an environmental chemist at Örebro University in Sweden, said that some novel PFAS may be more easily transported in the environment: “The more novel chemistries are increasing the properties of being very mobile in water, very mobile in the atmosphere, and not necessarily very bioaccumulative.”
The mobility of novel PFAS was on full display in a 2020 study that Sunderland coauthored, in which researchers reported detecting hexafluoropropylene oxide-dimer acid, a novel PFAS chemical more commonly known as GenX, in the Arctic for the first time. GenX, produced by chemical manufacturer Chemours, was meant to replace the legacy compound PFOA. The 2020 study suggested GenX “has already moved quite a bit,” said Rainer Lohmann, a marine geochemist who leads the STEEP (Sources, Transport, Exposure and Effects of PFAS) Center at the University of Rhode Island.
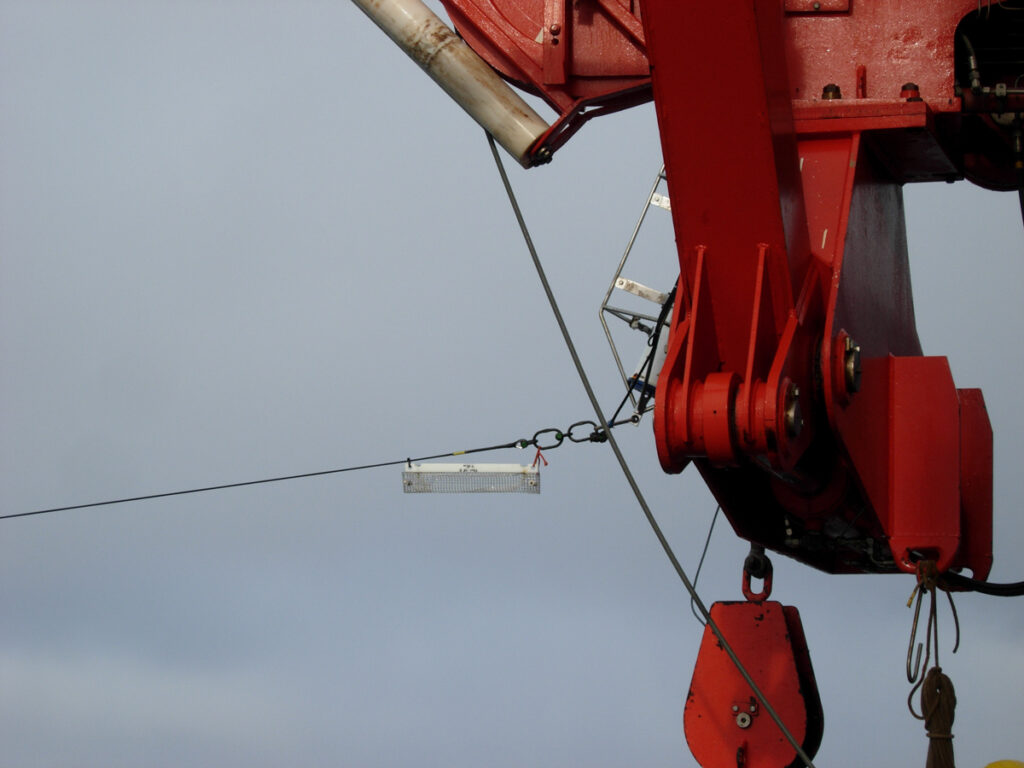
A pulley system mounted on a red beam pulls a small envelope filled with water along a string. Credit: Thomas Soltwedel
The 2020 study also found higher concentrations of PFAS in the Arctic Ocean’s surface water, suggesting that the atmosphere was a particularly important transport pathway for chemical transport. This idea is supported by studies of High Arctic ice caps, which experience contamination only from atmospheric sources, and polar bear tissue. Atmospheric transport of novel PFAS is a subject “at the edge” of PFAS research, Sunderland said.
Wherever researchers look, they’re finding that atmospheric transport is an important pathway by which some PFAS, especially PFAS precursors—chemicals that break down in the environment and become PFAS (either novel or legacy)—move. One idea called the PAART (precursor atmospheric and reaction transport) theory was developed by Scott Mabury, an environmental chemist at the University of Toronto, and others. The PAART theory proposes that many of the harmful PFAS that end up in the most remote parts of Earth are the result of the breakdown of volatile precursor PFAS that have traveled in the atmosphere.
According to Lohmann, atmospheric transport means the ocean remains a terminal sink because many novel PFAS transported in rain or snow will ultimately be deposited in the ocean.
In this scenario, the question of why novel PFAS are not bioaccumulating in Faroese pilot whales remains a mystery. While Lohmann suggests the novel compounds simply don’t accumulate in living tissue, Sunderland isn’t sure that’s the whole story: “As apex predators, the whales are sentinels for what is available and being taken up from the ocean,” she wrote in an email. “Since we don’t see [novel PFAS], it seems unlikely there are large quantities of these chemicals present.”
Profuse PFAS
Another possible explanation for the surprising results of Sun’s whale study could be that there’s just a lag; that is, novel PFAS will end up in Faroe Island pilot whales someday but haven’t yet. Chemicals that could eventually end up in the ocean may be temporarily trapped in soils or recycled back into terrestrial ecosystems via sea spray aerosols, for example.
“The delay we are seeing in the ocean response may in fact be [PFAS] precursors being retained in source zones,” Sunderland wrote in an email. These chemicals may be “taking a really long time to be transformed into more mobile compounds.”
In their pilot whale study, Sun and her colleagues modeled the transport of PFAS to the subarctic and found a 10- to 20-year lag existed between the production of a legacy PFAS compound and its detection in whale tissue. We’re still within that range for many novel PFAS. Sun said she would have expected them to show up in pilot whale tissue by now if they behaved like their legacy counterparts, though it’s possible that it has taken time for the volume of novel PFAS production to ramp up, increasing the time it would take for the substances to be detected in tissues.
The anomaly documented in the pilot whale study has led researchers to call for more investigation (and perhaps greater regulation) of novel PFAS. Credit: Bjarni Mikkelson
Still, the number of possible novel PFAS chemistries—again, there could be several million different compounds—makes it difficult to generalize how these new substances are, as a group, moving through the environment. “Because the exact structures of all [novel] PFAS remain unknown, some compounds may simply not be captured by the methods used,” Heidi Pickard, an environmental engineer at the consulting firm Ramboll and coauthor on the new whale study, wrote in an email.
Another reason novel PFAS are harder to study is that companies release lower concentrations of more kinds of the chemicals, rather than the “monstrously high” emissions of some legacy PFAS in the 1970s–1990s, noted Mabury, who was not involved in the new pilot whale study.
A New Regulatory Approach
According to Sun and Sunderland, cataloging differences between novel and legacy PFAS misses the broader point: We simply need to produce less PFAS. We’ve known for decades that PFAS harm human health, and some scientists have even argued that humans’ continual production and release of novel chemical compounds could drive Earth beyond a “safe operating space.”
“Researchers are critical for exposing the problem. But that, to me, is not the central issue here. The central issue here is a societal issue.”
Where scientists probe next may be less urgent than how policymakers decide to tackle the PFAS problem, Sunderland said: “Researchers are critical for exposing the problem. But that, to me, is not the central issue here. The central issue here is a societal issue.”
Chemical manufacturers are actively creating novel PFAS all the time. Kärrman, for example, has noticed patent applications for PFAS compounds with chemistries that “are nothing like we have seen before” that may start entering our environment in 5 or 10 years.
To Kärrman, that’s a reason for governments to push for chemical regulation based on properties such as persistence and bioaccumulation, rather than the chemical-by-chemical formula used in most countries, including the United States.
Such an approach has gotten traction in Europe via a proposal by the European Chemicals Agency to restrict the entire class of PFAS chemicals. The proposal is still under evaluation, and a final decision is expected by the end of the year.
In the United States, PFAS regulation and remediation are a key aspect of the Trump administration’s Make America Healthy Again movement, according to the EPA, and the federal government and some states already limit the concentrations of individual PFAS in drinking water. However, the EPA also said it planned to weaken some of those limits last year.
“We’re in a cycle of picking these regrettable alternatives [to legacy PFAS] and then figuring out that it was regrettable decades later,” Sunderland said. “We’re never going to catch up using this chemical-by-chemical approach.”
Citation: van Deelen, G. (2026), Chemical companies are churning out new PFAS. Where in the world are they ending up?, Eos, 107, https://doi.org/10.1029/2026EO260136. Published on 30 April 2026.
The coal industry can damage human health in myriad ways via dangerous working conditions and harmful pollution. But the income opportunities offered by the industry can also provide much-needed stability for certain communities, such as those in Appalachia’s coal country.
“Being employed is good for your health, but environmental pollution is bad for your health, and these two things are operating at the same time in some communities,” said Mary Willis, an epidemiologist at Boston University.
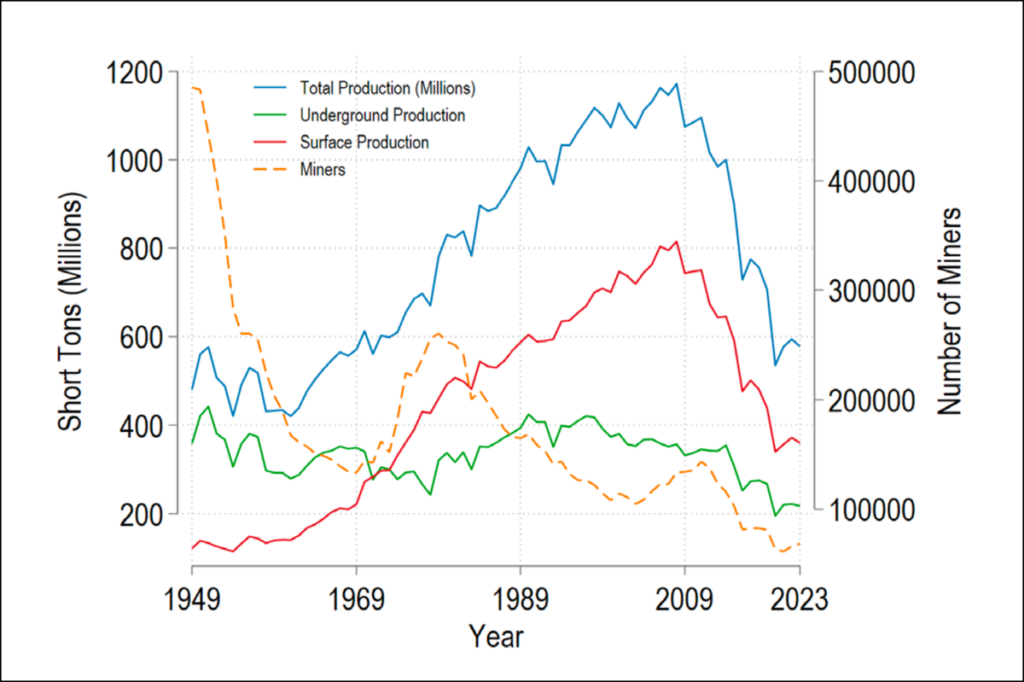
The industry, though, is changing. Total coal production in the United States peaked in 2008, and the number of miners has steadily dropped since then.
Total coal production peaked in the United States in 2008, after which the number of coal miners declined, too. Credit: Thombs et al.,2026, https://doi.org/10.1111/ruso.70034, CC BY 4.0
A new study coauthored by Willis and published in Rural Sociology delves into the effects of this decline on life expectancies across the United States and in Appalachia in particular. The results show that a disappearing coal mining industry has mixed effects on health, highlighting the importance of a “just transition”—a shift away from coal mining and toward clean energy that also prioritizes decent work opportunities for those left without a job.
“How do we balance these two conflicting priorities?” Willis said.
Delving into the Decline
Coal production and consumption are linked to many human health harms, including heart disease, asthma, lung cancer, mental illness, and more. But how those health impacts intersect with the broader economic effects of mining has not been well studied.
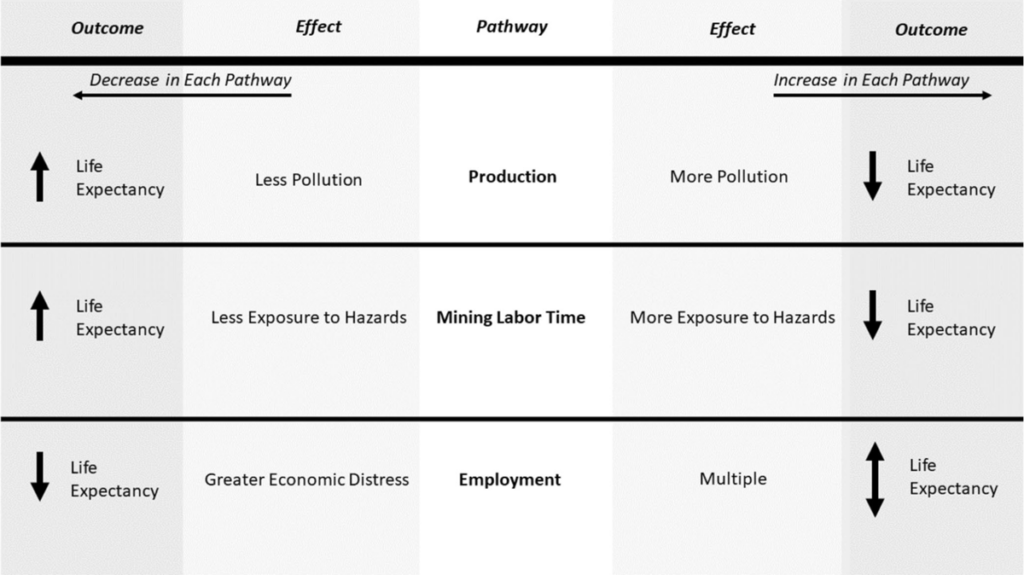
In the new study, the research team analyzed the effects of the declining industry through the lens of the social determinants of health, or how social structures influence health outcomes.
Researchers analyzed how coal mining impacts life expectancies via three pathways: production, mining labor time, and employment. Credit: Thombs et al., 2026, https://doi.org/10.1111/ruso.70034, CC BY 4.0
To study these effects, the team compared coal mining data from the U.S. Energy Information Administration to life expectancy data from the Institute for Health Metrics and Evaluation at the University of Washington from 2012 to 2019. Life expectancy is a metric that can be responsive to subtle changes in the environment, Willis explained. For example, the decommissioning of a coal-fired power plant a few miles away from a community may not affect residents’ day-to-day life but probably affects the scale of life expectancy across the population.
In coal-producing counties across the United States, the average life expectancy was 1.6 years lower than that in non-coal-producing counties. But the declining coal industry had more nuanced impacts on health in Appalachian communities, the researchers found. As coal production fell and miner labor hours decreased, life expectancy increased. But as the number of jobs available decreased, life expectancy decreased, too.
The findings suggest that the employment and associated economic impacts of a waning coal industry harm health. Previous studies documented similar increases in mortality in other regions where the fossil fuel industry has declined. Such research has indicated that these increased mortality rates may be partially driven by “deaths of despair” from drug and alcohol use and suicide related to economic distress. The association of these factors with mortality rates in coal country, the authors suggest, may be an area for future study.
Understanding that coal mining is associated with some positive economic and health effects is “an important perspective for understanding the sector as a whole,” said Lucas Henneman, an environmental engineer at George Mason University who was not involved in the new study. “It’s a really interesting piece of work.”
“This is just a really complex story that hasn’t been told yet—putting health into the context of these just energy transitions,” Willis said.
The complex reality of the coal industry extends beyond Appalachia. Most of the pollution related to the coal industry consists of toxins released when coal is burned, meaning those who bear the brunt of coal’s health impacts may not be located where coal is mined, Henneman said.
In fact, a 2023 study by Henneman and others found that before 2009, a quarter of all air pollution–related deaths of people on Medicare were attributable to coal burning. From 2013 to 2020, that number dropped to 7%, alongside a drop in coal consumption. A complete picture of how the coal industry affects health should also consider how pollution travels beyond coal country—where it’s burned, how it’s transported in the air, and who ultimately breathes it in, he said.
A Just Transition
“The question is how to provide [jobs] in a way that provides the same level of stability, same kind of income benefits, and isn’t too much of a shock to [communities’] way of life or sense of identity.”
The economic activity of a mine, through direct employment as well as businesses reliant on the mine and miners, “chases away other opportunities,” making the mine the economic backbone of the area, said Jonathan Buonocore, an environmental health scientist at Boston University and a coauthor of the new study. The concept of a just transition aims to ensure that employment opportunities in the wake of the coal industry’s decline reach these communities.
“The question is how to provide [jobs] in a way that provides the same level of stability, same kind of income benefits, and isn’t too much of a shock to [communities’] way of life or sense of identity,” Buonocore said.
Citation: van Deelen, G. (2026), As the coal industry fades, life expectancies in coal country shift, Eos, 107, https://doi.org/10.1029/2026EO260134. Published on 30 April 2026.
Research & Developments is a blog for brief updates that provide context for the flurry of news regarding law and policy changes that impact science and scientists today.
The Trump Administration has terminated the positions of every member of an independent board meant to govern the National Science Foundation (NSF).
The National Science Board directs and approves large funding decisions for NSF’s approximately $9 billion basic science research budget. It is meant to function independently from the federal administration to keep science funding insulated from political pressure and budget cycles.
“I have watched the systematic dismantling of the scientific advisory infrastructure of this government with growing alarm, and the National Science Board is simply the latest casualty.”
In a 24 April notice from the Presidential Personnel Office, all the scientists serving on the board were informed their positions had been eliminated. The emails dismissing board members provided no reason for the termination.
“I am deeply disappointed, though I cannot say I am entirely surprised,” Willie E. May, one of the terminated board members and vice president of research and economic development at Morgan State University in Maryland, told The New York Times.
“I have watched the systematic dismantling of the scientific advisory infrastructure of this government with growing alarm, and the National Science Board is simply the latest casualty,” he said.
Ranking member of the House Committee on Science, Space, and Technology Zoe Lofgren (D-CA) called the terminations “the latest stupid move made by a president who continues to harm science and American innovation.”
“Without a functional National Science Board in the near term, the agency is left without the guidance and oversight of independent experts, and the public is left without information on how NSF is carrying out its mission,” Gretchen Goldman, president and CEO of the Union of Concerned Scientists, wrote in a blog post about the terminations.
These updates are made possible through information from the scientific community. Do you have a story about how changes in law or policy are affecting scientists or research? Send us a tip at eos@agu.org.
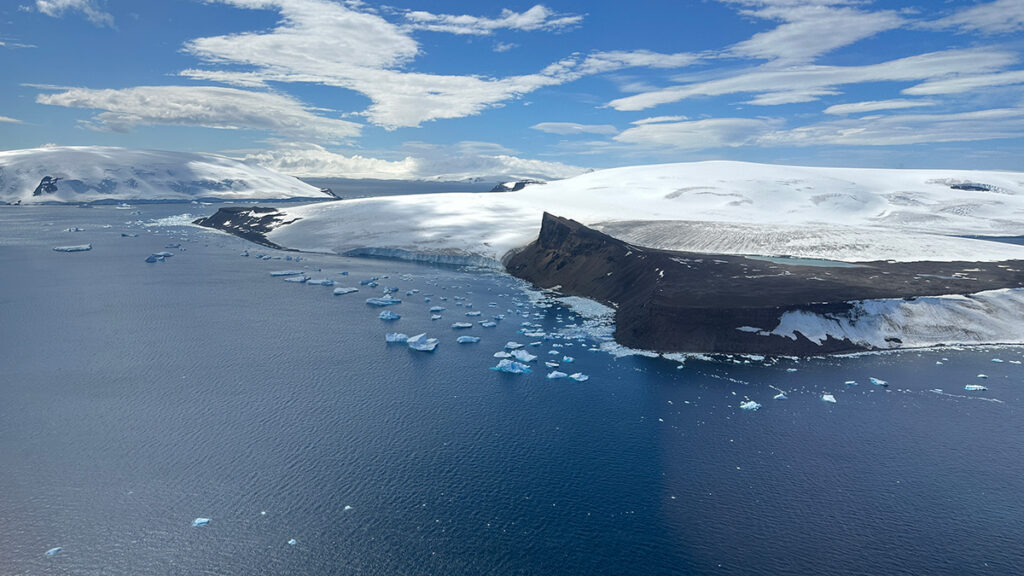
Today, the Antarctic Circumpolar Current transports more than 100 times as much water as all of Earth’s rivers combined and, critically, insulates the Antarctic Ice Sheet from heat at lower latitudes. A clear picture of the origins of this current can help scientists further understand the relationships between contemporary ocean dynamics, the global climate, and ice formation in Antarctica.
“It’s very interesting to learn more about this current, how it developed, and what role it played in the climate change that was happening at that time,” said Hanna Knahl, a paleoclimatologist and doctoral student at the Alfred-Wegener-Institut in Germany and lead author of the new study.
The Birth of a Current
About 34 million years ago, Earth was undergoing a climatic shift, now known as the Eocene-Oligocene transition, during which atmospheric carbon dioxide decreased and the planet cooled.
Earth’s tectonic plates in the Southern Ocean moved away from each other, opening and deepening bodies of water such as the Tasmanian Gateway and the Drake Passage, which separate Antarctica, Australia, and South America.
For years, scientists hypothesized that the alignment of these newly formed waterways, along with westerly winds, could have channeled ocean water and spurred the formation of the Antarctic Circumpolar Current.
“The exact position of the westerly winds and their relative position to the [ocean] gateways have to click together.”
To test that hypothesis, Knahl and her colleagues simulated conditions of the early Oligocene Southern Ocean with a coupled model that included ocean dynamics, atmosphere and wind patterns, temperatures, ice sheet growth, and precipitation. The research team compared these simulations to data from actual Antarctic sediment cores and scans of the ocean floor.
Results confirmed that westerly winds were necessary for the Antarctic Circumpolar Current to form.
“The exact position of the westerly winds and their relative position to the [ocean] gateways have to click together,” Knahl said.
Joanne Whittaker, a marine geophysicist at the University of Tasmania who was not involved in the new study, was a coauthor of a 2015 study that proposed westerly wind alignment played a role in the formation of the current. Knahl’s study presents a more sophisticated model of the early Oligocene Southern Ocean and is a great next step in the investigation of the current’s origins, Whittaker said.
“They did a really nice job of taking a range of different people’s work and linking it all together,” she said.
Oligocene Understandings
“If you can have a model that works in the past, it’s going to give you confidence that it’s going to work for the future, as well.”
Scientists often use Earth’s past behavior to better understand how Earth systems may behave in the present or future. “If you can have a model that works in the past,” Whittaker explained, “it’s going to give you confidence that it’s going to work for the future, as well.”
The Eocene-Oligocene transition is a key to understanding the relationship between atmospheric carbon, ocean dynamics, and the glaciation of Antarctica, Whittaker said. Knowing how the current’s behavior affected carbon uptake millions of years ago helps scientists model how the present current’s behavior might also affect atmospheric carbon.
In addition to carbon uptake, the new research hints at how changes in westerly winds may influence the advance and retreat of the Antarctic Ice Sheet. Some modeling and proxy data indicate the westerly winds that spurred the Antarctic Circumpolar Current’s formation 34 million years ago have shifted in the past century and may continue to shift in the future. Understanding the role these winds initially played in the current’s development may shed light on the current’s present ability to guard the Antarctic Ice Sheet from warmer air masses.
There are still Oligocene patterns that require more research to sort out, though. For example, modeling in the new study showed interesting asymmetries in the timing of the development of different parts of the Antarctic Circumpolar Current, Knahl said. Scientists know from proxy data and modeling that similar asymmetry exists in the history of the Antarctic Ice Sheet; the ice sheet in East Antarctica began to form about 7 million years before the ice sheet began to form in West Antarctica.
“It could be interesting to see if there’s a connection between the asymmetries that we see here,” Knahl said. “Are they linked, or were they more or less independent?”
Citation: van Deelen, G. (2026), Widening channels and westerly winds together formed Earth’s strongest current, Eos, 107, https://doi.org/10.1029/2026EO260126. Published on 24 April 2026.
“It may sound small, but it’s reshaping daily life.”
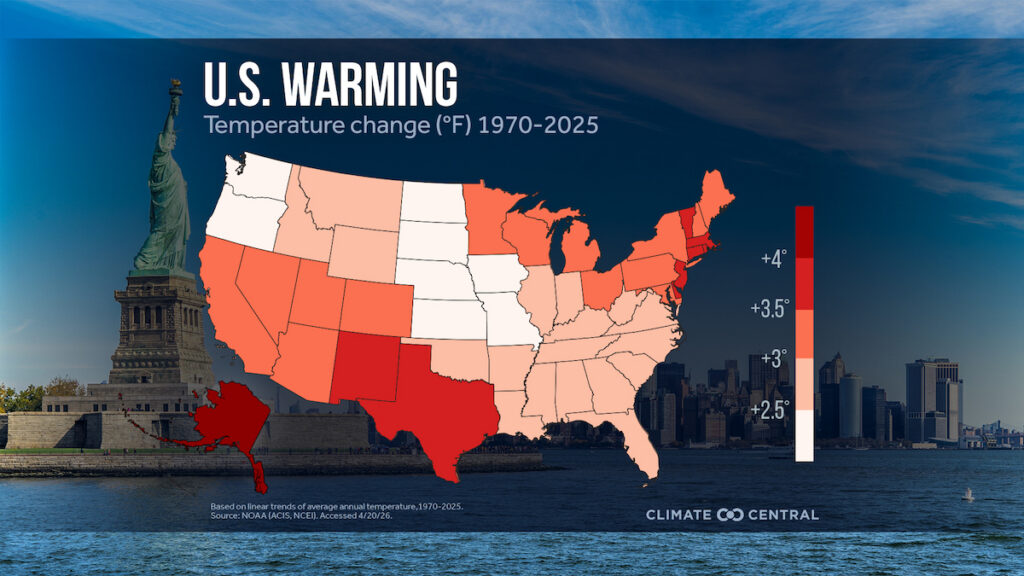
Changes in average annual temperatures in U.S. cities and states show the powerful effects of this increase in heat-trapping carbon dioxide. A new analysis, published today by climate research and communications nonprofit Climate Central, found that since 1970, all 50 states and 99% of major U.S. cities have warmed, with an average city-level increase of 1.6°C (2.9°F).
“It may sound small, but it’s reshaping daily life,” Shel Winkley, a meteorologist at Climate Central, said in a video released alongside the report.
On average, the 49 U.S. states analyzed in the report have warmed by 1.7°C (3.0°F) since 1970. The six states that have warmed the fastest since the first Earth Day are Alaska with a 2.4°C (4.4°F) increase, New Jersey and New Mexico with a 2.1°C (3.7°F) increase, and Delaware, Massachusetts, and Vermont with a 2°C (3.6°F). Trends for Hawaii, which were analyzed separately and not included in the national average, also showed statewide warming.
In 2025, the United States was on average 1.4°C (2.6°F) warmer than the 20th century average. The Paris Agreement, a legally binding global treaty, sets a goal to limit warming to 1.5°C (2.7°F) above preindustrial levels, though some scientists expect that the world has already entered the period of time during which this limit will be breached.
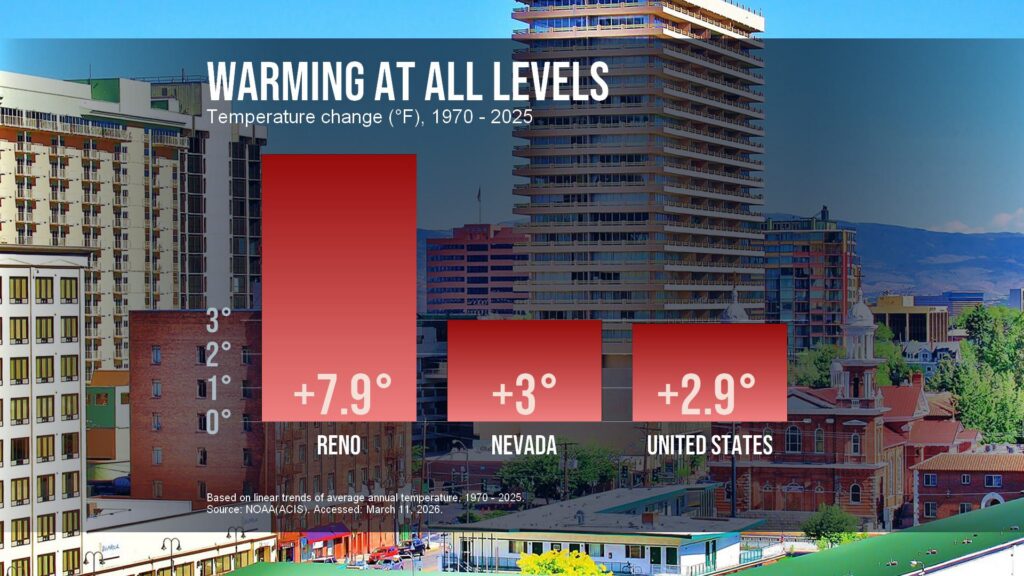
Warming is occurring much faster in some cities than in their respective states, or than the United States as a whole. Check out your city’s data in the Climate Central report. Credit: Climate Central, CC BY 4.0
Warming trends in the United States are most pronounced in the Southwest, where cities have warmed an average of 1.9°C (3.5°F) since 1970. And in some cases, cities are warming much faster than whole states. Three of the five cities that have warmed the fastest since 1970 are in the Southwest: Reno, Nev., with an increase of 4.4°C (7.9°F), Las Vegas, with an increase of 3.3°C (6.0°F), and El Paso, Texas, with an increase of 3.3°C (5.9°F).
The effects are evident at the national, state, and local levels. Temperatures have warmed in 240 of the 242 cities analyzed by Climate Central. Harrisonburg, VA and Monterey, CA were the only two cities analyzed that have not warmed since 1970.
The report highlights some good Earth Day news, however, and points out that solar and wind power generation is at an all-time high in the United States, accounting for 19% of the electricity generated in the country in 2025 despite those industries facing recent headwinds from the federal administration.
“Every fraction of a degree [of warming] that we prevent does matter, for our health, for our communities, and for the world that we’re passing on to the next generations,” Winkley said.
These updates are made possible through information from the scientific community. Do you have a story about science or scientists? Send us a tip at eos@agu.org.