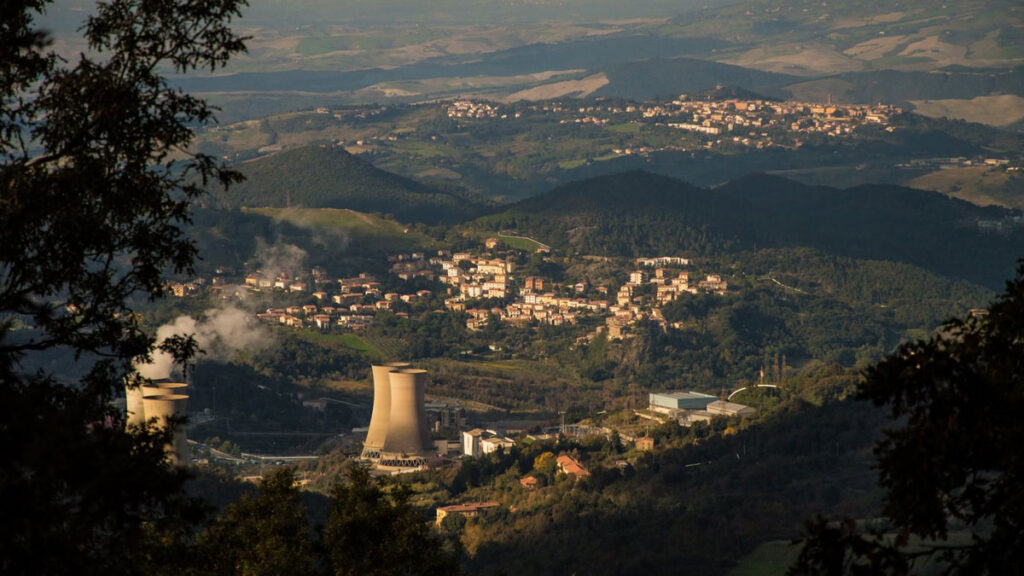
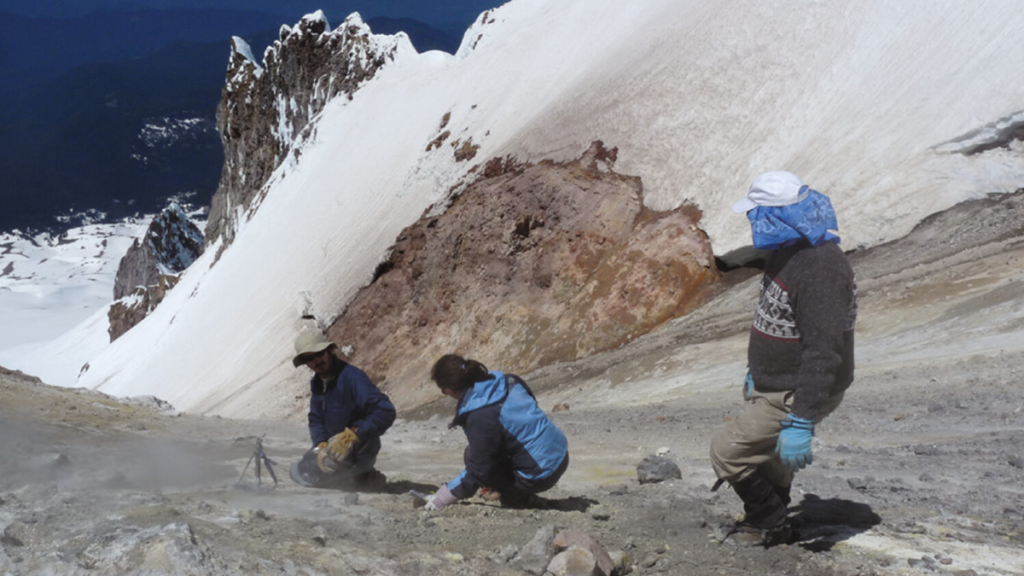
It’s long been clear that Italy’s Larderello region is supplied with abundant heat from Earth’s interior. The area, located in the center of Tuscany, is home to the world’s very first geothermal power plant and once bore the nickname “Devil’s Valley” for the steam vents that dot the rolling landscape.
The source of all of that heat has never been clear because the region has little volcanic activity. But now, new research points to the existence of a massive reservoir of magma, thousands of
It’s long been clear that Italy’s Larderello region is supplied with abundant heat from Earth’s interior. The area, located in the center of Tuscany, is home to the world’s very first geothermal power plant and once bore the nickname “Devil’s Valley” for the steam vents that dot the rolling landscape.
The source of all of that heat has never been clear because the region has little volcanic activity. But now, new research points to the existence of a massive reservoir of magma, thousands of cubic kilometers in volume, hiding beneath Larderello.
“It’s beautiful to think that in a few hundred thousand years, we might find a supervolcano in there.”
The reservoir was discovered by University of Geneva geophysicist Matteo Lupi and his colleagues using a relatively new technique called ambient noise tomography (ANT). With ANT, the researchers peered deeper beneath the crust in the region, discovering anomalies that pointed to large volumes of magma.
The reservoir sits about 10 kilometers beneath the surface and is around 20 kilometers in diameter, the authors reported in a paper published in CommunicationsEarth and Environment. Those dimensions make the reservoir comparable in size to those underlying so-called supervolcanoes like Yellowstone and Toba, though Lupi said there’s no apparent danger of an eruption anytime soon.
“I don’t think that, in human time frames, we should change the way we perceive the area,” he said. “Nevertheless, it’s beautiful to think that in a few hundred thousand years, we might find a supervolcano in there as well.”
Listening for Magma
Previous studies had posited the existence of large amounts of magma somewhere beneath Tuscany but never provided definitive evidence. A borehole project that concluded in 2018 revealed sudden temperature increases several kilometers down. Other studies using seismic vibrations to infer the structure of the crust in the region hinted at the presence of magma.
Lupi, along with colleagues in Italy, has been working to expand the use of ANT in Tuscany and elsewhere to make new and better images of structures deep underground. The technique involves using a network of seismometers to pick up on surface waves traveling through Earth that record a kind of background noise created by wind, ocean waves, and other subtle forces. Then, statistical algorithms help scientists find relevant seismic signals amid the static.
“Surface waves are sensitive to the shear properties of the rock,” said Brandon Schmandt, a geophysicist at Rice University who wasn’t affiliated with the research. “If you heat something or introduce a little melt, the shear properties weaken a lot. And so it’s a good way to find a big magma reservoir [in Earth’s crust].”
Using more than 60 seismometers spread across Tuscany and islands just offshore, Lupi and his team cross correlated surface wave data to produce a map of seismic velocities beneath Larderello. That map contains a large blob where seismic signals travel markedly slower than in other places. Those speeds align with a body of partially melted rock, Lupi said, surrounded by a region of slightly cooler and more solid “crystal mush.”
The researchers estimate the reservoir is about 5,000 cubic kilometers in volume, with molten rock making up about 80% of its innermost contents and about 20% of the surrounding crystal region.
A Missing Supervolcano?
The magma reservoir’s existence provides an explanation for the abundant geothermal activity in the Larderello region while simultaneously raising another question. The quantity of magma discovered could fuel a massive eruption on the scale of other supervolcanoes worldwide—yet no supervolcano exists in Tuscany.
Why Tuscany doesn’t host a caldera similar to Yellowstone in the United States is still an open question. There are several nonexclusive possibilities for the lack of eruptivity, said Federico Farina, a geologist and professor of geochemistry at the University of Milan who was also an author of the study. The magma under Larderello might be drier and therefore less eruptive, or it could have been produced, and therefore intruded into the crust, more slowly. Additionally, the structure of the crust in the region could have helped to trap the magma and prevent it from getting out.
Another clue to the region’s geological history comes from dating zircons, small crystals formed when magma cools and hardens. Farina has found zircons with different ages very close to each other in the rock matrix, which he said indicates a long-lived system where magma moves through different reservoirs as it cools. He said these zircons may also enable the researchers to model the size of the reservoir and better understand the speed and amount of magma accumulation there.
More to Come
Discovering so much magma underneath Tuscany is a surprise, but Lupi thinks it’s likely to be far from the only large magma reservoir hiding beneath a volcanically quiet region. He noted that research he carried out in the Andes around a decade ago also suggested, though not conclusively, the existence of a large, hidden magma reservoir. That experience was, in part, what convinced him to use ANT’s deep imaging capabilities elsewhere.
“This is good momentum to encourage people to look at it from a magmatic system standpoint and not just focus on the vents at the surface.”
Schmandt agreed that large reservoirs are likely to exist in other places even when there’s little for human eyes to see. “This is good momentum in that direction to encourage people to look at it from a magmatic system standpoint and not just focus on the vents at the surface,” he said.
Lupi may not have to go far to discover his next massive pool of molten rock. He said his data indicated there may be another reservoir buried under nearby Mount Amiata that’s twice as big as the one beneath Larderello. That area was just at the edge of their seismometer network, meaning the team couldn’t fully resolve it.
Citation: Scharping, N. (2026), Scientists find thousands of cubic kilometers of magma hiding beneath Tuscany, Eos, 107, https://doi.org/10.1029/2026EO260157. Published on 18 May 2026.
For roughly 45 million years, the eastern section of the African continental plate has been slowly pulling apart. Like a giant zipper extending from the Red Sea to Mozambique, the East African Rift System will likely be home to new oceanic crust that will well up from the widening split in Earth’s surface. While most of the rifts in that system are still zipped shut, the Afar region in northern Ethiopia has already partially unzipped and may be starting to create a future ocean basin.
Most m
For roughly 45 million years, the eastern section of the African continental plate has been slowly pulling apart. Like a giant zipper extending from the Red Sea to Mozambique, the East African Rift System will likely be home to new oceanic crust that will well up from the widening split in Earth’s surface. While most of the rifts in that system are still zipped shut, the Afar region in northern Ethiopia has already partially unzipped and may be starting to create a future ocean basin.
Most models of this rift system suggest that it should continue to unzip sequentially from north to south. However, new research suggests that a region in the middle of the zipper is on the verge of splitting open.
High-resolution seismic reflection data show that the crust near Kenya’s Lake Turkana is only 13 kilometers thick. This suggests that the region has entered the second stage of rifting, called necking, and is one step closer to breaking apart. It is the only rift zone on Earth currently undergoing this short-lived tectonic process.
The Lothagam site in the Turkana Rift Zone contains tilted sediments from the late Miocene (about 7 million years ago), just before the necking phase of rifting commenced. Credit: Christian Rowan
Breaking Up Is Hard to Do
Just like mid-ocean ridges on the seafloor, sections of Earth’s crust on land also stretch apart as tectonic plates separate. This process, called rifting, takes place in three stages. First, the crust stretches, creating tension. Then it rapidly thins like pulled taffy—this is the necking stage. Finally, magma wells up from the lithospheric mantle, which creates new seafloor and breaks the continental plate apart.
“This is one of the unique places on Earth where you can see a continental rift.”
Not every rift makes it that far. Some remain stuck in the stretching phase with crust more than 20 kilometers thick. But northern sections of the East African Rift System (EARS), specifically the Afar Rift and the Red Sea, are already undergoing the final stage, oceanization.
“This is one of the unique places on Earth where you can see a continental rift,” said Anne Bécel, a geophysicist at Lamont-Doherty Earth Observatory of Columbia University in Palisades, N.Y., and coauthor of new research published in Nature Communications in April. “The East African Rift System has been studied for a very long time by geologists to really learn about our planet and how continents break apart, and then transpose that to mid-ocean ridges where oceanic plates spread apart.”
The team suspected that the Turkana Rift Zone, located at a critical triple junction in northern Kenya, was behaving differently from other areas of the rift system. It is home to an unusually large and continuous hominin fossil record dating back about 4 million years. Past research has also shown that the bottom of the crust, called the Moho, is unusually shallow in the Turkana Basin, just 20 kilometers deep compared with the average depth of 39 kilometers farther away from the rift.
During several field expeditions to Lake Turkana in partnership with local industries, the team mapped the top of the continental crust using borehole measurements and seismic reflection—sending seismic waves into the ground and measuring how the waves bounce back, like sonar. They combined those measurements with past research into Moho depths to calculate the crustal thickness near Lake Turkana.
That map showed that far away from the rift, the crust is more than 35 kilometers thick, but in the Turkana Rift Zone it is a mere 13 kilometers thick, below the threshold for necking.
“If you look at the modern day topography, the whole East African Rift is in this really low, broad land between two big plateaus, one to the north in Ethiopia and one towards the south,” said lead researcher Christian Rowan, a geologist and doctoral candidate at Columbia University. “It’s this very strange topographic feature, and part of that low-lying topography is actually how thin the crust is there.”
“The oldest rocks that record the initiation of the East Africa Rift System are also in the Turkana Rift,” said coauthor Folarin Kolawole, a Columbia University geologist. Geochemical analysis of those rocks suggests that necking in the Turkana Rift Zone began about 4 million years ago.
Christian Rowan measures a fault in the Turkana Rift. Credit: Christian Rowan
About to Break?
“Any time you have a place on the planet that is rare in the modern but seen in the past, it is compelling,” said Erik Klemetti Gonzalez, a volcanologist at Denison University in Granville, Ohio, who was not involved with this research. “The data does show that the Turkana Rift is the home of anomalously thin continental crust, so if you are looking for a location that meets criteria for necking, it seems to be the case.”
The team suspects that Turkana might have been primed to split apart more easily because another rifting event took place there a mere 17 million years before the present rift began. The Turkana Basin inherited a weaker section of crust that didn’t have time to fully heal in the (geologically) short time between rifting events. There was also an extended period of magmatic activity throughout much of the past 45 million years.
“Magmatism is well known to be a significant weakening factor in rifting,” Rowan said. “I think the two compounding effects of this inheritance and then magnetism is why the Turkana rift is so much more mature than other segments.”
“I would hope that more collaboration with African geoscientists could create the ability to collect data from places that have been more inaccessible over the past half century.”
“There are many ‘failed rifts’ in the geologic record, so the question of whether the EARS is actually leading to a continental break up, albeit a small one, is still very much up in the air,” Klemetti Gonzalez said. These new results tip the scales toward breakup, but he noted that more of the rift system still needs to be mapped to really understand the fate of this region.
“I would hope that more collaboration with African geoscientists could create the ability to collect data from places that have been more inaccessible over the past half century,” he added.
Rowan and his team are working toward that end by continuing to map crustal thicknesses in other nearby rift zones.
“This was the only known rift that was undergoing necking along the entire East African Rift System, or in the world,” said Kolawole. “But based on ongoing work, there is evidence that there are other segments that are at the onset of necking in the East African Rift System.”
Citation: Cartier, K. M. S. (2026), Eastern Africa is splitting apart, but not where we expected, Eos, 107, https://doi.org/10.1029/2026EO260148. Published on 12 May 2026.
Source: AGU Advances
Asteroids and planetesimals regularly bombarded Earth between about 4.6 billion and 3.5 billion years ago, in the Hadean and Archean eons. Because few rocks today are more than 4 billion years old, our understanding of the planet’s environment during that time is limited. However, samples from the Moon and its cratered surface hint at the period’s rate of cosmic impacts.
Early asteroid strikes were responsible for significant changes in Earth’s crust, which was primar
Asteroids and planetesimals regularly bombarded Earth between about 4.6 billion and 3.5 billion years ago, in the Hadean and Archean eons. Because few rocks today are more than 4 billion years old, our understanding of the planet’s environment during that time is limited. However, samples from the Moon and its cratered surface hint at the period’s rate of cosmic impacts.
Early asteroid strikes were responsible for significant changes in Earth’s crust, which was primarily basalt-like at the time. The shock waves from collisions fractured the crust and increased porosity, allowing fluids and gases to move through the rocks. Prior research suggests that the resulting hydrothermal systems—such as the network of geysers around Yellowstone National Park—provided the environment for the origin and evolution of early life on Earth.
Alexander et al. explored how surface impacts during the Hadean and Archean allowed fluids and gases to maneuver through crustal environments. The authors built a large suite of impact simulations with the iSALE shock physics code, toggling parameters such as basalt crust thickness, geothermal gradients, and the presence or absence of a 5-kilometer-deep ocean. The simulations detailed how collisions on the surface shaped permeability in the crust. They then integrated a model for ancient bombardment data to understand the cumulative effects of repeated strikes over time.
The results indicate that prior to 4.3 billion years ago, impacts may have made the crust far more permeable, particularly in its top 8 kilometers. From the simulations, the authors inferred that the size of permeable regions was dependent on impact energy, and that geothermal gradients and rock composition in the crust affected the degree of fragmentation after impact. These porous domains formed potential settings for prebiotic chemistry within the early crust.
The research is the first comprehensive study of impact-generated permeability in early Earth’s outermost layer. The results provide a novel framework for evaluating how bombardment influenced hydrothermal circulation and geochemical alteration during the Hadean and Archean eons, with implications for our understanding of life’s origin and evolution in Earth’s earliest days. (AGU Advances, https://doi.org/10.1029/2025AV002097, 2026)
—Aaron Sidder, Science Writer
Citation: Sidder, A. (2026), Cosmic bombardment created potential for prebiotic chemistry, Eos, 107, https://doi.org/10.1029/2026EO260180. Published on 5 June 2026.
Source: Geophysical Research Letters
As seismic waves travel through Earth, they gradually lose energy, a process called attenuation. That energy loss doesn’t happen uniformly—some features in the crust sap far more energy from seismic waves than others. Researchers can map underground features by watching where seismic waves lose more or less energy. The Southern Array for the Lithosphere and Uplift of Taiwan Experiment (SALUTE) is doing just that, providing information that could lead to i
As seismic waves travel through Earth, they gradually lose energy, a process called attenuation. That energy loss doesn’t happen uniformly—some features in the crust sap far more energy from seismic waves than others. Researchers can map underground features by watching where seismic waves lose more or less energy. The Southern Array for the Lithosphere and Uplift of Taiwan Experiment (SALUTE) is doing just that, providing information that could lead to improved seismic hazard planning in the country.
Lin et al. report attenuation results from SALUTE focused on the convergence between the Eurasian plate and the Luzon Arc, an understudied, geologically dynamic area where Earth’s crust is deforming. Using the overall attenuation rate and relative attenuation rates of P and S seismic waves, the authors imaged active faults, identified distinct lithologies, and better resolved the Luzon forearc block that sits just offshore of Taiwan.
The authors used data from the SALUTE high-density seismographic network, spanning December 2020 to December 2023, to construct both 2D and 3D attenuation models. They found clear changes in attenuation associated with major faults, as well as areas of high attenuation associated with fluid-rich, ductile zones in the lower crust that cause tectonic tremors. Their attenuation imaging additionally revealed that the Luzon forearc block, which had been poorly imaged in the past, dips northward and narrows as it nears the convergence zone.
The authors say their results agree well with previous velocity-based seismic imaging studies and show that attenuation can image features, such as transition zones, that were previously difficult to capture. Their data could also be useful for better understanding seismic hazard throughout the region, they note. (Geophysical Research Letters,https://doi.org/10.1029/2025GL121583, 2026)
Citation: Scharping, N. (2026), Seismic attenuation techniques reveal what lies beneath Taiwan, Eos, 107, https://doi.org/10.1029/2026EO260150. Published on 11 May 2026.
Editors’ Vox is a blog from AGU’s Publications Department.
The supply of magma from the Earth’s mantle is a primary source of heat to volcanic arc crust, where the heat is then dissipated through various processes. Much of this magmatic heat is dissipated as heated water, or aqueous fluid.
A new article in Reviews of Geophysics compares 11 different volcanic-arc segments where heat discharge via aqueous fluid has been well-inventoried to better understand the factors that influence this p
The supply of magma from the Earth’s mantle is a primary source of heat to volcanic arc crust, where the heat is then dissipated through various processes. Much of this magmatic heat is dissipated as heated water, or aqueous fluid.
A new article in Reviews of Geophysics compares 11 different volcanic-arc segments where heat discharge via aqueous fluid has been well-inventoried to better understand the factors that influence this process. Here, we asked the authors to give an overview of heat discharge from volcanic arcs, how scientists measure it, and what questions remain.
Why is it important to study how heat is dissipated from volcanic arcs?
The heat from these magmas matters for geothermal energy, patterns of groundwater flow, and the patterns of volcanic activity at the surface.
Volcanic arcs are the chains of volcanoes on top of subduction zones. They can produce some of Earth’s most explosive and hazardous eruptions. But much of the magma beneath the surface never erupts. Nevertheless, the heat from these magmas—and the simple fact of their existence and abundance—still matters for geothermal energy, patterns of groundwater flow, and the patterns of volcanic activity at the surface.
What are the main modes in which heat is discharged from volcanic arcs?
Heat at volcanic arcs can be carried by magmas, transmitted through the crust conductively, and carried by water seeping slowly through the crust. At the base of the crust, magmas are probably most important, with conduction coming in second. But as magmas move upwards through the crust, some of them solidify and impart their heat to their surroundings where it is transferred by conduction. Within a few kilometers of the surface, fluids seeping through the crust begin to take up all that heat, and so if we can quantify the heat carried by those fluids, we can retrace it to its origins in magmas.
How do scientists measure these different forms of heat loss?
Scientists measure the heat carried by erupting magmas using satellites, or by adding up the erupted masses and making an estimate of how much energy was released by cooling from eruption temperatures to solid igneous rocks at Earth’s surface. Conductive heat flow is measured by drilling holes in the Earth’s crust to see how quickly it gets hotter with depth.
Measuring the heat carried by aqueous fluids in the crust is in some ways the trickiest. One approach is to find all the springs where hot or even slightly warm water is trickling out and measure the temperature and discharge to estimate how much extra heat that water is carrying.
What are the challenges and uncertainties in measuring hydrothermal heat discharge?
One challenge is that many springs are only slightly warmer than you’d expect. There is good data for many hot springs, but there are data tracking these ‘slightly warm’ springs for only a subset of arcs. Another challenge is that warm underground fluids can flow laterally, so you have to try to account for that. This is not an uncertainty in hydrothermal discharge, but one additional big uncertainty for our study, where we were trying to quantify the proportion of magmas that freeze underground versus erupting, is in the estimates of how much magma has actually erupted through time.
What are some of the factors that influence hydrothermal heat loss?
A major goal of our paper is to try to quantify these hidden magmas.
A main factor that influences hydrothermal heat loss is the magmas that solidify underground. This link is the key motivation for our study. A major goal of our paper is to try to quantify these hidden magmas—how much magma needs to intrude the crust beneath the surface to supply the hydrothermal heat fluxes that we observe? The composition of magmas influences how much heat they can release. The depth at which magmas are emplaced also matters, because magmas that intrude the shallow crust eventually cool to lower temperatures than magmas emplaced in the lower crust and therefore release more heat.
What are the remaining questions or knowledge gaps where additional research efforts are needed?
A big outstanding challenge is combining estimates from hydrothermal data of how much magma is coming into the crust – like ours – with other approaches to estimating the same thing. The magmatic systems beneath volcanoes span the crust. At the base of the crust, you have magma supply, sort of like the water main feeding your plumbing system. Despite how fundamental magma supply is, we know remarkably little about it. It’s exciting to think about how the rates of magma supply could vary through time and space and why. Applying a range of techniques—including geophysical imaging, hydrothermal budgets, gas and igneous geochemistry, and petrology—to understand these questions could really be a game changer.
Editor’s Note: It is the policy of AGU Publications to invite the authors of articles published in Reviews of Geophysics to write a summary for Eos Editors’ Vox.
Citation: Black, B. A., S. E. Ingebritsen, and K. Sawayama (2026), Hydrothermal heat flow as a window into subsurface arc magmas, Eos, 107, https://doi.org/10.1029/2026EO265017. Published on 28 April 2026.
This article does not represent the opinion of AGU, Eos, or any of its affiliates. It is solely the opinion of the author(s).
Editors’ Vox is a blog from AGU’s Publications Department.
After 18 years of data collection, quality control, processing, and archiving, the United States Magnetotelluric Array (USMTArray) data set was completed in 2024. A new article in Reviews of Geophysics introduces this unprecedented data set and a new high-resolution model of the Earth’s crust and upper mantle that was made possible because of it. Here, we asked the authors to give an overview of magnetotellurics, how the USMTArray wa
After 18 years of data collection, quality control, processing, and archiving, the United States Magnetotelluric Array (USMTArray) data set was completed in 2024. A new article in Reviews of Geophysics introduces this unprecedented data set and a new high-resolution model of the Earth’s crust and upper mantle that was made possible because of it. Here, we asked the authors to give an overview of magnetotellurics, how the USMTArray was developed, and future directions for research.
In simple terms for a non-specialist, what is the science of magnetotellurics?
Magnetotellurics (MT) is a passive geophysical technique capable of imaging the subsurface from hundreds of meters to hundreds of kilometers depth using the Sun and global lightning as sources. The science behind MT is largely based on Faraday’s law of induction, where external magnetic field variations induce telluric (from the Latin word ‘tellus’ meaning Earth) currents in the conducting Earth. These magnetic field variations are constantly occurring and happen over a wide range of time scales ranging from milliseconds to hours. And they are tiny – typically on the order of 0.1% of Earth’s magnetic field amplitude and even during intense magnetic storms rarely exceed 1%.
By measuring these magnetic variations, and the induced electric field variations at Earth’s surface, we can constrain the 3D distribution of conductivity in the Earth. MT is an elegant method – we exploit powerful and distant energy sources which we have no control over and can mathematically remove the stochastic source spectrum to recover reliable estimates of Earth impedance. Impedance can be thought of as the Earth filter – a complex, frequency dependent set of functions that encapsulates all the information about the 3D conductivity structure beneath our feet. Through numerical inversion of impedance data at an array of sites, we build up 3D models of electrical conductivity.
What are some of the applications of the magnetotelluric method?
MT is applied across a broad spectrum of the Earth and space sciences ranging from mineral and geothermal resource investigations, to fundamental geologic and tectonic studies, to imaging the magmatic plumbing systems of active volcanoes, and to hazard mapping centered upon geomagnetically induced currents and the risk they pose to power grids.
Studies using MT are performed on every continent and in all tectonic settings, on land and on the ocean floor, on the Antarctic ice sheet, and even on the Moon. Because of its ability to image the entire lithospheric column, MT studies have made important contributions to our understanding of continental assembly by revealing ancient orogens and rifts. Moreover, MT is uniquely able to constrain the stability of cratonic roots by mapping hydration of the mantle lithosphere. MT studies are key to understanding active tectonic processes, including constraining the water budget in subduction zones, imaging melt zones beneath orogenic plateaus, and mapping the extent of crustal extension – for example beneath the western U.S.
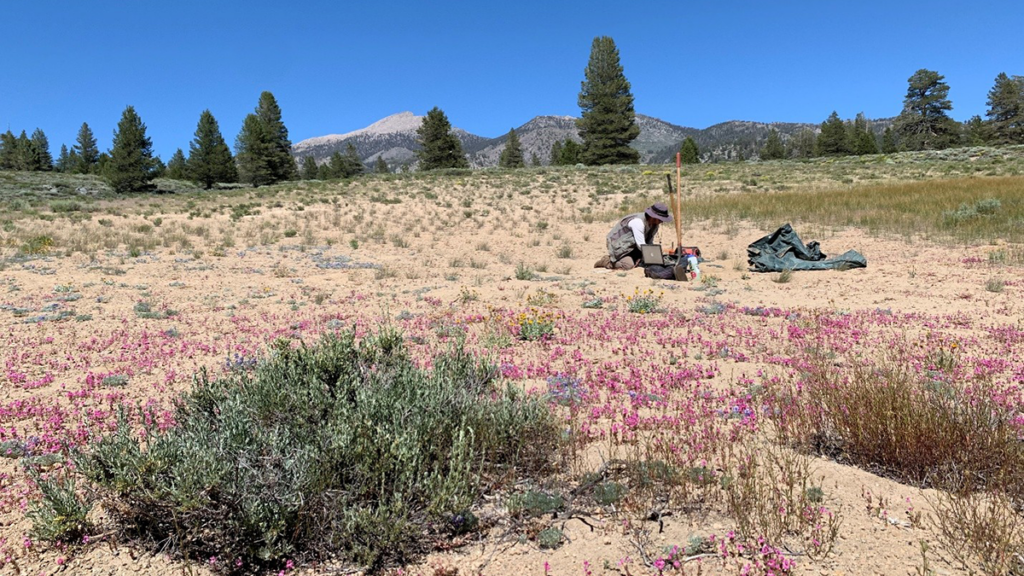
Installation of a USMTArray site in the arid southwestern United States. Sites are installed in remote areas far from infrastructure (powerlines and pipelines) which can interfere with magnetotelluric measurements. Credit: Lena Tokmakoff
With the rise of computational power and 3D modeling and inversion codes, MT is now routinely used to study complex 3D systems, such as active volcanoes, geothermal systems, and mineral deposits. The sensitivity of MT to minor conductive phases – be it partial melt, clay, or conductive minerals such as graphite and metallic sulfides – make it ideal for studying these types of systems. As a result, MT is commonly employed within the resource sector at both the district and deposit scale. Many of the world’s iconic volcanoes have also been imaged with MT, where they constrain the geometry of crustal melt reservoirs – especially their volume and melt fraction which is in turn linked to the eruptibility of a subsurface magma. These analyses are especially powerful because they are sensitive to a distinct physical parameter – resistivity – of Earth materials. MT therefore provides unique and complementary information about the subsurface across a wide range of scales and is a particularly invaluable tool when other methods yield non-unique interpretations.
One somewhat unexpected application of MT has been to space weather hazards. It was recognized a little over a decade ago that MT impedances are key to estimating surface electric fields generated during intense geomagnetic storms that can impact electric power grids. Past storms have knocked out power to vast areas and damaged critical infrastructure such as transformers. The importance of MT data to scenario analysis, in which power grid components are ‘stress tested’ against past geomagnetic storms, cannot be overstated. Regional to national-scale geoelectric hazard maps, both in the U.S. and internationally, are also informed by MT data, as are real-time geoelectric hazard estimates.
What is the United States Magnetotelluric Array (USMTArray)?
The USMTArray was an ambitious program begun in 2006 under the NSF-funded EarthScope program and completed in June of 2024 under USGS funding. The USMTArray collected long-period MT soundings on a 70-km grid across the contiguous U.S. – totaling more than 1,800 stations – each collected with uniform instrumentation, acquisition parameters, data processing, archiving, and metadata. Funded throughout its 18-year lifetime by three different federal agencies (the NSF, NASA, and USGS working closely with the Incorporated Research Institutions for Seismology and Oregon State University), the data – time series, response functions and metadata – were released incrementally to the public without data embargo or usage restriction.
Map of USMTArray site locations illustrating how the survey rolled across the country over its nearly two-decade lifetime. Credit: Kelbert et al. [2026], Figure 1
In broad terms, how was the USMTArray developed?
The USMTArray had humble beginnings – being mentioned in early planning documents as having value in understanding subduction zones and characterizing volcanic systems. Funded by NSF in 2003, the MT component of EarthScope was modeled after the much larger seismic component, with a transportable array of instruments to march across the U.S. on a 70-km spaced grid and a backbone array of seven instruments to study deep mantle structure. The USMTArray started off small and before dedicated instruments were even available. In 2006, a pilot study collected the first 30 stations in eastern Oregon using borrowed instruments, while subsequent years expanded what became known as the ‘northwest’ footprint, a 331-sites array completed in 2011 encompassing the Yellowstone-Snake River Plain, the Northern Rocky Mountains, the Cascades magmatic arc, and the northern Basin and Range province. Subsequent footprints in the midcontinent and the eastern U.S. continued to expand coverage.
What were some of the challenges in developing the USMTArray?
The biggest challenge by far was money. Within the EarthScope program, the USMTArray was never funded at the level needed to cover the contiguous U.S. The MT component was instead carried out as a series of footprints in areas deemed most scientifically advantageous. This limitation, however, led to one of the big successes of the USMTArray – active community engagement. Siting workshops held in 2008 and 2013 brought together participants from academia, government, and industry to discuss and prioritize where the array would go next, while a community working group provided scientific and operational guidance throughout the life of the array. The success of the USMTArray was recognized early on by the community governance of the EarthScope facility activities, with the ‘full-48’ concept endorsed in 2009, leading to modest increases in funding and an acceleration of station completions. In 2018, by the end of NSF-sponsored activities, roughly 2/3 of the contiguous U.S. had been covered. Seeing the array to completion, however, required additional funding, a challenge met by NASA (2019-2020) and the USGS (2020-2024), in large part due to recognition of the importance of USMTArray data to space-weather hazards and supported through executive orders in 2016 and 2019.
Another notable challenge that we faced while developing the USMTArray operations was the absence of established data sharing practices within the magnetotelluric community. Indeed, the concept of FAIR data was only introduced in 2016. Back in 2006 when this program commenced, the concepts of open data and systematic data sharing were largely unfamiliar, and no widely adopted, sustainable data formats existed. Available data formats were lacking in flexibility, consistency, and self-descriptive metadata. As the project progressed, our team developed such formats and accompanying databases, which have now reached maturity and are helping to drive more sustainable MT data‑sharing practices internationally.
How has the development of the USMTArray advanced the scientific field?
The USMTArray, along with parallel advances in modeling capabilities and increased computational power, ushered in a jump to 3D MT and to interrogating the Earth at regional to national scales. National-scale conductivity models, such as those developed from the USMTArray, now join the ranks of other data sets like magnetic, gravity, and seismic, and are a new lens with which to view the architecture of the North American continent. Numerous contributions to continental architecture and assembly and to understanding active tectonic processes have come from the USMTArray.
Map of the United States underground electrical structure integrated over mid- to lower crustal depths, illustrating the resistive (dark) and conductive (hot) regions. The latter reflects ancient tectonic scars within the crust. Credit: Kelbert et al. [2026], Figure 17
The USMTArray also serves as a framework for more detailed studies, allowing Principal Investigators (PIs) to derisk future surveys and industry to investigate anomalous or unexpected structure. Studies of the Cascadia subduction zone and the adjacent magmatic arc and geothermal energy prospectivity studies in the Oregon Cascades and Great Basin have been built upon the USMTArray while new MT surveys along the eastern seaboard are collecting high-resolution MT data to improve space-weather hazard maps over areas identified as particularly at risk from the analysis of USMTArray data.
Beyond the data and models derived from them, the USMTArray has motivated methodological advances, led to an investment in MT instrumentation and open-source software for researchers within the NSF-supported National Geophysical Facility, and served as a model for other regional and continental scale MT experiments.
What are some of the future directions for research in continental scale magnetotellurics?
With completion of the USMTArray, and the 3D conductivity models derived from it, there are numerous avenues for future research. Most models of continental evolution, for example, were developed prior to the advent of this rich data set. Critically evaluating such models in light of this new data set is paramount, and initial studies are already forcing a reexamination of certain paradigms.
Multi-disciplinary studies incorporating geochronology, geochemistry, and rapidly evolving seismic models is another promising area as is the coupling of geophysical models to geodynamic models to examine the evolution of newly imaged model structure. Similarly, advancements in integrated and joint inversion are promising directions to leverage the wealth of public data sets available at regional to continental scales.
Geology doesn’t stop at national borders or the land-sea interface – additional opportunities exist for cross-border arrays and onshore/offshore MT studies. Investigation of subduction zone processes and rifted continental margins by their very nature demand an amphibious approach.
On the applied front, resource assessments increasingly are applied at national and even global scales and demand data support at these same scales. Mineral resource assessments, for example, in the U.S., Canada, and Australia are exploring machine learning approaches to map prospectivity for various deposit types and incorporate a range of geophysical data layers to do so. Similarly, geothermal assessments can benefit from the consistent and synoptic data coverage offered by USMTArray data and models.
Finally, on the space-weather hazards front, partnering with power-system engineers to investigate data scale and uncertainty shows promise in generating accurate hazard maps and in improving upon operational, near real-time geoelectric field models. For all these future research directions the USMTArray remains both a framework and a benchmark upon which to build.
Editor’s Note: It is the policy of AGU Publications to invite the authors of articles published in Reviews of Geophysics to write a summary for Eos Editors’ Vox.
Citation: Bedrosian, P. A., A. Kelbert, A. Schultz, and G. D. Egbert (2026), Mapping the hidden electrical anatomy of a continent, Eos, 107, https://doi.org/10.1029/2026EO265021. Published on 26 May 2026.
This article does not represent the opinion of AGU, Eos, or any of its affiliates. It is solely the opinion of the author(s).