Reading view

Stretching and Squeezing Release Glacial Meltwater

Crevasses on a glacier are seen from overhead.
Source: AGU Advances

As meltwater drains through and beneath a glacier, it can alter how the ice flows and whether it breaks apart. Meltwater can also cause feedbacks that lead to more ice loss. Understanding when and how glacial meltwater drains is therefore critical to predicting how fast glaciers will lose ice and how that loss will affect sea level.

Chudley et al. modeled how the rate of water flowing into a glacier relates to seasonal changes in the forces that squeeze and stretch ice—forces caused by gravity pulling the glacier downhill, by the ice sliding over subglacial water, and by how portions of the ice interact with the ocean.

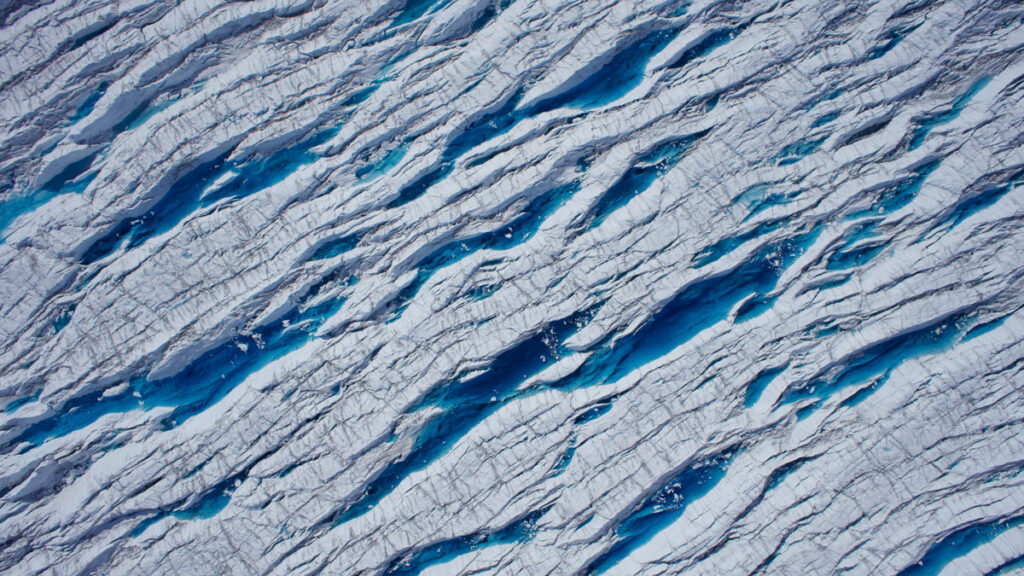
The researchers focused on the Sermeq Kujalleq glacier (also known as Store Gletsjer or Store Glacier) in Greenland. In spring, meltwater can fill cracks, or crevasses, that run through the surface of this glacier. These crevasses sometimes go on to drain as the year progresses.

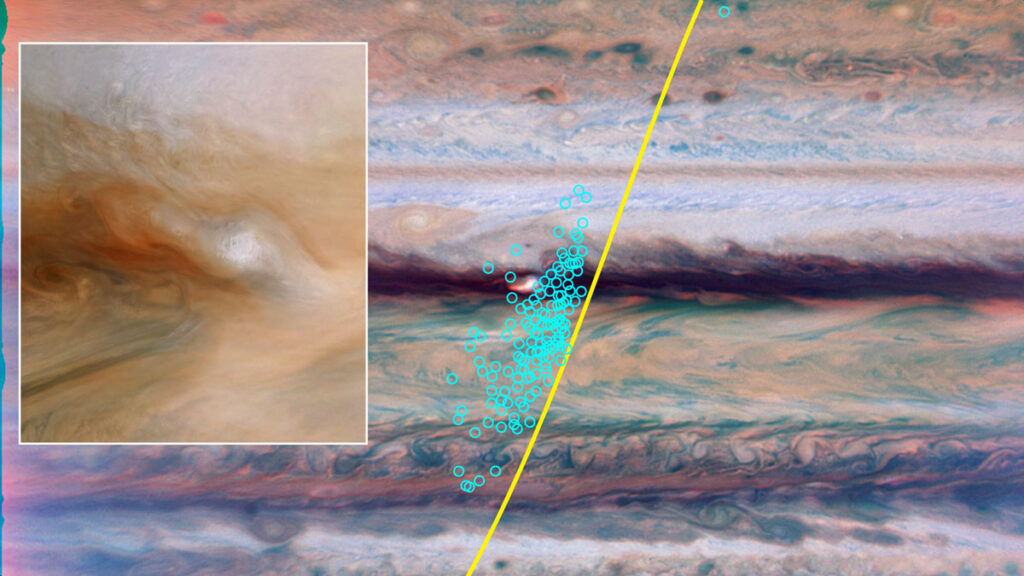
The researchers used satellite imagery from the Sentinel-2 mission to see how much water was present in crevasses between 2016 and 2022, focusing especially on 2019, when the Sentinel-2 satellites provided the best coverage of the glacier. They fed those data into a convolutional neural network to map water cover through the season and looked for a relationship between the mechanical forces acting on the ice and the formation and drainage of crevasse ponds.

The researchers found that the mechanical forces acting on ice are the dominant factor in determining when crevasse meltwater drains into a glacier. When seasonal changes cause ice to stretch, crevasses can drain suddenly, releasing the water they held.

The Greenland Ice Sheet sheds trillions of gallons of water each year, and knowing when to expect that water to drain through the ice sheet is key to understanding processes such as how the glacier slides across the bed and when meltwater emerges in the ocean. The study’s results likely also shed light on dynamic processes in other glaciers and ice sheets, the authors say, and should help inform representations of ice behavior in numerical models. (AGU Advances, https://doi.org/10.1029/2025AV002150, 2026)

—Saima May Sidik (@saimamay.bsky.social), Science Writer

A photo of a telescope array appears in a circle over a field of blue along with the Eos logo and the following text: Support Eos’s mission to broadly share science news and research. Below the text is a darker blue button that reads “donate today.”
Citation: Sidik, S. M. (2026), Stretching and squeezing release glacial meltwater, Eos, 107, https://doi.org/10.1029/2026EO260152. Published on 26 May 2026.
Text © 2026. AGU. CC BY-NC-ND 3.0
Except where otherwise noted, images are subject to copyright. Any reuse without express permission from the copyright owner is prohibited.
  •  

6.16亿年前波罗的大陆在哪里?

两个人,一个穿着黄色背心,一个穿着灰色长袖衬衫,正抬头看着一块岩石表面。
Source: Geochemistry, Geophysics, Geosystems

This is an authorized translation of an Eos article. 本文是Eos文章的授权翻译。

大约 6 亿年前,各大洲在地球上漂移,尚未最终定格在现在的位置。在埃迪卡拉纪时期,各大洲的位置对于科学家来说一直难以确定。地球的磁场似乎表现得异常不稳定,而利用标准方法根据磁场记录来计算大陆位置的做法却得出了一些难以置信的结果。尤其是,科学家们对一块名为波罗的大陆的古老大陆的位置存在争议,这块大陆如今是欧洲的一部分。

为了探究这一问题,Xue等人前往挪威埃格尔松德,采集了波罗的大陆地壳被撕裂、岩浆从下方涌出时形成的岩石样本。随着这些岩浆冷却凝固,它们记录了地球磁场的瞬时变化,并在此过程中存储了有关波罗的大陆位置的信息。

对这些样本的研究结果揭示了远比科学家们最初设想的更为复杂的古代岩石图景。这些岩石中至少包含了六种不同的磁信号,构成了一幅复杂的混合图景。其中一些信号似乎是在更现代的地质过程改变原始岩石时形成的。埃迪卡拉纪时期可能保存了三种不同的信号,其中两种与将波罗的板块置于赤道附近的最合理的埃迪卡拉纪信号相悖。这些相互矛盾的信号进一步支持了地球磁场在当时异常活动的观点,使原本就扑朔迷离的图景更加复杂。

基于新的研究结果,研究人员将埃迪卡拉纪时期埃格尔松德古地磁极的位置确定在北纬20.8°、东经89.0°——这与之前的研究结果有所不同——并提出波罗的板块当时位于赤道附近,毗邻古老的劳伦古陆,但相对于之前的重建结果,其位置略有顺时针旋转。这项研究表明,保存在古代岩石中的磁信号极其复杂,并凸显了将这些记录分解成各个组成部分的重要性。研究人员认为,这样做可以为埃迪卡拉纪时期地球磁场的神秘行为提供新的线索。(Geochemistry, Geophysics, Geosystemshttps://doi.org/10.1029/2025GC012730, 2026)

—科学撰稿人Saima May Sidik (@saimamay.bsky.social)

This translation was made by Wiley. 本文翻译由Wiley提供。

Read this article on WeChat. 在微信上分享本文。

A photo of a telescope array appears in a circle over a field of blue along with the Eos logo and the following text: Support Eos’s mission to broadly share science news and research. Below the text is a darker blue button that reads “donate today.”
Text © 2026. AGU. CC BY-NC-ND 3.0
Except where otherwise noted, images are subject to copyright. Any reuse without express permission from the copyright owner is prohibited.
  •  

Where Was Baltica 616 Million Years Ago?

Two people, one wearing a yellow vest and one in a gray long-sleeved shirt, look up at a rock face.
Source: Geochemistry, Geophysics, Geosystems

About 600 million years ago, the continents wandered Earth, yet to settle into their current positions. Their locations during the Ediacaran (as this time is called) have been tough for scientists to pin down. Earth’s magnetic field appears to have behaved in erratic ways, and applying standard techniques to calculate the continents’ positions based on records of the magnetic field yields implausible results. In particular, scientists debate the location of an ancient continent called Baltica, which is now part of Europe.

To investigate, Xue et al. traveled to Egersund, Norway, to collect samples of rock that formed during a time when Baltica’s crust was being pulled apart, allowing magma to percolate up from below. As that magma hardened, it recorded snapshots of Earth’s magnetic field, storing information about Baltica’s position in the process.

The results of studying these samples revealed a much more complex picture of the ancient rocks than the scientists initially envisioned. The rocks contained a messy mix of at least six magnetic signals. Several appeared to have formed when more modern geological processes altered the original rocks. Three distinct signals may have survived from the Ediacaran period, two of which diverge from the most plausible Ediacaran signal, which places Baltica near the equator. These conflicting signals further support the idea that Earth’s magnetic field was behaving strangely at the time, adding new complexity to an already puzzling picture.

On the basis of the new results, the researchers place the Egersund paleomagnetic pole at 20.8°N, 89.0°E during the Ediacaran—which diverges from previous results—and suggest that Baltica was located near the equator, adjacent to the ancient continent Laurentia, but rotated slightly clockwise relative to previous reconstructions. The study demonstrates the convoluted nature of the magnetic signals preserved in ancient rocks and the importance of dissecting those records into their constituent components. Doing so, the researchers suggest, can shed new light on the enigmatic behavior of Earth’s magnetic field during the Ediacaran. (Geochemistry, Geophysics, Geosystems, https://doi.org/10.1029/2025GC012730, 2026)

—Saima May Sidik (@saimamay.bsky.social), Science Writer

A photo of a telescope array appears in a circle over a field of blue along with the Eos logo and the following text: Support Eos’s mission to broadly share science news and research. Below the text is a darker blue button that reads “donate today.”
Citation: Sidik, S. M. (2026), Where was Baltica 616 million years ago?, Eos, 107, https://doi.org/10.1029/2026EO260124. Published on 5 2026.
Text © 2026. AGU. CC BY-NC-ND 3.0
Except where otherwise noted, images are subject to copyright. Any reuse without express permission from the copyright owner is prohibited.
  •  

超级闪电之外-隐形超级风暴揭示木星上的闪电

木星带有条纹和漩涡状图案的表面覆盖着一条从上到下延伸的黄色线条,与一系列蓝色圆点相交。旁边的小图展示了木星的更近距离特写。
Source: AGU Advances

This is an authorized translation of an Eos article. 本文是Eos文章的授权翻译。

木星的闪电一直是行星科学家关注的焦点,因为它标志着风暴活跃的区域,研究人员可以在这些区域深入研究以进一步了解木星大气中的对流现象。

远距离观测闪电并非易事,因此科学家们将研究重点放在最容易观测的闪电上:夜间发生的强闪电。因此,一些研究得出结论,木星上的闪电都与地球上最强的闪电——“超级闪电”——类似。然而,这一结论最近受到了质疑,因为NASA朱诺号探测器上的高灵敏度星体追踪相机探测到了微弱的浅层闪电

Wong等人进行了更深入的研究,重点观察了2021年和2022年木星北赤道带的闪电高度集中在一些强大的孤立风暴中的情形,研究人员将这些风暴称为“隐形超级风暴”。这种不寻常的气象条件使研究人员能够更精确地确定闪电的位置。

科学家们并没有仅仅关注可见光,而是利用了朱诺号探测器携带的微波辐射计Waves实验的数据。朱诺号在过去十年中一直在环绕木星运行。无线电波只是闪电产生的电磁辐射的一种形式,但它却是一种特别有价值的信息来源,因为即使云层或其他大气成分阻挡了视觉信号,科学家们仍然可以对其进行研究。这种方法使研究人员能够超越其他研究人员以往关注的那些强烈的夜间闪电,去探索其他类型的闪电。

研究人员报告称,在这些隐形超级风暴中,闪电无线电脉冲的出现频率为每秒三次,这与之前一些夜侧成像研究中的闪电频率相似。然而,这些闪电的强度仍然存在争议。一些闪电的强度可能与地球大气层中发现的平均闪电强度相似。但由于所分析的木星闪电信号和地球闪电信号的无线电频率存在巨大差异,有些闪电的强度也可能是地球闪电的上百万倍。

—科学撰稿人Saima May Sidik (@saimamay.bsky.social)

This translation was made by Wiley. 本文翻译由Wiley提供。

Read this article on WeChat. 在微信上阅读本文。

A photo of a telescope array appears in a circle over a field of blue along with the Eos logo and the following text: Support Eos’s mission to broadly share science news and research. Below the text is a darker blue button that reads “donate today.”
Text © 2026. AGU. CC BY-NC-ND 3.0
Except where otherwise noted, images are subject to copyright. Any reuse without express permission from the copyright owner is prohibited.
  •  

How to Study Coastal Evolution

A dense urban development is seen on a shoreline. Ominous clouds herald the onset of a storm, and waves lap against the shore.
Source: Earth’s Future

Coastal landscapes are constantly being reshaped by natural forces, and as climate change causes more frequent storms and sea level rise, that change will only intensify. Because these areas are densely populated with homes, tourist destinations, and industries, understanding how and where the coast will change is a pressing issue. However, reliable predictions that lead to actionable knowledge are rare.

Lentz et al. describe the state of knowledge regarding coastal evolution, highlight gaps in scientists’ understanding, and describe opportunities for integrating information from various models, data sources, and end users.

Current coastal evolution predictions are often focused on too specific a location and are therefore hard to generalize or analyze too large a region and therefore lack detail, the authors say. In addition, it’s challenging for researchers to link the effects of acute events, such as storms, with long-term trends like sea level rise.

Improving these simulations will likely require combining many different types of models, including physics-based numerical models, models based on empirical measurements, and statistical models that include machine learning. To fully understand potential changes, the authors note that it is also essential to consider both coastal processes and human actions.

The researchers recommend several ways to improve consistency and collaboration in the field of coastal change forecasting. First, standardizing approaches and outcomes would make it easier to produce national-scale predictions. Right now, the variety of tools used across different locations makes it difficult for scientists to compare results and communicate effectively. They also emphasize the need for using coordinated research approaches. Stronger transdisciplinary collaboration, accompanied by essential training and support, would also enable scientists to make better predictions, the researchers say.

Comparing predictions to real-world observations of coastal landscape change could also help untangle this multifaceted challenge. By studying how coastlines have already changed, researchers can validate models and choose those that are performing best. Such comparisons require datasets that adequately capture coastal landscape change across both time and space. Remote sensing data and the use of artificial intelligence (AI) for data processing may help provide these improved datasets, the researchers suggest.

Engaging end users during the project planning process is also helpful because only end users truly know what kind of information they need to adapt to landscape change. Knowing how to engage end users can be difficult for physical scientists, but various tools and specialized personnel exist who can help coordinate these interactions, the authors say. (Earth’s Future, https://doi.org/10.1029/2024EF005833, 2026)

—Saima May Sidik (@saimamay.bsky.social), Science Writer

The logo for the United Nations Sustainable Development Goal 13 is at left. To its right is the following text: The research reported here supports Sustainable Development Goal 13. AGU is committed to supporting the United Nations 2030 Agenda for Sustainable Development, which provides a shared blueprint for peace and prosperity for people and the planet, now and into the future.
A photo of a telescope array appears in a circle over a field of blue along with the Eos logo and the following text: Support Eos’s mission to broadly share science news and research. Below the text is a darker blue button that reads “donate today.”
Citation: Sidik, S. M. (2026), How to study coastal evolution, Eos, 107, https://doi.org/10.1029/2026EO260115. Published on 15 April 2026.
Text © 2026. AGU. CC BY-NC-ND 3.0
Except where otherwise noted, images are subject to copyright. Any reuse without express permission from the copyright owner is prohibited.
  •  

The Surprising Link Between a Cold Blob and the Indian Monsoon

A small tree bearing red flowers grows from a lush, green hillside with mist and a small waterfall in the background.
Source: AGU Advances

The Indian monsoon has shifted over the past quarter century. Northwest India now receives substantially more rain than it once did, while a lack of rain sends the Indo-Gangetic Plain toward drought.

More than a billion people rely on the monsoon to confer economic stability across southern Asia; further changes to this weather system could lead to widespread hardship. Scientists have struggled to predict how this weather pattern will change moving forward because commonly used climate models fail to capture changes to the monsoon that have already occurred.

Mahendra et al. suggest that models do not adequately represent either changes in the temperature of the Atlantic Ocean or how those temperature changes are linked to weather patterns around the rest of the globe. As a result, the coupled models tend to fail to predict this monsoon shift.

Specifically, current climate models lack the ability to incorporate information about the cold blob, a patch of cold water off the south of Greenland. When the researchers added the cold blob to climate model results, they found that it can alter the jet stream in a way that makes it pull moisture toward northwest India while also preventing storm systems from forming elsewhere. This is exactly the type of shift that has been observed in monsoon patterns. When a large-scale wind pattern prevents the formation of smaller-scale weather patterns in this way, it is called a barotropic governor mechanism.

This barotropic governor mechanism also explains why midlatitudes around the globe have observed more storm activity in recent years. The results highlight the importance of connecting processes from disparate parts of the globe when formulating climate models, the authors write. (AGU Advances, https://doi.org/10.1029/2025AV002173, 2026)

—Saima May Sidik (@saimamay.bsky.social), Science Writer

A photo of a telescope array appears in a circle over a field of blue along with the Eos logo and the following text: Support Eos’s mission to broadly share science news and research. Below the text is a darker blue button that reads “donate today.”
Citation: Sidik, S. M. (2026), The surprising link between a cold blob and the Indian monsoon, Eos, 107, https://doi.org/10.1029/2026EO260177. Published on 1 June 2026.
Text © 2026. AGU. CC BY-NC-ND 3.0
Except where otherwise noted, images are subject to copyright. Any reuse without express permission from the copyright owner is prohibited.
  •  
❌