Reading view

How Wildfires Worsen Flood Risk

A rocky stream flows through a landscape of burned trees. A mountain is visible in the background.
Source: Water Resources Research

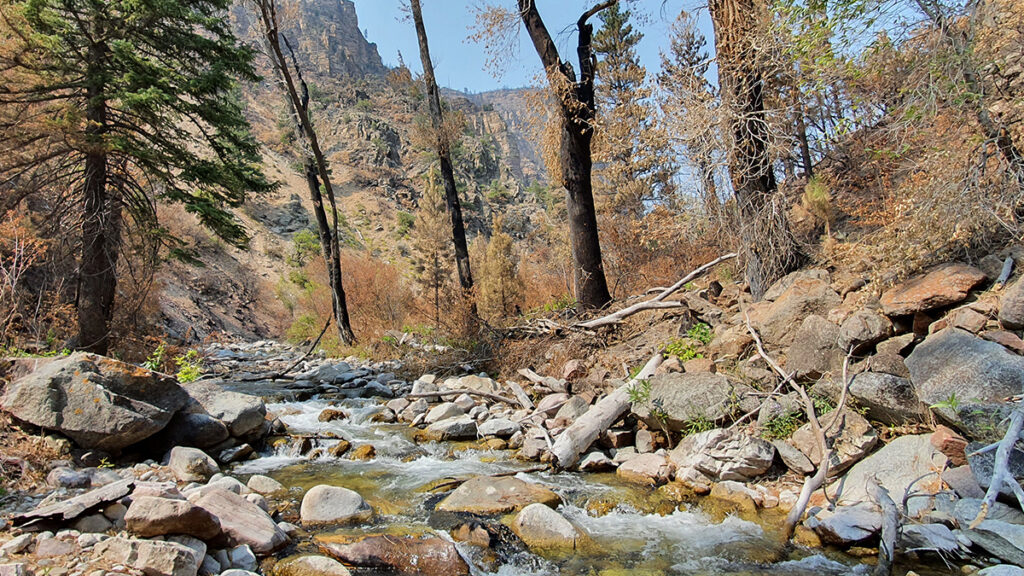
Wildfires can increase flooding risks in and downstream of burned areas by removing vegetation and disturbing hydrologic processes. As the climate changes, the severity of both wildfires and heavy rainfall events is increasing, meaning flooding is likely to become more severe in the near future. Better understanding how, and by how much, wildfires change flood risk is important for disaster and infrastructure planning for communities around the country.

Canham and Lane used streamflow data from the U.S. Geological Survey’s National Water Information System and precipitation data from the NOAA Analysis of Record for Calibration product to identify storms and quantify their effects across seven burned watersheds in the western United States.

To make the most of the limited data on flooding in the years following wildfires, the researchers created a paired-storms framework: They identified postfire peak flows (PFPFs), defined as the five highest peak flows within 3 years of a wildfire across seven watersheds. Then, for each precipitation event causing a PFPF, they looked for storms with similar characteristics (or paired storms) that occurred before the wildfire. Storm characteristics used for pairing included the season in which the storm occurred, recent precipitation, and precipitation depth, duration, and peak intensity.

The researchers found significantly elevated peak flows after wildfires in many cases, underlining the risks to communities following wildfires and validating their approach for use elsewhere.

Altogether, the authors found 26 PFPF events, including 20 with paired storms occurring before wildfires. For 75% of the postfire storms, their peak flows were 2 or more times greater than prefire peak flows. PFPFs were most likely to happen in the first year after a wildfire and typically occurred following storms that were centered upstream of the watershed centroid, were uniform in shape, and fully covered the watershed and burned area, the authors reported. They also found some evidence that the first storm in the year immediately following a fire has a higher-than-expected chance of producing a PFPF.

Future work could look more deeply at the characteristics of storms occurring over burned areas, such as storm direction and watershed recovery, and could apply the automated methods to more burned watersheds and storm events to enhance the robustness of the work, the authors say. (Water Resources Research, https://doi.org/10.1029/2025WR040693, 2026)

—Nathaniel Scharping (@nathanielscharp), Science Writer

A photo of a telescope array appears in a circle over a field of blue along with the Eos logo and the following text: Support Eos’s mission to broadly share science news and research. Below the text is a darker blue button that reads “donate today.”
Citation: Scharping, N. (2026), How wildfires worsen flood risk, Eos, 107, https://doi.org/10.1029/2026EO260133. Published on 30 April 2026.
Text © 2026. AGU. CC BY-NC-ND 3.0
Except where otherwise noted, images are subject to copyright. Any reuse without express permission from the copyright owner is prohibited.
  •  

Model of Complex Blanket Bog Improves Prediction of Peat Expansion

Map of the study area.
Editors’ Highlights are summaries of recent papers by AGU’s journal editors.
Source: Water Resources Research

Recent studies have shown the climatic envelope for blanket bog peatlands to be contracting, yet questions remain about what will happen to existing peatlands as they pass outside of this shrinking bioclimatic envelope.

DigiBog, a process-based model, accurately predicts peat depth in an area of very complex topography. This presents a significant advancement in modeling peat depth in areas with complex terrain. The implications of peat expanding at a faster rate on the relatively dry and steeper slopes, compared to the wetter basins, is contrary to the current thinking.

Despite being at the edge of the future climatic envelope for blanket bog, under all climate scenarios, the site continues accumulating peat until 2100, with the greatest accumulation occurring under the moderate Representative Concentration Pathway (RCP) 4.5 scenario. 

While peat thickness generally depends on wetness, wetness does not fully explain accumulation patterns in blanket bogs, with some very wet areas having only shallow peat accumulation.

Tom Winter’s conceptual model proposed that wetland vulnerability to climate change depends on wetness and the position within the hydrological landscape. Baird et al. [2026] does indeed show peat depth to have moderate to strong correlations with wetness. However, greater recent peat accumulation, and predicted future accumulation, is away from basins which contradicts Winter’s “wetter is better” and may be partially explained by the ability of peatlands themselves to engineer and alter landscape wetness.

Overall, ecohydrological models that are process-based are better than simple bioclimatic models for assessing future peatland carbon, when accounting for accumulation rates and spatial patterns.

Citation: Baird, A. J., Young, D. M., Ramirez, J. A., Gill, P. J., Morris, P. J., Peleg, N., et al.(2026). Assessing the response of blanket peatlands to climate change using the DigiBog model and winter’s concept of the “hydrologic landscape”. Water Resources Research, 62, e2025WR042050. https://doi.org/10.1029/2025WR042050

 —Paul Whitfield, Associate Editor, Water Resources Research, with input from Joshua Ratcliffe

Text © 2026. The authors. CC BY-NC-ND 3.0
Except where otherwise noted, images are subject to copyright. Any reuse without express permission from the copyright owner is prohibited.
  •  

Improving Eddy Tower Evapotranspiration Estimates

A red and white scaffolded tower is seen from above, poking far above a sea of trees below.
Source: Water Resources Research

Evapotranspiration is a critical link between water, energy, and carbon. Scientists need to understand it well to accurately predict weather, droughts, streamflows, and even carbon emissions.

Eddy covariance towers, which measure changes in the atmosphere, are one of the primary ways that scientists measure evapotranspiration in an ecosystem. But these measurements often have a problem with energy imbalance, in which the measured fluxes of sensible heat and latent heat add up to less than they should. (Sensible heat refers to measurable temperature changes occurring via conduction or convection, whereas latent heat refers to water in the atmosphere changing phases.) There’s something missing—up to 30% of the system’s energy—in the math, and that can cause problems for later uses of the measurements, from forecasts to climate policies.

Scientists can adjust evapotranspiration measurements to try to correct for this problem, but a commonly used method to do so assumes that the Bowen ratio, or the ratio between sensible and latent heat, remains constant. However, this assumption may be flawed.

Raghav and Kumar present a new way of tackling this old problem without making assumptions about the Bowen ratio. It’s based on water use efficiency, which is how effectively plants use water to produce biomass.

The method first uses a suite of data from an eddy covariance tower to estimate evapotranspiration and energy balance through time. Then it derives the underlying water use efficiency potential while accounting for the influence of atmospheric dryness. In general, for a given vegetation type, this potential underlying efficiency is considered to be relatively stable over a growing season. The statistically smoothed potential underlying water use efficiencies is then compared to reference values derived during periods when the energy balance is well constrained. The ratio of the two is then used to correct evapotranspiration.

The new method is more consistent and more tied to the physics of plant physiology than current methods when results from each are compared, the authors found.

The new method is appropriate for use with any eddy covariance tower location or dataset because the authors used data from more than 250 towers around the world, in a range of ecosystem and climate types, to build their approach. However, they add, it may be less reliable in environments where evaporation dominates transpiration, such as wetlands. Nevertheless, the authors say, this work marks an important advance in measuring evapotranspiration, with broad implications for water management, agriculture, and adapting to climate extremes and drought. (Water Resources Research, https://doi.org/10.1029/2025WR042766, 2026)

—Rebecca Dzombak (@rdzombak.bsky.social), Science Writer

A photo of a telescope array appears in a circle over a field of blue along with the Eos logo and the following text: Support Eos’s mission to broadly share science news and research. Below the text is a darker blue button that reads “donate today.”
Citation: Dzombak, R. (2026), Improving eddy tower evapotranspiration estimates, Eos, 107, https://doi.org/10.1029/2026EO260163. Published on 20 May 2026.
Text © 2026. AGU. CC BY-NC-ND 3.0
Except where otherwise noted, images are subject to copyright. Any reuse without express permission from the copyright owner is prohibited.
  •  

Let’s Not Forget About Long Droughts

Map of the study region with a graph.
Editors’ Highlights are summaries of recent papers by AGU’s journal editors.
Source: Water Resources Research

In the March 2026 issue of Water Resources Research, Zhang et al. [2026] interrogate conceptual hydrologic models’ ability to capture prolonged drought dynamics. The Australian Millennium drought serves as an example in the study. The results are quite sobering because the vast majority of more than 40 models fail. Unfortunately, calibration doesn’t generally help either and might result in massive overfitting. In essence, conceptual models miss deep aquifer storage components and associated hydrodynamic processes leading to a lack of time scales important in drought modeling. The study is a constructive reminder that model parsimony is not necessarily a good thing and that detailed representation of complex physical processes is part of hydrologic sciences.

Citation: Zhang, Z., Fowler, K., & Peel, M. (2026). Can conceptual rainfall-runoff models capture multi-annual storage dynamics? Water Resources Research, 62, e2025WR042226. https://doi.org/10.1029/2025WR042226

—Stefan Kollet, Editor, Water Resources Research

Text © 2026. The authors. CC BY-NC-ND 3.0
Except where otherwise noted, images are subject to copyright. Any reuse without express permission from the copyright owner is prohibited.
  •  

通往真正可持续太空供水系统的路径

国际空间站上的宇航员Kayla Barron将一个银色的金属圆筒(大小和汽水罐差不多)举到镜头前。
Source: Water Resources Research

This is an authorized translation of an Eos article. 本文是Eos文章的授权翻译。

如果人类想要在太空生活,无论是在航天器里还是在火星上,首先要解决的一个问题就是如何获取水,来满足饮用、卫生需求以及为维持生命所需的植物提供水分。即便只是将水运送到近地轨道上的国际空间站(ISS),也需要花费数万美元。因此,找到在太空中高效、持久且可靠地获取和再利用水资源的方法,对于长期在太空居住至关重要。

目前的系统,比如国际空间站上的环境控制与生命支持系统(ECLSS),为闭合式水回收提供了蓝图,但它们还需要改进才能适应未来的应用。与此同时,近期的技术和科学进步正为在严苛环境下寻找、净化和管理水资源开辟新的途径。在一篇新的综述中,Olawade等人概述了地外水资源管理的现状,以及该领域的前景和挑战。

作者指出,太空水系统需要具备闭环、高效和持久耐用的特性,同时还要满足低能耗的要求。目前,ECLSS能耗过高,其效率可能也不足以满足长期任务的需求。未来建议采用的过滤和回收方法包括:利用光催化技术通过光线净化水,利用生物反应器过滤尿液和废水,利用离子交换系统去除提取水中的溶解盐和重金属,以及利用紫外线臭氧消毒杀灭病原体。每种方法各有优缺点:例如,生物反应器中的微生物燃料电池可以发电,而光催化净化则能耗较低。

在月球或火星这样的地方获取水,要么需要从风化层中提取水,要么需要钻探冰体。如何为水回收系统提供足够的能源也是一个问题,因此开发节能系统是需要优先考虑的事项。水系统的耐久性也很重要,既要保护宇航员的安全,又要能减少繁重的维护工作。

新兴技术有望应对其中许多挑战。作者们指出两个具有巨大应用前景的领域,一是纳米技术的发展,它可用于制造定制化程度更高、过滤效果更佳且耐污染的膜材料,二是人工智能(AI)技术在水系统自主管理中的应用。(Water Resources Research, https://doi.org/10.1029/2025WR041273, 2026)

—科学撰稿人Nathaniel Scharping (@nathanielscharp)

This translation was made by Wiley. 本文翻译由Wiley提供。

Read this article on WeChat. 在微信上阅读本文。

A photo of a telescope array appears in a circle over a field of blue along with the Eos logo and the following text: Support Eos’s mission to broadly share science news and research. Below the text is a darker blue button that reads “donate today.”
Text © 2026. AGU. CC BY-NC-ND 3.0
Except where otherwise noted, images are subject to copyright. Any reuse without express permission from the copyright owner is prohibited.
  •  
❌