Media reports indicate that ten people were killed by the landslide and that a further 18 people were injured. Baining is located at [-4.2548, 151.7811], so I assume that this is the general area.
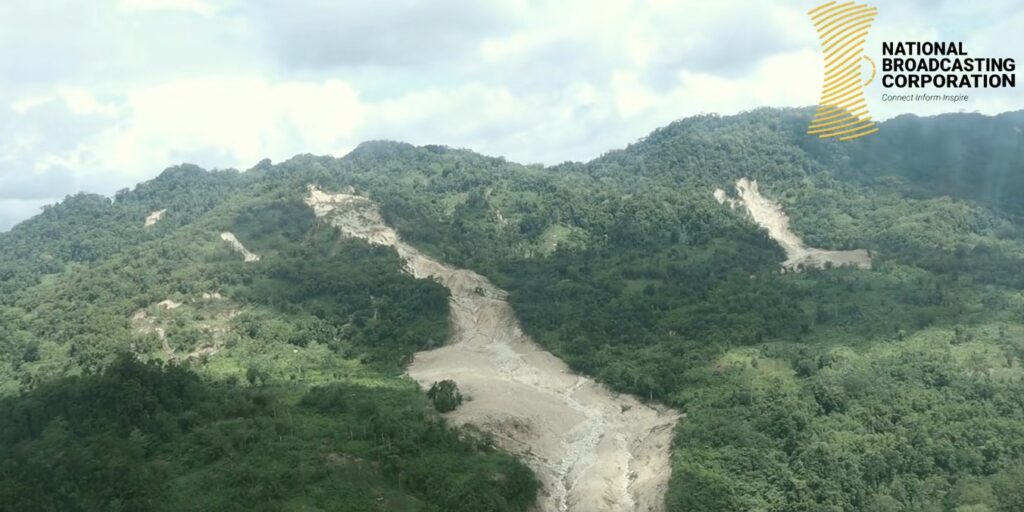
Gaining information about landslides in the remote areas of Papua New Guinea is very challenging – the terrain is rugged and there is a high level of civil turmoil. But the best source of information is on the Facebook page of NBC East Britain, which has posted a helicopter video of the aftermath. This is a still from that video:-
There are several interesting aspects of this landslide. First, the failure appears to have initiated high on the hillslope in an area that has a mix of forestry and cleared areas. The source appear to be quite large and deep-seated. This has transitioned into a disrupted debris slide / avalanche with a substantial amount of entrainment.
Note also the multiple other landslides in that area, all fresh, suggesting that the intense rainfall was sufficient to drive widespread failures. It is interesting to note though that is event did not involve multiple shallow landslides that combined to create a channelised debris flow.
A new study (Sun et al. 2026) shows that in six earthquakes in China between 2010 and 2022, landslides and rockfalls were responsible for at least half of the total fatalities.
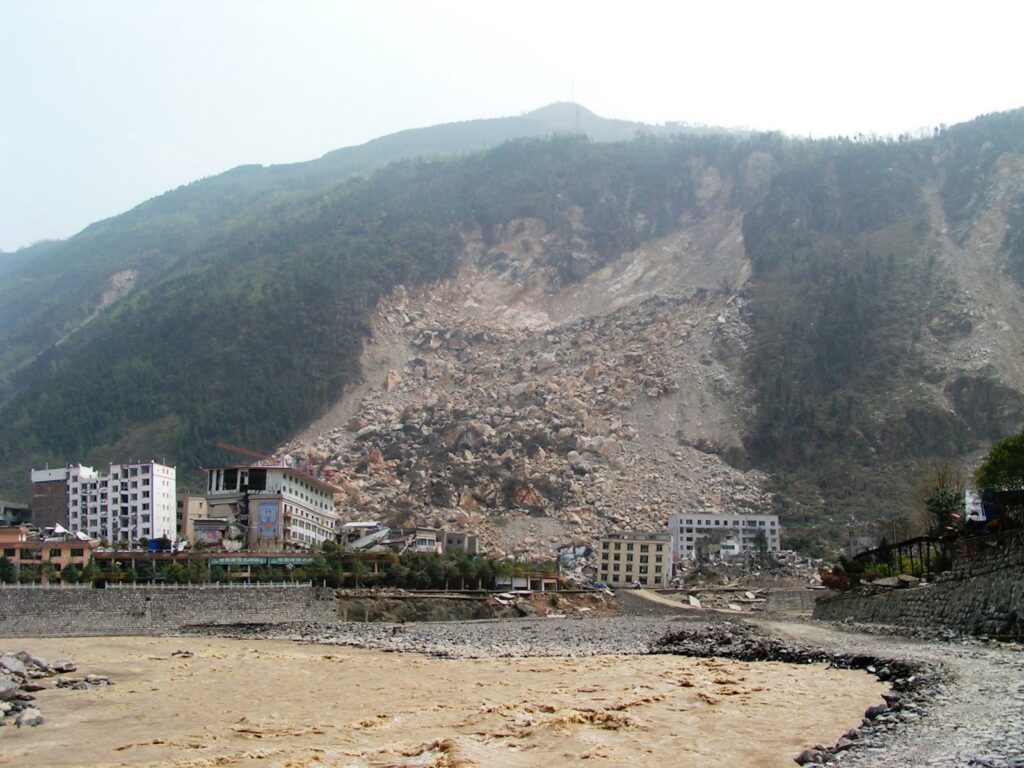
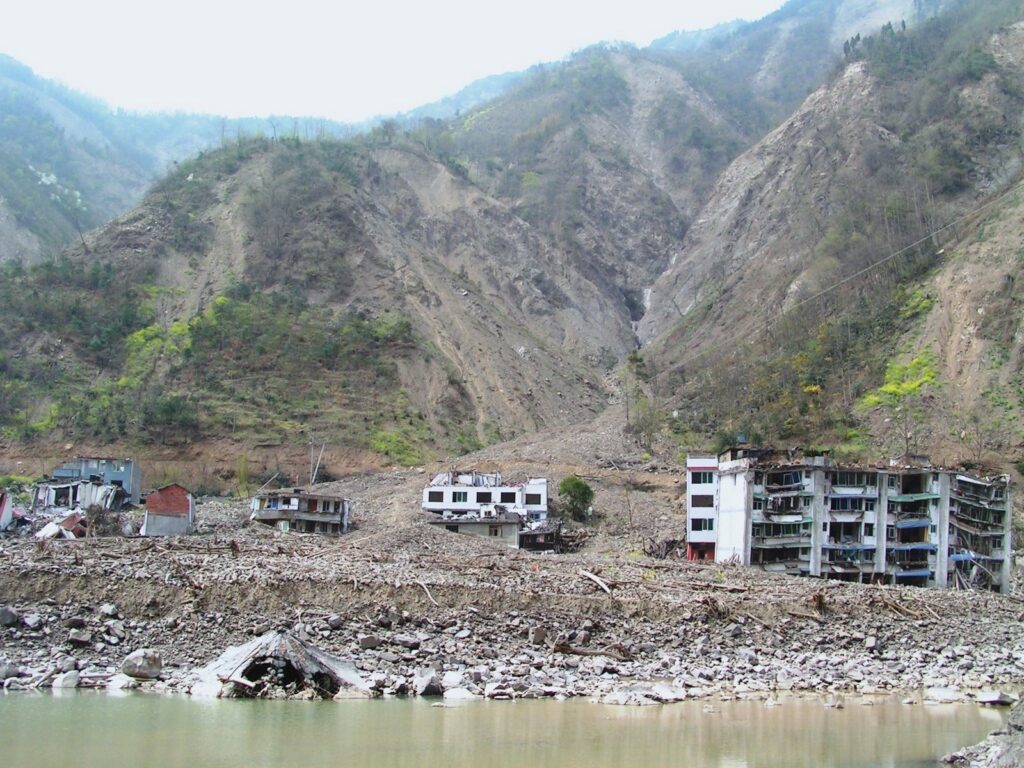
It is well-established that landslides are a major cause of loss of life in earthquakes in mountainous areas. The seismology maxim that “it is not earthquakes that kill people, it’s collapsing buildings” does not apply in its pure form in mountains – landslides also kill large numbers of people.
An earthquake triggered landslide from the 2008 Wenchuan earthquake.
However, the actual number of people killed by landslides in earthquakes is poorly understood. This is largely due to the challenges of collecting reliable information in the aftermath of a major earthquake, when the focus is on rescue and recovery rather than data collection. For this reason, many studies of landslide fatalities do not include seismically-triggered events. This is true of my own work.
However, a study has just been published (Sun et al. 2026) in the journal Natural Hazards Review that starts to address this issue. The paper nominally examines fatalities from all causes from earthquakes in China from 2001 to 2022. However, the authors note that the data has low reliability until 2010, so I’ll focus on the period from 2010 to 2022. I also note that the authors use the term “geological hazards“, which is a little broader than landslides. I should note that the paper isa broad look at fatalities from earthquakes – there is a much richer range of analyses than I will cover here.
In the period from 2010 to 2022, Sun et al. (2026) identified 14 earthquakes in which geological hazards caused loss of life. In some cases, the impacts were substantial. Thus, the M=6.5 3 August 2014 earthquake at Ludian in Yunnan led to 134 fatalities and 40 people missing from geological hazards from a total of 728 fatalities (c.24 % of the total), whilst the 5 September 2022 M=6.8 earthquake at Luding in Sichuan led to 76 geological hazard fatalities and 25 missing from a total of 118 fatalities (c.86% of the total). In six of the 14 examples, geological hazards caused at least 50% of the fatalities.
Sun et al. (2026) highlight that “fatalities from geological hazards concentrate in geologically complex, mountainous provinces, i.e., Sichuan, Yunnan, Gansu, Guangxi, and Guizhou”. They note that even small events can trigger fatal landslides – for example, six people were killed in a rockfall triggered by a M=4.3 earthquake in Guizhou in 2010, whilst a M=2.8 aftershock from the Yanjin earthquake in 2006 triggered a rockfall that killed a person.
This is an incredibly useful study. It starts to shed light on the impact of landslides in large earthquakes. It is not the definitive study, and questions remain – not least, the pattern of landslide losses in very large earthquakes, like the 2010 Wenchuan event, in which landslides were ferocious. But it forms the basis for such investigations, starting to fill a major gaps in our understanding.
As seismic waves travel through Earth, they gradually lose energy, a process called attenuation. That energy loss doesn’t happen uniformly—some features in the crust sap far more energy from seismic waves than others. Researchers can map underground features by watching where seismic waves lose more or less energy. The Southern Array for the Lithosphere and Uplift of Taiwan Experiment (SALUTE) is doing just that, providing information that could lead to improved seismic hazard planning in the country.
Lin et al. report attenuation results from SALUTE focused on the convergence between the Eurasian plate and the Luzon Arc, an understudied, geologically dynamic area where Earth’s crust is deforming. Using the overall attenuation rate and relative attenuation rates of P and S seismic waves, the authors imaged active faults, identified distinct lithologies, and better resolved the Luzon forearc block that sits just offshore of Taiwan.
The authors used data from the SALUTE high-density seismographic network, spanning December 2020 to December 2023, to construct both 2D and 3D attenuation models. They found clear changes in attenuation associated with major faults, as well as areas of high attenuation associated with fluid-rich, ductile zones in the lower crust that cause tectonic tremors. Their attenuation imaging additionally revealed that the Luzon forearc block, which had been poorly imaged in the past, dips northward and narrows as it nears the convergence zone.
The authors say their results agree well with previous velocity-based seismic imaging studies and show that attenuation can image features, such as transition zones, that were previously difficult to capture. Their data could also be useful for better understanding seismic hazard throughout the region, they note. (Geophysical Research Letters,https://doi.org/10.1029/2025GL121583, 2026)
Citation: Scharping, N. (2026), Seismic attenuation techniques reveal what lies beneath Taiwan, Eos, 107, https://doi.org/10.1029/2026EO260150. Published on 11 May 2026.
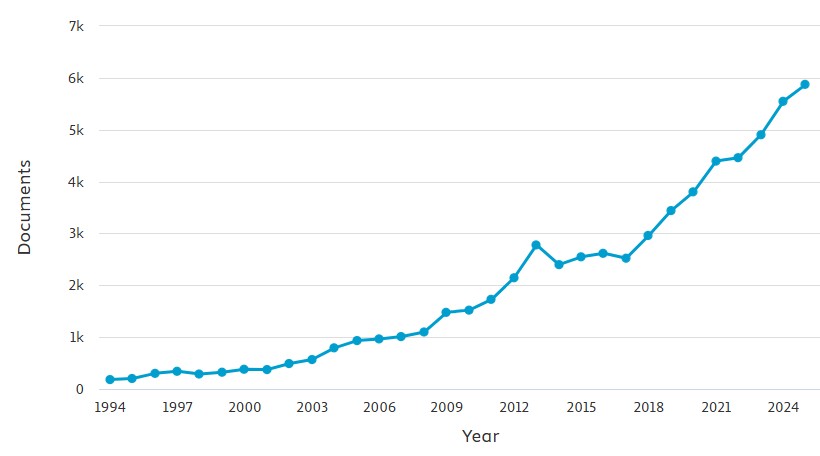
This graph, from Scopus, shows the number of research outputs per year that use the keyword “landslide”. It is simple and unfiltered:-
The number of outputs using the keyword “landslide” in the period 1994 to 2025 inclusive, via Scopus.
The extraordinary growth in productivity is clear – to put it into context, in 1994 the number of outputs was 182; in 2025, it was 5,875, a 32x increase. This is a remarkable improvement in the volume of our understanding of landslides, although it does not say anything about paradigm change.
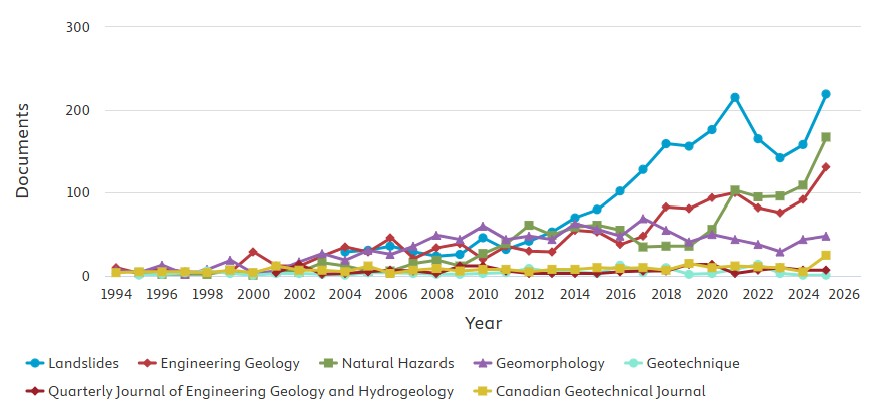
It is interesting to look at some of the key publications for landslide research:-
The number of outputs using the keyword “landslide” for selected key publications in the period 1994 to 2025 inclusive, via Scopus.
The journal Landslides started in 2004 and has shown remarkable growth (although note it still represents a tiny proportion of the total outputs per year). There are also large increases in the journals Natural Hazards and Engineering Geology, and a smaller increase for journal Geomorphology. On the other hand, those journals that traditionally would have been associated with landslide research, such as QJEGH, Canadian Geotechnical Journal and Geotechnique, have remained essentially static over time.
I suspect that this represents a growth in the academic areas researching landslides, and in particular a diversification from geotechnical engineering to a much more broader range of research that encompasses people with an interest in geomorphology, remote sensing, geophysics and natural hazards.
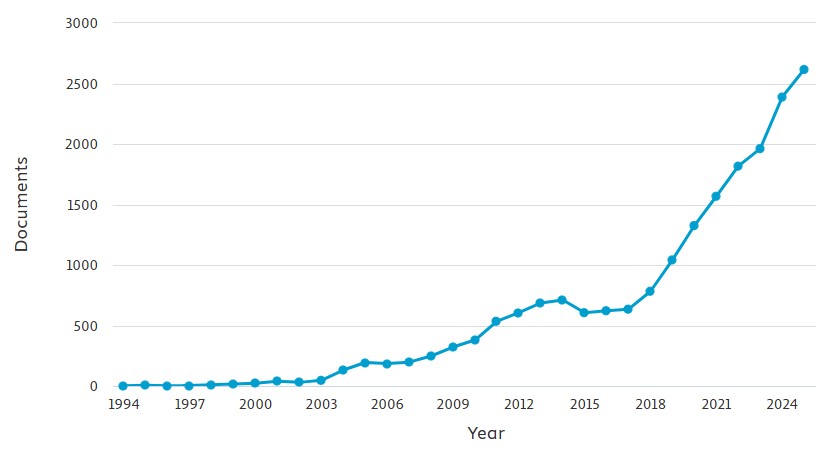
There is one other element that is important here too, which is the growth of landslide research in China. This graph shows the same data as above but with China as the national affiliation of one or more author:-
The number of outputs using the keyword “landslide” and with an affiliation from China in the period 1994 to 2025 inclusive, via Scopus.
The growth in landslide research productivity in China is explosive over the last ten years, and with 2,616 outputs in 2025, Chinese affiliated authors are now producing over 55% of the world’s landslide research. There is no doubt as to where the centre of gravity now lies in landslide science.
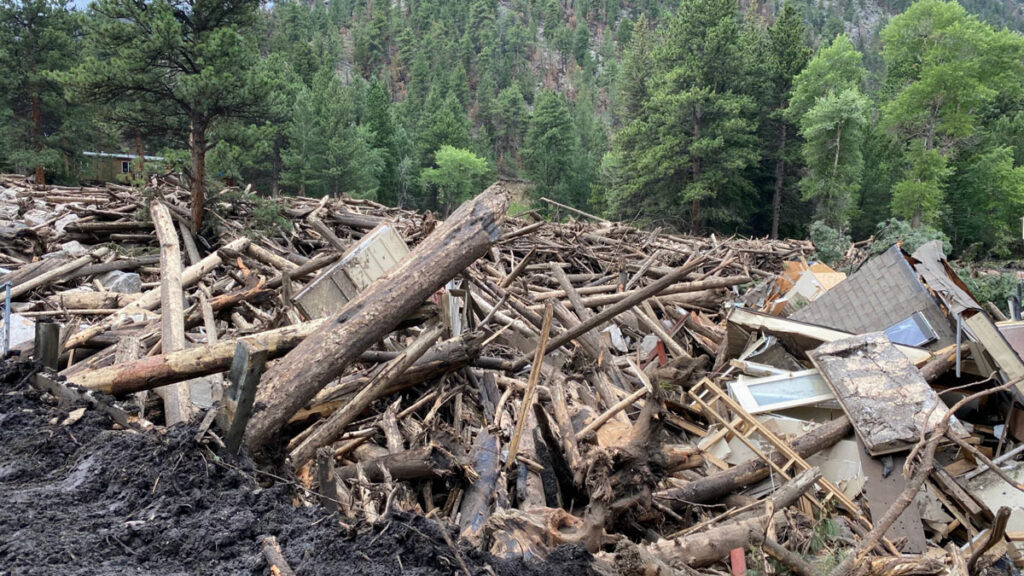
Months after wildfires eliminate vegetation that holds hillside sediment together, debris flows—destructive landslides that carry bulky material down once-stable slopes—can devastate infrastructure, taking out roads and buildings in their wake.
Though the U.S. Geological Survey (USGS) creates hazard predictions used to warn communities of the risk of these postfire debris flows, those predictions haven’t fully considered how recovering vegetation reduces risk over time—until now.
A new study published in Geosphere presents a new way to calculate postfire debris flow risk that takes vegetation recovery into account. The USGS will begin using the new method this wildfire season to create more accurate maps of debris flow hazard in the years after a fire.
“I’m so appreciative that the focus on how the debris flow hazard changes over time after fire is being addressed,” said Nancy Calhoun, a geologist and postwildfire debris flow program manager at the Washington Geological Survey who was not involved in the new study. Calhoun said she relies on the USGS hazard assessments for virtually everything her job requires.
“We’re glad to have a way that we can help our partners moderate those situations where the hazard has decreased,” said Andrew Graber, a geologist at the USGS Landslide Hazards Program and lead author of the new study.
Assessing Hazard, Again
After a wildfire, the USGS creates hazard maps that incorporate information about soil type, steepness, and burn severity (how much vegetation has been lost) to show where the risk of a debris flow may be elevated.
Then, the agency distributes this guidance to the National Weather Service, which uses it to set rainfall thresholds: levels of rainfall at which a debris flow becomes likely. State, county, and city agencies use those rainfall thresholds to issue warnings or take action when rainfall is imminent, for example, by closing highways or triggering evacuations.
“That left us with some uncertainty when we started to get further away in time from the fire.”
The methods used to create the USGS maps, however, historically relied on a snapshot of the burned area taken just after the fire, and the maps weren’t updated to reflect conditions as vegetation grew back and began holding soil in place again.
That led to situations where public safety decisions were made on the basis of outdated maps and rainfall thresholds. For example, concern over debris flows after the 2020 Grizzly Creek Fire in Colorado led to several closures of Interstate 70 in 2022, but the debris flows never happened.
“What [the original assessments] didn’t capture is how the vegetation came back,” Graber said. “That left us with some uncertainty when we started to get further away in time from the fire.”
Intense rainfall in July 2025 triggered a debris flow near Dayton, Wyo., in the 2024 Elk Fire burn area. Credit: USGS, Public Domain
To test an improved method for these hazard assessments, Graber and the research team incorporated satellite imagery of 12 burned areas that showed the degree of vegetation recovery right after the fire, 1 year after the fire, and 2 years after the fire. Then, they tested their new method by comparing its predictions to rainfall and debris flow data from the 12 burned areas.
The updated method better reflected what had actually happened after the fires, reducing the number of unnecessary warnings without missing real-world debris flows.
Risk Recalibration
The USGS plans to begin using their new workflow to create hazard maps for some higher-profile fires during the coming wildfire season.
“It’s a really important question: Are we still worried about this burn scar?”
That’s exciting for Calhoun. As part of her job, she’s in constant contact with emergency managers who periodically ask how worried they should be about debris flows in areas that burned years ago. “It’s a really important question: Are we still worried about this burn scar?” she said.
Right now, Calhoun has no data to point to in the years after a fire to give an updated answer to that question. Using the new method from Graber and the research team, she will.
“Because they’re using satellite [imagery] and repeatable quantitative methods to look at these burn scars over time, we’ll actually be able to say something useful and informed about vegetation recovery,” she said.
Having a deeper understanding of how debris flow risk evolves over time is especially important because debris flows themselves are becoming a greater risk to the public as a result of increasingly intense wildfires and rainstorms. In addition, more accurate assessments can reduce warning fatigue, which occurs when too many false alarms lead to people ignoring or opting out of alerts.
Graber hopes he and the USGS will continue to improve their methods for assessing debris flow hazards by collecting more debris flow data across the country and improving the underlying equation for hazard assessments so that it better reflects the unique conditions of different ecosystems in the United States. USGS researchers also published a new study in March presenting a method to generate maps of where debris flows might travel if they do occur.
“It’s a big year for USGS’s useful postfire products,” Calhoun said.
This news article is included in our ENGAGE resource for educators seeking science news for their classroom lessons. Browse all ENGAGE articles, and share with your fellow educators how you integrated the article into an activity in the comments section below.
Citation: van Deelen, G. (2026), A new approach can better predict debris flow hazards years after fires, Eos, 107, https://doi.org/10.1029/2026EO260160. Published on 19 May 2026.
A new paper Fidan et al. (2026) demonstrates that wealth and the rate of land-cover change play a key role in determining the occurrence of fatal landslides in mountain areas. These factors are statistically more significant that precipitation and topography.
A fascinating new paper (Fidan et al. 2026 – this paper is both open access and published under a Creative Commons licence – hurrah!) has just been published in the journal Science Advances that explores rates of land-cover (in the paper, the authors use the term land-use – land-cover) change as a factor in determining fatal landslides in mountains globally. I must admit to some degree of personal interest in this paper, although I am neither an autor nor a reviewer, as it brilliantly uses the dataset that Melanie Froude and I collated on global landslide fatalities (see Froude and Petley 2018). I’m delighted to see our data being used in this way (and please do contact me if you want a copy of the spreadsheet).
Fidan et al. (2026) explores a range of factors that might influence the occurrence of fatal landslides from the perspective of either increased vulnerability (poorer people may live in more vulnerable locations for example) or increased landslide likelihood (land-cover change might increase the likelihood of a landslide being triggered, for example).
The fascinating result lies in land-cover change. The authors have looked at approximately 60 years of land-cover changes in mountainous areas across 46 countries. Unsurprisingly, there is substantial change, especially in low- and lower-middle–income countries, often involving the loss of forest (which as a first order estimation, may buffer against slope failures), although the pattern is far more complex of course. Fidan et al. (2026) find that a key metric is the rate of change of land-cover, and that this is linked to the rate of population growth (perhaps unsurprisingly). Countries with high rates of population growth also show high rates of change of land-cover.
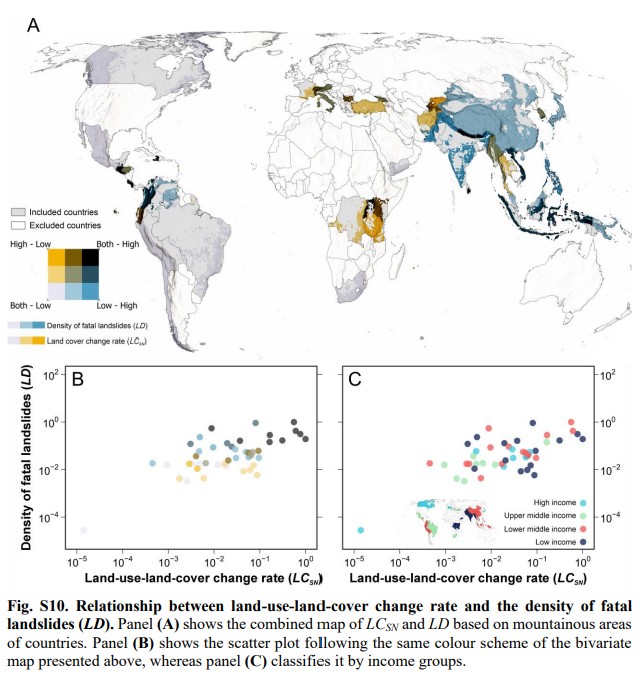
In many ways, the most interesting figure in this study is in the Supplementary Information. It is a complex diagram, but it’s worth more detailed analysis:-
The relationship between the land-cover change rate and the density of fatal landslides for mountain areas around the world. Figure from Fidan et al. (2026), published under a Creative Commons Licence.
The main map (A) shows mountain areas with high rates of land-cover change (orange), high density of fatal landslides (blue) or both (black). The left hand graph (B) shows the relationship between the landslide density and the rate of change of land-cover – here, higher rates of land-cover change are associated with a higher density of fatal landslides. The right hand graph is the same data as in (B), but with each point coloured according to the income level of the country. High income countries have a lower fatal landslide density. Thus, as the authors conclude, wealth and land-cover change appear to control fatal landslide density.
There is a really surprising element to this study, which I think requires more consideration. I think I should allow the authors themselves to express this finding, from the abstract:-
“Our statistical analyses show that land-use – land-cover changes have a substantially greater influence on the density of fatal landslides and landslide fatalities than physical factors such as topography and precipitation, especially in lower-income countries.”
As landslide researchers, we almost always default to topography and precipitation as being key in landslide occurrence. There are sound reasons for doing so. But statistically, the rate of land-cover change plays a more important role in mountain areas, especially in poorer countries.
This has (or should have) major implications for the way that we consider and manage landslide risk in such areas.
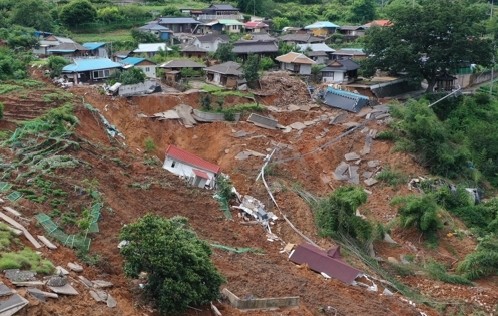
On 19 July 2025, record-breaking rainfall triggered a landslide that destroyed 26 buildings. Plans are now being developed to permanently relocate the community.
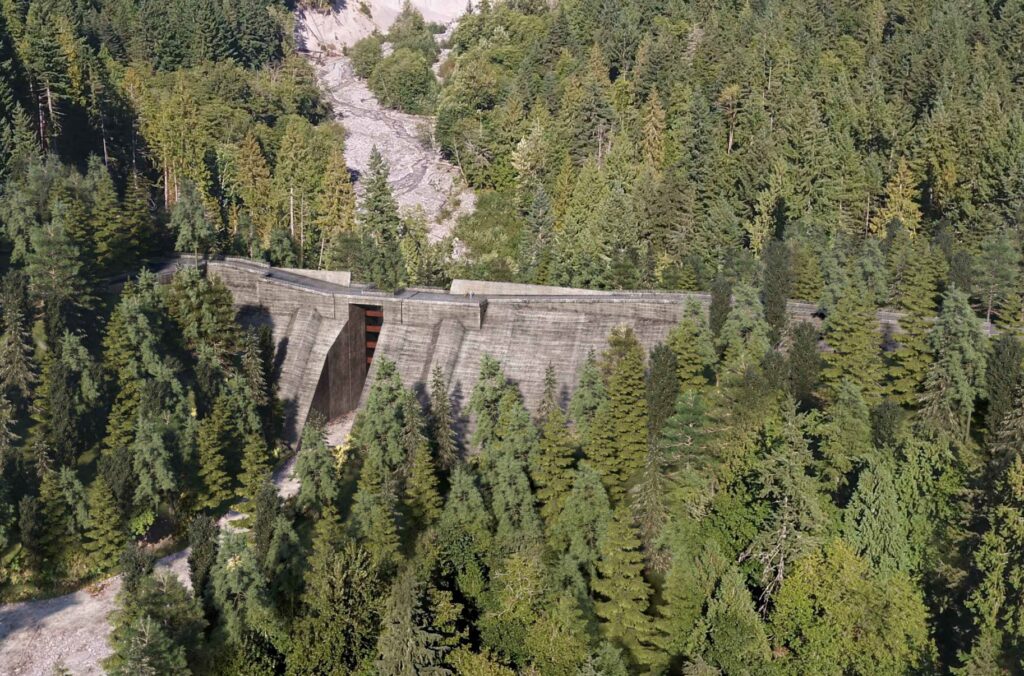
In British Columbia a CAN$115 million project is almost complete to mitigate the risk posed by debris flows to the town of Squamish.
Upstream of the town of Squamish in British Columbia, Canada, an extraordinary project is underway to mitigate the risk of debris flows. Known as the Cheekeye Debris Barrier Project, the scheme involves the construction of a concrete barrier that is 24 metres high across the Cheekeye Fan, designed to catch debris flows with a volume up to 2.4 million cubic metres of debris.
This is a fascinating project that makes a great case study for teaching, not least because both the detailed design considerations and the regulatory process for approving the programme are available in detail.
In terms of the detailed design considerations, there is an excellent open access paper in the Canadian Geotechnical Journal (Lesueur et al. 2025) that provides a very comprehensive analysis of the estimation of the potential volume and mobility of the debris flows on the Cheekeye Fan, and of the considerations that went into the final deisign of the structure.
I would highlight the challenges around determining the optimal size of a barrier of this type. The team has been balancing risk against cost, following the principle as outlined in Lesueur et al. (2025):-
“The local government specifies that tolerable debris-flow risks be reduced “as low as reasonably practicable” (ALARP), defined in this project as the point where the cost of additional mitigation measures is grossly disproportionate to the benefits gained.”
Thus, the barrier is not designed to stop the maximum credible debris flow, which is 5.5 million cubic metres (more than double the design event). This is pragmatic engineering at its best, and the Cheekeye Debris Barrier Project provides the level of detail that allows the decision-making process to be fully understood.
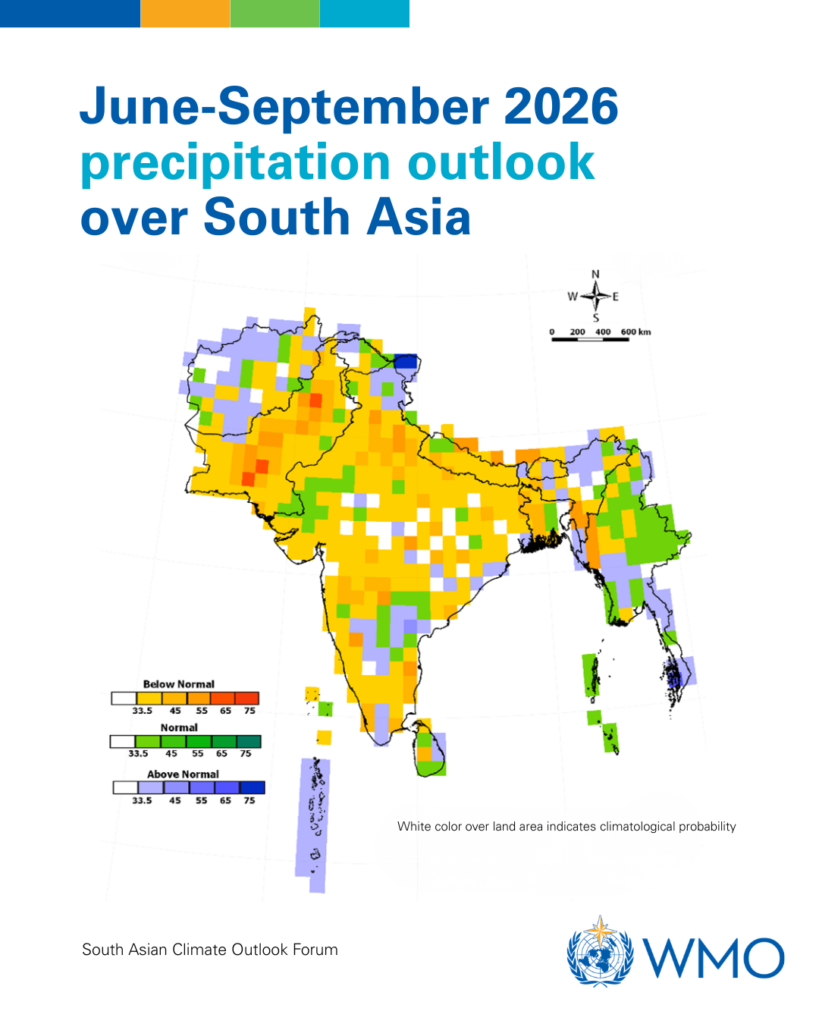
Forecasts for the 2026 South Asia monsoon are for below average rainfall, but some of the most landslide prone areas of India may receive totals that are above average.
The global pattern is dominated by the South Asia (southwest / summer) monsoon, so it is interesting at this point to to consider the prospects for this year. The monsoon itself is expected to start in SW India next week, timing that is normal. It will then build over the following month or so.
The current forecast for the monsoon itself is that the total rainfall is likely to be below average. This is the WMO forecast:-
The WMO 2026 South Asia monsoon forecast from the WMO.
Of course, in landslide terms we are interested mainly in SW India (Kerala), which has a below average forecast, and the mountainous areas of Pakistan, India, Nepal, Bhutan and Bangladesh. Much of this is also forecast to receive below average precipitation, but note the above average forecast for parts of northern India (Jammu and Kashmir, Himachal Pradesh) and NE India (Sikkim, Arunachal Pradesh). These are some of the most landslide-prone areas of India, suggesting that we may well see substantial landslide challenges in these areas.
The caveat of course is that monsoon-triggered landslides are sensitive to rainfall intensity as well as rainfall magnitude. A below average monsoon can bring intense rainfall events that trigged catastrophic landslides. Unfortunately, the forecasts cannot resolve this issue.
As an aside, the next few days in the European Alps will be interesting. We are about to see a few days of unusually high temperatures, which are likely to drive a wave of snowmelt and permafrost thawing. Given the time of year, this could well trigger extensive rockfall activity.
Unfortunately, by the time I get to Switzerland in nine days the weather is forecast to have reverted to cool drizzle!
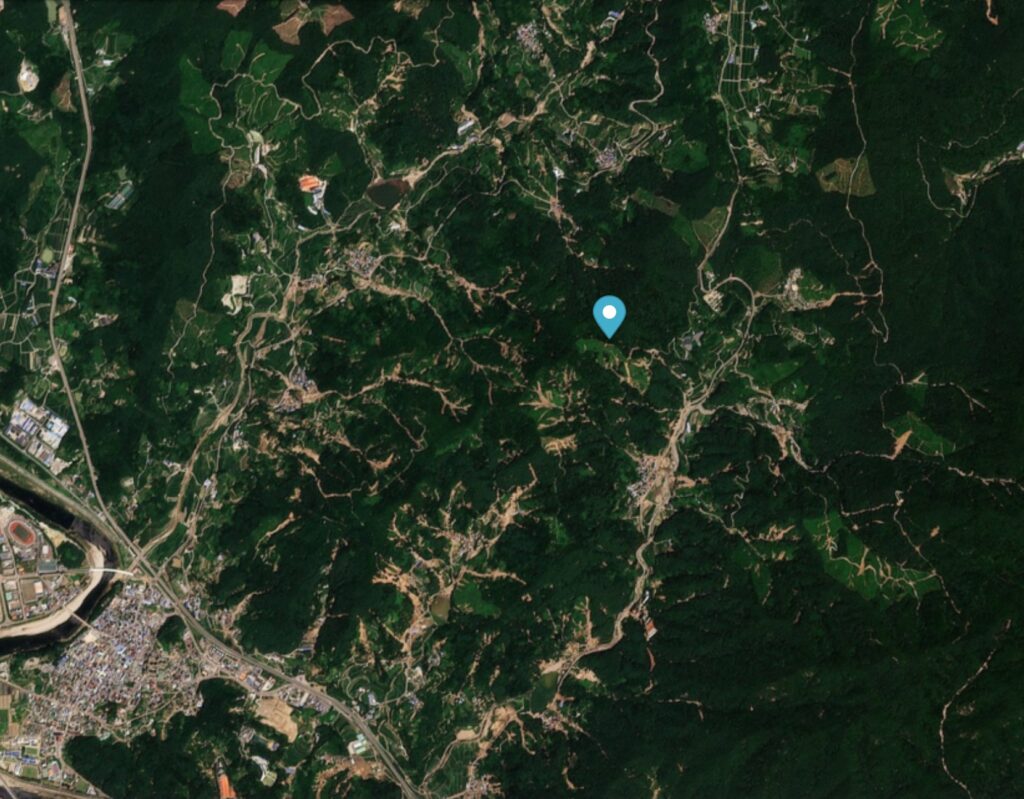
The core of the affected area is at [35.4333, 127.9111] (as usual, Landslides provides the location in degrees minutes and seconds when digital degrees is so much more useful – a pet frustration of mine!). This is a Planet Labs image of a part of the area, captured before the event. The marker is at the coordinate noted above:-
Planet Labs image of a part of the area affected by landslides during heavy rainfall in Sancheong County, South Korea on 19 July 2025. Image copyright Planet Labs, used with permission. Image dated 10 July 2025.
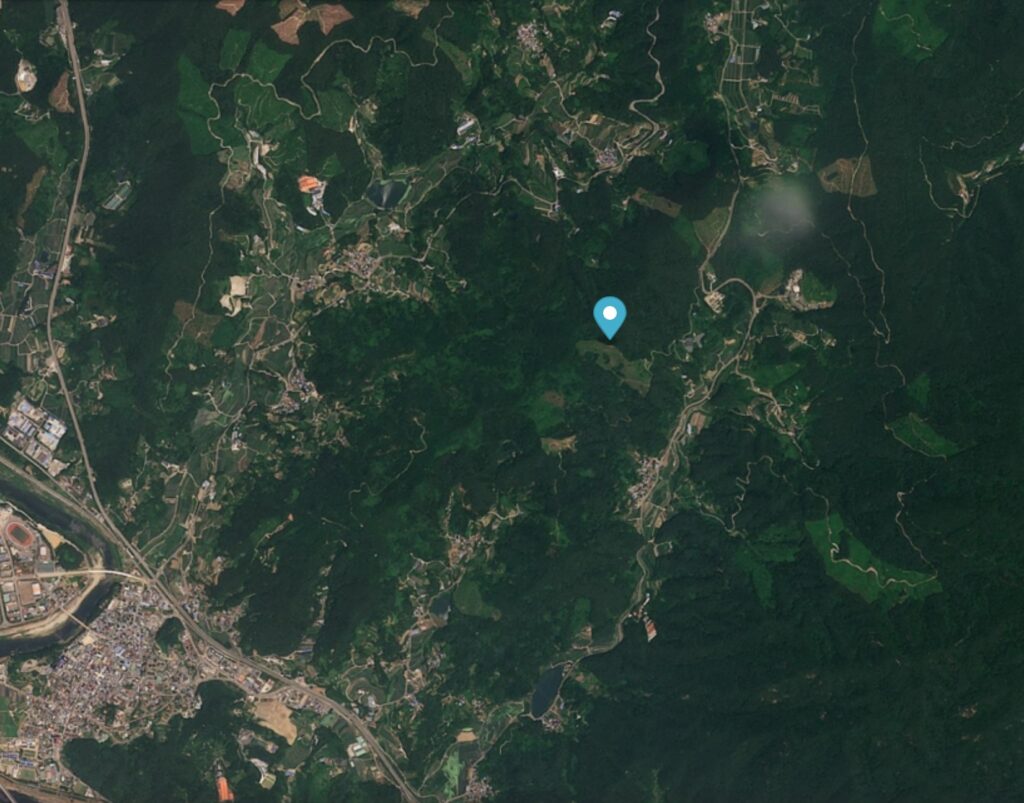
And this is the same area after 19 July 2025:-
Planet Labs image of a part of the area affected by landslides during heavy rainfall in Sancheong County, South Korea on 19 July 2025. Image copyright Planet Labs, used with permission. Image dated 23 July 2025.
Nguyen et al. (2026) have mapped 568 individual landslides triggered by this rainfall event, triggered by rainfall in the range of 498 – 619 mm over a c. 55 hour period. These landslides killed at least 10 people and caused damage to homes and infrastructure. It is estimated that the restoration costs are in the order of US$800 million.
In common with many other events of this type, the landslides are mainly shallow, translational failures in soil or regolith on steeper slopes. As I have frequently noted, such terrain is very susceptible to unusually intense rainfall events, which often trigger a cluster of landslides in close proximity. These often merge to form channelised debris flows. Nguyen et al. (2026) note however that their modelling indicates that it was a combination of the intensity of the rainfall and its duration that led to these failures.
As rainfall intensities increase due to climate change, we are seeing increasing numbers of these landslide clusters. I greatly welcome studies such as Nguyen et al. (2026) , which allow us to build understanding in each case.
A new paper in the journal landslides (Yang et al. 2026) details the 6.8 million cubic metre Huangci Landslide in China, which was a reactivation on a slope that has suffered two other failures in recent decades.
On 10 December 2025, failure occurred in the large Huangci landslide in Gansu Province, China. The event is described in a new paper (Yang et al. 2026) in the journal Landslides (this link should provide access even though the article is paywalled). The paper is fascinating as this is a very complex slope with an interesting history of deformation, and because large failures do not usually occur in the winter months in this part of China.
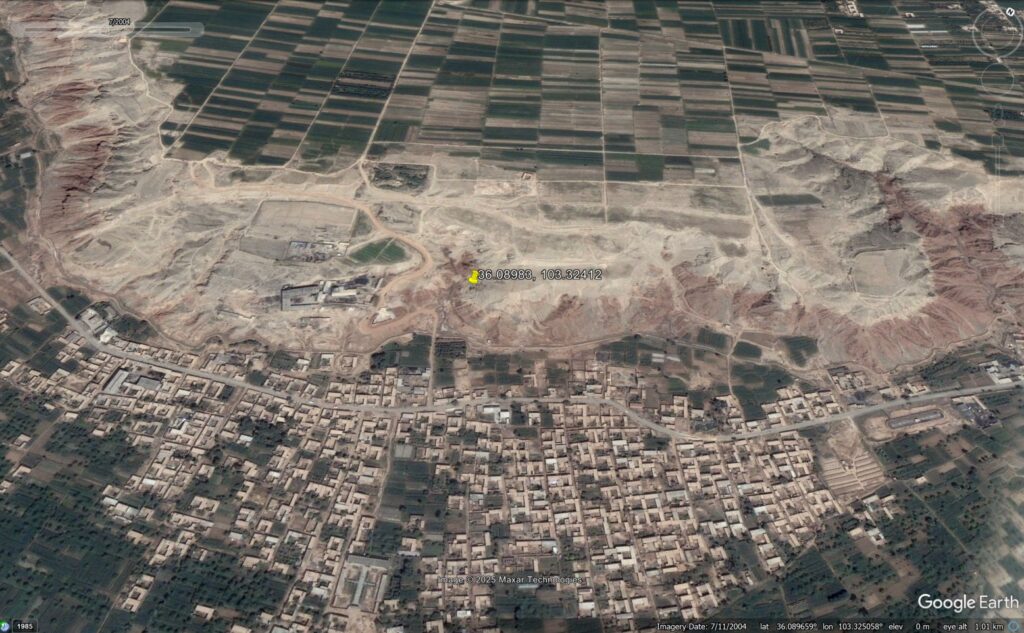
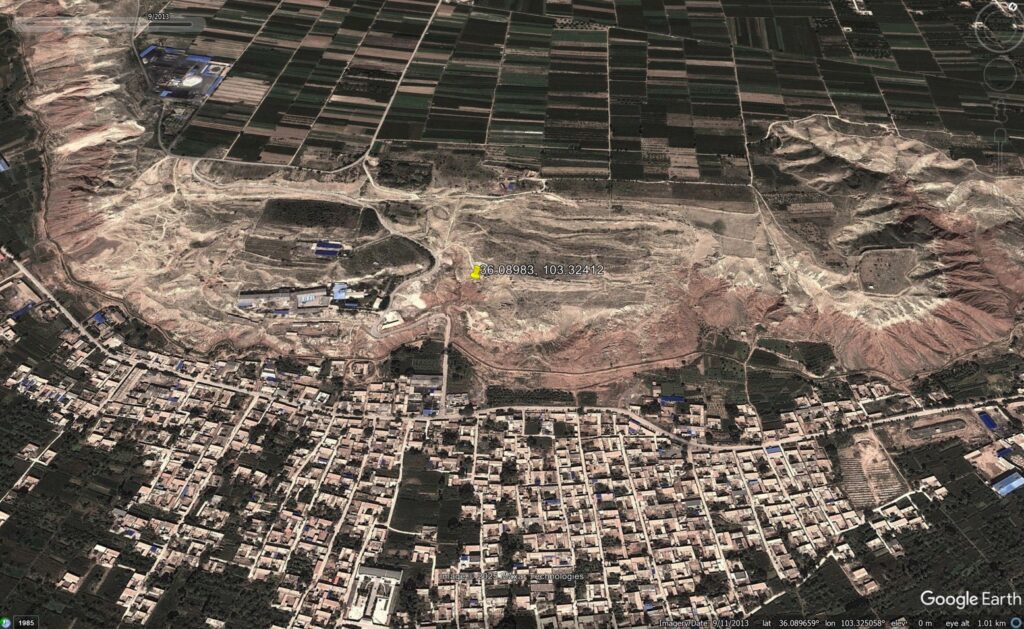
The location of the Huangci landslide is [36.08983, 103.32412]. This is a Google Earth image of the site, captured in 2004:-
Google Earth image of the Huangci landslide in 2004.
The geology consists of loess overlying mudstones. As the image above shows, the site had previously failed. The houses at the foot of the slope are the homes of people displaced in 1968 during the impoundment of the Liujiaxia Reservoir. Note also the farmland on the terrace behind the landslide. This is an arid area, so this farming requires extensive irrigation.
According to Yang et al. (2026), the failure that can be seen in the image above occurred on 30 January 1995. About 6 million cubic metres of rock and loess were involved, creating a landslide with a width of about 500 metres and a length of about 370 m.
The Huangci landslide failed again on 14 May 2006, this time with a volume of about 4 million cubic metres. The image below, captured in 2013, shows the aftermath:-
Google Earth image of the Huangci landslide in 2012.
In this failure, 10 houses were destroyed.
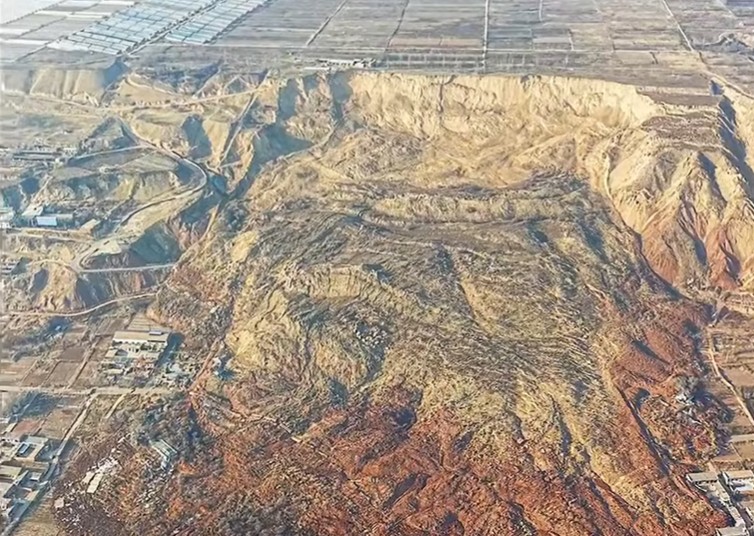
The most recent failure of the Huangci landslide occurred on 10 December 2025. This time, a larger mass failed, creating a landslide with a volume of about 6.77 million cubic metres, a length of up to about 740 metres and a width of up to about 420 metres. There is a spectacular video on Youtube showing the aftermath of the failure:-
The still below gives an impression of the scale of the failure:-
According to Yang et al. (2026), this failure destroyed 39 houses plus a range of infrastructure that includes power transmission systems, irrigation systems, water supply systems and transportation facilities. The site had been successfully evacuated as a result of a community-operated early warning system.
As noted above, this is an unusual time of the year for a landslide of this type. However, Yang et al. (2026) conclude that the underlying driver is irrigation on the terrace upslope from the landslide, driving a rise in the groundwater and consequent progressive deformation of the slope. This led to weakening of the mudstones that were buttressing the failure, eventually triggering collapse.
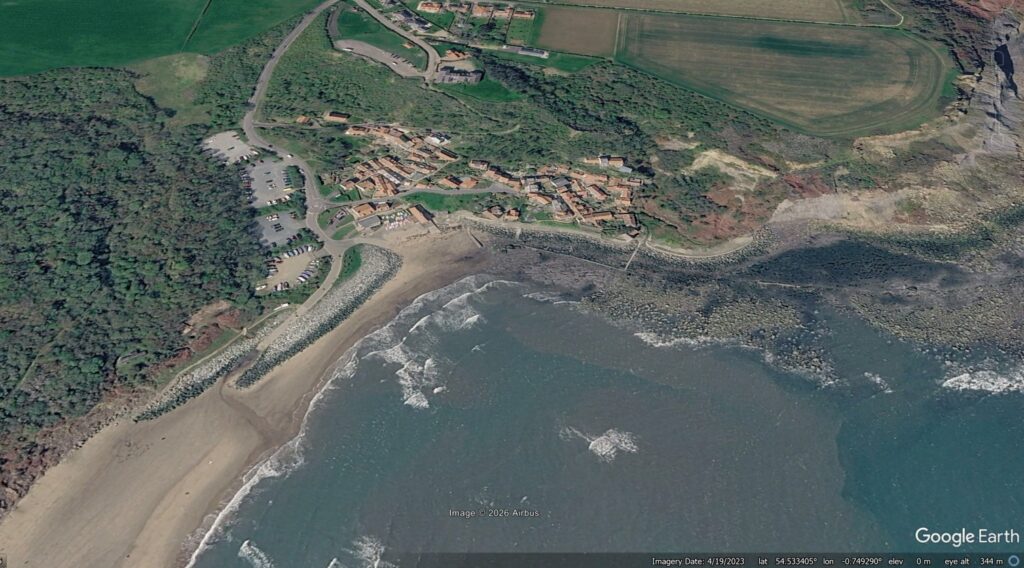
The Tees Valley Museums site describes the landslide of 1662, noting that there were two major failure events. It is very fortunate that no-one was killed. The village was essentially destroyed and then rebuilt to the south of the original site.
It is probably true to say that the painting by Jotter is not a classic, but it does capture some interesting aspects of the site. First, it appears that the morphology is that of an existing landslide mass – this was probably a reactivation rather than a first time failure. Second, the toe was actively eroding, so maybe the two phase failure involved a collapse at the toe, which then destabilised the mass upslope? This would fit the eyewitness reports. Finally, note the mass in the background, which is also the result of a series of failure events.
There are many other major landslides along this section of coast – it is a classic area of UK mass movement geology. And it is truly beautiful too – visit if you can.