For an NBA team thriving on the new (new coach, new mix of players, new horizons), the New York Knicks have been headlining a decidedly old medium: radio. WFAN, which pioneered sports talk when it launched in 1987, has been aflame with Knicks conversation since April as the team has pursued its first championship since […]
For an NBA team thriving on the new (new coach, new mix of players, new horizons), the New York Knicks have been headlining a decidedly old medium: radio. WFAN, which pioneered sports talk when it launched in 1987, has been aflame with Knicks conversation since April as the team has pursued its first championship since […]
CBS News Radio shuttered on Friday after nearly a century of broadcasting, with its final newscast coming to close with the voice of Edward R. Murrow and his famous sign off, “Good night, and good luck.” Then came the final words around 11:31 p.m. ET, “CBS News special report. I’m Christopher Cruz.” The network announced […]
CBS News Radio shuttered on Friday after nearly a century of broadcasting, with its final newscast coming to close with the voice of Edward R. Murrow and his famous sign off, “Good night, and good luck.” Then came the final words around 11:31 p.m. ET, “CBS News special report. I’m Christopher Cruz.” The network announced […]
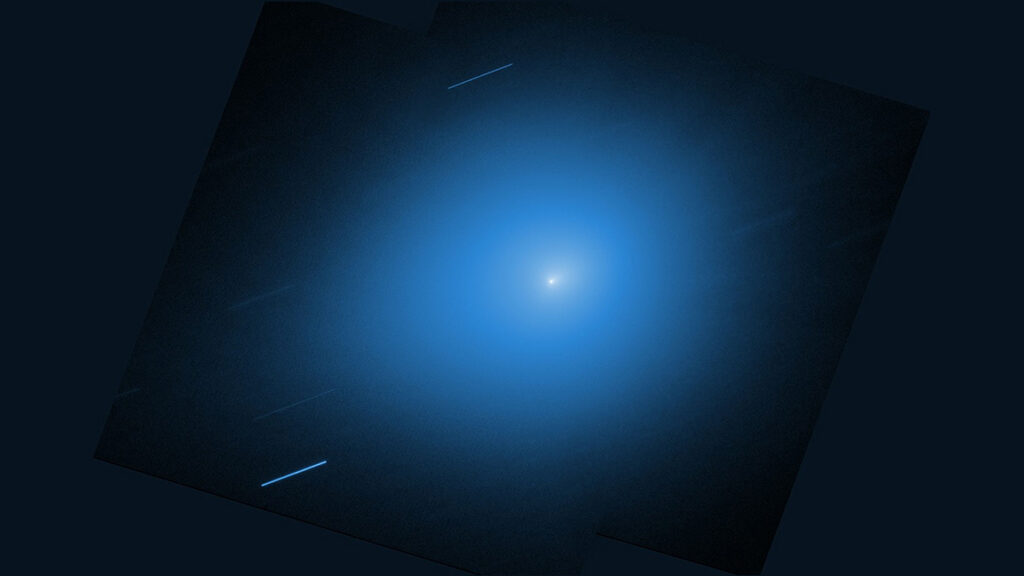
In late 2025, astronomers spotted an interstellar comet making a quick trip through the solar system. 3I/ATLAS was discovered in July when it was just inside Jupiter’s orbit. It’s now about halfway between Jupiter and Saturn and getting farther away every day.
The European Space Agency’s Jupiter Icy Moons Explorer (ESA JUICE) mission, on its way to Jupiter, imaged 3I/ATLAS on 5 November 2025 when the comet was 64 million kilometers from the spacecraft. Credit: ESA/Juice/JANUS, CC BY-SA 3.0 I
In late 2025, astronomers spotted an interstellar comet making a quick trip through the solar system. 3I/ATLAS was discovered in July when it was just inside Jupiter’s orbit. It’s now about halfway between Jupiter and Saturn and getting farther away every day.
The European Space Agency’s Jupiter Icy Moons Explorer (ESA JUICE) mission, on its way to Jupiter, imaged 3I/ATLAS on 5 November 2025 when the comet was 64 million kilometers from the spacecraft. Credit: ESA/Juice/JANUS, CC BY-SA 3.0 IGO
Astronomers have been observing 3I/ATLAS throughout its journey inward toward the Sun and back out again, compiling the most comprehensive and detailed view thus far of an interstellar object, including the chemistry of the gases that sublimated from its surface and formed its coma and tail.
In a first-of-its-kind observation of an interstellar object (ISO), researchers have discovered that the ratio of deuterium to hydrogen in 3I/ATLAS’s outgassed water is 30–40 times higher than in solar system objects. That suggests that the comet formed in a much colder environment than our own solar system did.
“It is always hard to really pinpoint where these objects form,” said Luis E. Salazar Manzano, the lead researcher on these observations and a doctoral student at the University of Michigan in Ann Arbor. “We know that they were formed in different parts of the galaxy, but it’s hard to connect what we measure with how they were formed. These types of measurements, such as the relative abundance of deuterium to hydrogen in water, are one of the best ways we have to actually [learn] about their forming conditions and their evolution.”
Coming In from the Cold
Water appears to be ubiquitous throughout the universe, sprinkled within distant galaxies and in star-forming nebulae. But there are different flavors of water: heavy, semiheavy, and plain old H2O. In the molecular clouds where stars form, the cold environment favors a chemical reaction that increases the amount of gaseous deuterium (D), an isotope of hydrogen, relative to regular hydrogen atoms. That deuterium then bonds with hydrogen and oxygen atoms to create semiheavy water, or HDO.
By measuring the quantity of semiheavy water relative to regular water in an object, scientists can infer the object’s ratio of deuterium to hydrogen, or D/H, and decode the physical conditions in which that water formed. Astronomers have made such measurements for baby stars, planet-forming disks, solar system comets, and meteorites, as well as Earth’s ocean.
“What is fundamentally important about ISOs is that they are physical leftovers of the process of forming another planetary system and they can give us clues to that process,” said Karen Meech, an astrobiologist at the University of Hawaiʻi at Mānoa who was not involved with this research.
“The conditions in the stellar system in which 3I/ATLAS formed may have been quite different from the one in the solar system.”
The team observed 3I/ATLAS with the Atacama Large Millimeter/submillimeter Array (ALMA) in Chile on November 2025 when the comet was 335 million kilometers (208 million miles) from Earth. It had just passed its closest approach to the Sun and was as bright as it was ever going to be. This timing was critical for the measurements the team wanted to make because the signal for HDO is very subtle, especially when it has to compete with the much more abundant H2O in the comet and within Earth’s atmosphere, Salazar Manzano explained.
Those measurements showed that for every 1,000 hydrogen atoms in 3I/ATLAS, there were about 5–7 deuterium atoms. While that’s not a lot, the ratio is still at least 40 times more than what’s found in ocean water and at least 30 times the average value in solar system comets.
“The conditions in the stellar system in which 3I/ATLAS formed may have been quite different from the one in the solar system,” said Paul Hartogh, a physicist and atmospheric science researcher at the Max Planck Institute for Solar System Research in Göttingen, Germany.
The first interstellar object, 1I/ʻOumuamua, did not outgas any material, and although the second object, 2I/Borisov, did, it was not bright enough to detect deuterium. 3I/ATLAS was the first opportunity astronomers had to measure the D/H ratio of an interstellar comet. Those measurements suggest that 3I/ATLAS formed in a much colder galactic environment than the solar system did, less than 30°C above absolute zero. The team published these results in Nature Astronomy in April.
Planning for the Next Interstellar Visitor
Hartogh, who was not involved with this research, said that on the one hand, 3I/ATLAS’s high deuterium enrichment is surprising because it is higher than that of any known comet. On the other hand, he added, some scientists predicted such high values for cometary water several decades ago.
Meech said she found these results “really interesting.” She never expected all other solar systems to have formed just like ours, and 3I/ATLAS fits with that idea.
“This gives us an intriguing look into the processes of planetary system formation—and that there are differences from our own solar system,” Meech said. “It is too early to tell what this implies for the formation of planets or habitable worlds. We are just at the beginning of an exciting story.”
“The fact that we were able to make this measurement with 3I will allow us to better prepare what to expect with the next generation of interstellar objects.”
3I/ATLAS is getting harder to see with telescopes, but astronomers still have a lot of data from when it was much brighter to go through, Salazar Manzano said. Teams around the world are working on creating a holistic picture of the comet’s chemistry and evolution.
What’s more, “the fact that we were able to make this measurement with 3I will allow us to better prepare what to expect with the next generation of interstellar objects,” Salazar Manzano said.
Scientists expect that the Vera C. Rubin Observatory could discover between 6 and 51 interstellar objects within the next 10 years. If objects are detected early enough in their journey through the solar system, “there may be enough time to coordinate observations with ground-based and spaceborne telescopes, taking advantage of the recent experience gained by the multiple 3I/ATLAS observations,” Hartogh said.
“These are rare opportunities to study another planetary nursery up close, and we have to take advantage of each new ISO to learn as much as we can,” Meech said. “It may be harder for a large number of individual teams to get all the data they want, so I think coordination and collaboration is needed more than ever.”
Citation: Cartier, K. M. S. (2026), Interstellar comet was born in a very cold place, Eos, 107, https://doi.org/10.1029/2026EO260141. Published on 7 May 2026.
Bill Ritter, anchor on WABC since 2001, said he’s stepping down but will continue to report on the diseaseA longtime New York City television news anchor has announced his sudden retirement from the airwaves after revealing that he has the early signs of Alzheimer’s disease.Bill Ritter, a veteran of ABC New York station WABC, has presented the main evening news in New York since 2001 and become a familiar face to millions of its residents. Continue reading...
Bill Ritter, anchor on WABC since 2001, said he’s stepping down but will continue to report on the disease
A longtime New York City television news anchor has announced his sudden retirement from the airwaves after revealing that he has the early signs of Alzheimer’s disease.
Bill Ritter, a veteran of ABC New York station WABC, has presented the main evening news in New York since 2001 and become a familiar face to millions of its residents.
Editors’ Highlights are summaries of recent papers by AGU’s journal editors.
Source: Journal of Geophysical Research: Atmospheres
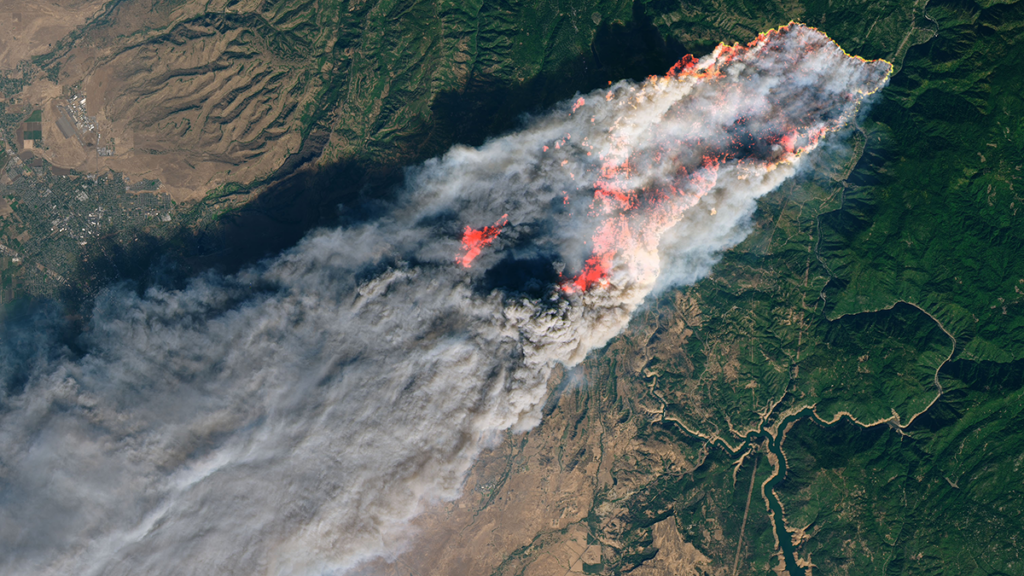
The 2018 Camp Fire was the deadliest and most destructive wildfire in California history. The Camp Fire spread extremely rapidly, driven by strong winds and dry fuels, but also by organized long-range spotting, i.e. lofting and downwind fallout of burning embers to ignite new fires.
Using operational Doppler radar and satellite observations, Lareau [2026] pr
Source: Journal of Geophysical Research: Atmospheres
The 2018 Camp Fire was the deadliest and most destructive wildfire in California history. The Camp Fire spread extremely rapidly, driven by strong winds and dry fuels, but also by organized long-range spotting, i.e. lofting and downwind fallout of burning embers to ignite new fires.
Using operational Doppler radar and satellite observations, Lareau [2026] provides the first high resolution depiction of spotting behavior during an extreme wildfire. Observations show that spot fire events for the Camp Fire occurred 5-10 kilometers ahead of the fire front, quickly merging into new fire lines. Spot fires are not random but aligned within coherent fallout zones that are shaped by plume dynamics and background winds. These results show that operational weather radar can identify lofting and fallout regions in real time, providing a new way to anticipate spotting-driven fire spread and improve early warnings for fast-moving wildfires.
(a) Along wind cross section of Camp Fire plume reflectivity observed by radar measurements, showing distinct updrafts (white arrows) and ashfall regions (blue dashed arrow). Spot fires within 10 minutes of these radar measurements are shown as filled cyan triangles. (b) Map of column maximum radar reflectivity and fire perimeter. In both panels the black dashed line indicates the eastern edge of the town of Paradise, California. Credit: Lareau [2026], Figure 6ab
Citation: Lareau, N. P. (2026). Plume-coupled long-range spotting drove the explosive spread of the 2018 Camp Fire. Journal of Geophysical Research: Atmospheres, 131, e2025JD045798. https://doi.org/10.1029/2025JD045798
The retreat of glaciers and ice sheets is expected to have widespread impacts on communities around the world because of its effect on sea levels. Already, the global average sea level is more than 10 centimeters higher than it was just 3 decades ago; and the rate of rise is increasing, contributing to increased storm surges and flooding, lost infrastructure and community lands, and more.
Recent reports on the instability of Antarctica’s Thwaites Glacier, for example, have focused attention
The retreat of glaciers and ice sheets is expected to have widespread impacts on communities around the world because of its effect on sea levels. Already, the global average sea level is more than 10 centimeters higher than it was just 3 decades ago; and the rate of rise is increasing, contributing to increased storm surges and flooding, lost infrastructure and community lands, and more.
Recent reports on the instability of Antarctica’s Thwaites Glacier, for example, have focused attention on how accelerating ice flow can lead to ice sheet collapse and rising sea levels.
Earth’s ice sheets accumulate ice through snowfall and lose mass through a mix of surface ablation, iceberg calving, and melting at their interface with the ocean. Glacial ice flows under its own weight, and the rate at which it flows to coastal areas is a primary control on ice sheet mass loss.
Flow rates depend on how much resistance an ice sheet encounters at its interface with the ground (e.g., whether it is frozen to its substrate) and on its effective viscosity, a measure of how strongly it resists deformation. The viscosity of ice, in turn, varies based on properties including temperature, crystal size and orientation, and impurity content.
Some properties within and beneath ice sheets that affect how they flow are anisotropic, meaning they vary by direction. For example, roughness in some directions at the ice bed can facilitate ice sliding more effectively than roughness in other directions, similar to the way a properly oriented corrugated metal roof allows snow to slide off. Several forms of anisotropy within ice also affect how ice flows from land to ocean (Figure 1).
Fig. 1. Anisotropy in glaciers and ice sheets has various sources, including from ice fabric and other properties within the ice (englacial) or at the ice-bed interface. Many forms of anisotropy in glacial ice can be measured with radar. Credit: Adapted from Hills et al., 2025, https://doi.org/10.1029/2024RG000842, CC BY 4.0
Measuring anisotropic properties is key to better understanding how quickly changes at the edges of the Greenland and Antarctic ice sheets will lead to sea level rise. Recent advances in ice-penetrating radar technology and in processing radar data are revolutionizing how we observe directionally varying ice sheet properties, paving the way for projections of mass changes that account for previously neglected processes.
Crystal Fabric: Memory and Modulator of Ice Flow
Fabric, the orientation of crystals composing ice, is the best studied and arguably most important of anisotropic ice sheet properties. As ice deforms, for example, by stretching horizontally as it flows toward the coast, its millimeter-scale crystals are reoriented (Figure 1).
Fabric thus contains a memory of past flow. Simultaneously, fabric influences flow because ice crystals are about 3 orders of magnitude easier to shear in some directions than others—similar to how stacked playing cards slide easily against each other when held along their edges but resist motion when pinched top to bottom.
Over the past 20 years, radar polarimetry has matured into a quicker and easier alternative means for inferring fabric.
The potential importance of fabric on large-scale ice flow has long been recognized, but a shortage of observations has made it difficult to quantify and validate its effect in ice sheet models. Until recently, fabric could be measured only directly in ice cores or inferred through seismic soundings. These methods provide highly detailed information about how fabric develops but are expensive, logistically taxing, and provide information only about sparse point locations.
Over the past 20 years, though, radar polarimetry has matured into a quicker and easier alternative means for inferring fabric, enabling observations at the scale of entire glaciers and providing new constraints on how fabric influences ice sheet flow.
How Radar Reveals Fabric
Ice-penetrating radar instruments emit electromagnetic energy as radio frequency waves. These waves reflect off interfaces within and beneath glacial ice, including transitions in ice chemistry and the contact surface between the ice sheet and the ground or water below. The properties of the reflected waves are then measured when they return to the radar. Just as fabric leads to anisotropic ice deformation, it also introduces directional dependence in the measured electrical properties.
The speed of a radar wave through an ice crystal is approximately 1% faster if the wave is polarized across the crystal’s principal (c) axis rather than aligned with it. Though small, this difference can compound enough that it causes measurable changes in returned radar signals.
In a typical radar survey over anisotropic ice, waves with different polarizations travel at slightly different speeds (Figure 2). The times that return signals arrive back at the receiver thus vary directionally, a difference that can be identified using polarimetric radars that transmit and receive radio waves at multiple orientations.
Fig. 2. Propagation of polarized radio waves through anisotropic ice reveals structural variations with depth because waves aligned across the prevailing ice fabric (represented by the ball, in which darker shading indicates a greater concentration of c axes) travel faster than waves aligned with the fabric. The phase delay increases as the effect of the anisotropy accumulates with depth. Credit: Adapted from Hills et al., 2025, https://doi.org/10.1029/2024RG000842, CC BY 4.0
Fabric’s effect on radar signal travel times accumulates through an ice column, so it is more prominent in thicker ice with stronger horizontal fabric (i.e., the ice crystals are more consistently aligned). In such cases, differences in travel times between polarizations can be measured even by standard radars.
When fabric is weaker or ice is thinner, the offset is smaller and detectable only by systems that can identify the phases of radar returns—that is, the exact positions of the returned waves in their oscillation cycle. Even small wave speed differences from weak fabrics accumulate into measurable phase shifts between polarizations, which can be used to determine the consistency of crystal alignment and the predominant crystal orientation.
Small differences in fabric through an ice column can also change the strength, or amplitude, of returned signals. This amplitude difference offers an independent way to identify fabric orientation and its depth variation.
Polarimetric radar has been widely applied in cryospheric science in recent years largely due to the advent of low-cost systems that can measure signal phases. For example, the popular Autonomous phase-sensitive Radio Echo Sounder (ApRES) is a lightweight, ground-based system that can be used to infer ice fabric at single points down to 2 kilometers deep. In the past decade, polarimetric ApRES systems have revealed ice flow histories, including changes in flow directions, of key glaciers over the past few millennia. These measurements offer windows into how ice sheets responded to previous climate variations.
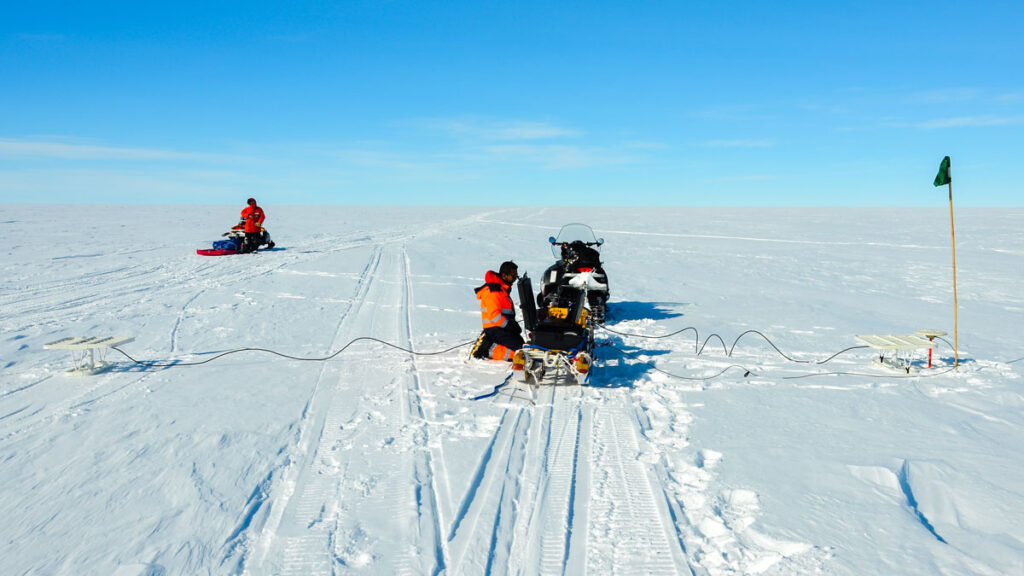
A mobile, quad-polarimetric radar is dragged by snowmobile over the surface of Müller Ice Cap on Axel Heiberg Island in Nunavut, Canada, in May 2023. Credit: David Lilien
The next generation of polarimetric radars go beyond one-point-at-a-time stationary soundings, offering full polarimetry capabilities on moving platforms. These systems may soon allow scientists to map directional ice properties at the scale of entire ice sheets.
Insights into Fast-Flowing Ice Fabric
The growing number of radar studies conducted near sites where ice cores have been collected, which allow fabric to be investigated up close, has provided validation and bolstered confidence that fabric can be inferred accurately from its effects on radar. Researchers now infer fabric from radar in more dynamic areas, such as Thwaites Glacier, Whillans Ice Stream, and the Northeast Greenland Ice Stream (NEGIS), where ice fabrics change over short spatial scales and where drilling ice cores is logistically difficult. Airborne radar surveys are particularly effective in these settings because they can efficiently map fabric variations across large, fast-moving areas.
Observations of strong fabrics in fast-flowing regions suggest that fabric is an important control on ice viscosity, although its implications for ice flow are just beginning to be explored. For example, at Rutford Ice Stream in Antarctica, ApRES data indicate that fabric causes sharp changes in viscosity in different directions with depth, a complexity not captured by current ice flow models.
A combination of airborne and ground-based radar shows that the fabric of the NEGIS varies substantially across the ice stream, which facilitates horizontal shear that allows faster and more cohesive flow in the middle of the ice stream while simultaneously stiffening this ice against along-flow stretching. These viscosity variations may alter how quickly coastal changes, such as increased melt due to climate warming, influence inland ice flow.
Scientists have studied ice sheet mass balance at glacier-mounted stations along the renowned “K-transect” near Kangerlussuaq in southwestern Greenland since the early 1990s. This image shows a view up the transect in April 2025. Polarimetric radar offers another tool with which to study ice flow here and at other locations on the ice sheets. Credit: Tamara Gerber
The emerging consensus from radar observations and recent progress in fabric modeling is that ice fabric can soften ice stream shear margins by a factor of 10. In other words, the fabric tends to develop in a way that greatly reduces the ice’s effective viscosity at lateral boundaries between fast-flowing and slower-flowing ice, which enables the ice to deform more easily at the margins. The agreement between observations and process-scale modeling highlights fabric as a major, but largely ignored, control on ice flow that may affect estimates of how ice dynamics will contribute to future sea level rise.
Beyond Fabric
Most polarimetric radar studies so far have focused on fabric, but other ice characteristics can cause directional effects too. For instance, bubbles trapped in ice have dramatically different properties than ice itself. Ice deformation can bring bubbles into alignment, such that they affect radar waves differently in different directions.
Likewise, ice at its melting point can contain liquid water along boundaries between crystals, and if those pockets of water are aligned in one direction, they can also affect radar returns. Each of these properties has important influences on ice flow, but their implications are yet to be explored.
Another source of anisotropy is the bottom boundary of the ice sheet. This interface can be rougher in some directions than others, though the roughness is typically aligned with the prevailing ice flow direction or the direction of meltwater trapped within the ice.
Polarimetric radar can measure directionally dependent properties of ice sheet bases at a finer scale than radar profiling can. Such work is leading to new insights into glacier geomorphology, interactions of ice shelf bottoms with the underlying ocean, and how ice slides over substrate surfaces. Rates and extents of sub-ice-shelf melt and basal sliding are widely recognized as key controls on the future of the ice sheets.
Expanding Horizons: Large-Scale and Planetary Applications
Radar polarimetry has already transformed our understanding of ice fabric, revealing much about how crystal alignment modulates the flow of Earth’s ice sheets and filling critical gaps between the handful of direct measurements from ice cores. As polarimetric techniques mature, their applications are expanding.
Researchers are moving from studying isolated profiles of ice fabric to mapping it across whole basins, a key shift for validating bespoke models of fabric and its effects on flow. These models are also rapidly developing to include additional physical processes (e.g., migration recrystallization) and key simplifications (e.g., reducing directionally varying viscosity to a single number) that allow them to interface more easily with—and be incorporated into—large-scale models used for projecting sea level rise.
Techniques pioneered for measuring ice on Earth may also prove useful elsewhere in the solar system.
Techniques pioneered for measuring ice on Earth may also prove useful elsewhere in the solar system. Orbital radar sounders have already probed Mars’s ice masses, and the icy shell of Jupiter’s moon Europa will soon be surveyed by single-polarization radars aboard NASA’s Europa Clipper and the European Space Agency’s Jupiter Icy Moons Explorer (JUICE). These radars might be useful for polarimetry at some locations on Europa, which could reveal past and present motion of ice features and answer fundamental questions about the moon. Whether Europa’s shell flows, for example, may be key to whether its subsurface ocean can harbor life.
As polarimetric radar systems become routine tools for glaciologists and as similar instruments begin operating on spacecraft exploring icy worlds, a technique once limited to a few isolated core sites on Earth could be poised to transform our understanding of ice across the solar system.
Author Information
David Lilien (dlilien@iu.edu), Indiana University Bloomington; T. J. Young, University of St Andrews, Fife, Scotland; Benjamin Hills, Colorado School of Mines, Golden; Tamara Gerber, Université de Lausanne, Lausanne, Switzerland; and Matthew Siegfried, Colorado School of Mines, Golden
Citation: Lilien, D., T. J. Young, B. Hills, T. Gerber, and M. Siegfried (2026), New directions in mapping ice sheet fabrics and flow, Eos, 107, https://doi.org/10.1029/2026EO260154. Published on 14 May 2026.
Source: AGU Advances
This is an authorized translation of an Eos article. 本文是Eos文章的授权翻译。
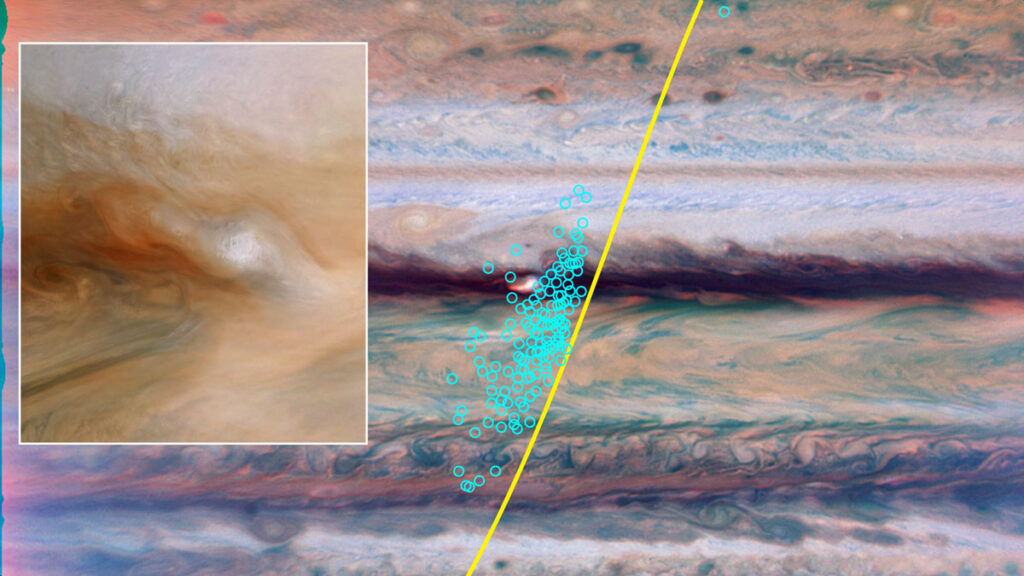
木星的闪电一直是行星科学家关注的焦点,因为它标志着风暴活跃的区域,研究人员可以在这些区域深入研究以进一步了解木星大气中的对流现象。
远距离观测闪电并非易事,因此科学家们将研究重点放在最容易观测的闪电上:夜间发生的强闪电。因此,一些研究得出结论,木星上的闪电都与地球上最强的闪电——“超级闪电”——类似。然而,这一结论最近受到了质疑,因为NASA朱诺号探测器上的高灵敏度星体追踪相机探测到了微弱的浅层闪电。
Wong等人进行了更深入的研究,重点观察了2021年和2022年木星北赤道带的闪电高度集中在一些强大的孤立风暴中的情形,研究人员将这些风暴称为“隐形超级风暴”。这种不寻常的气象条件使研究人员能够更精确地确定闪电的位置。
科学家们并没有仅仅关注可见光,而是利用了朱诺号探测器携带的微波辐射计和Waves实验的数据。朱诺号在过去十年中一直在环绕木星运行。无线电波只是闪电产生的电磁辐射的一