The average American household uses about 150 pounds of glass containers each year, but more than two-thirds of that glass never gets recycled into new bottles. This isn’t because people aren’t trying. Glass is now the only common packaging material that costs recycling facilities more to process than they make from selling it, and the U.S. recycling system has been adapting to this problem for the past twenty years.
According to the EPA, the U.S. has recycled about 31 percent of its glass conta
The average American household uses about 150 pounds of glass containers each year, but more than two-thirds of that glass never gets recycled into new bottles. This isn’t because people aren’t trying. Glass is now the only common packaging material that costs recycling facilities more to process than they make from selling it, and the U.S. recycling system has been adapting to this problem for the past twenty years.
According to the EPA, the U.S. has recycled about 31 percent of its glass containers for the past ten years. In contrast, the European Union collected 80.8 percent of its glass containers in 2023. This gap isn’t because of how people act, but because of differences in infrastructure, policies, and the fact that glass is heavy, breakable, and not very profitable. As a result, glass no longer fits well in the single-stream recycling system most Americans use.
The math that broke glass recycling
Cullet, which is the industry term for crushed and sorted recycled glass, is a permanent material. It can be melted and reused over and over without losing quality. Adding 10 percent more cullet to a furnace reduces energy use by 2.5 to 3 percent and lowers CO₂ emissions by about 5 percent. If a furnace uses only cullet, it produces about 58 percent fewer emissions than making glass from raw materials like sand, soda ash, and limestone.
These numbers show that glass should be valuable to bottle makers. However, manufacturers want cullet that is color-sorted, clean, and ready for the furnace, which is rarely what comes out of single-stream recycling facilities.
A 2017 analysis by the Closed Loop Foundation found that single-stream glass costs U.S. recycling facilities $150 million each year in equipment damage, transportation, and disposal. On average, a facility loses about $35 for every ton of glass it handles. For example, a transfer station in Washington, D.C. spends about tens of thousands of dollars a year replacing screen baskets damaged by glass shards. When trucks unload, glass shards also get stuck in paper and cardboard, making those materials less valuable.
This is known as the negative-value problem. The glass itself isn’t worthless, because high-quality cullet can be sold. But the way glass is collected usually produces a dirty, color-mixed load, so it often ends up being used as road base, landfill cover when ground into sand-like consistency and laid over the day’s waste, or just thrown away.
How we built a system that loses money
The current U.S. glass recycling shortfall is largely the story of two infrastructure decisions made decades apart.
The first decision was moving to single-stream collection in the 1990s and 2000s. This change increased overall recycling rates but mixed glass with other materials. As a result, glass often arrived at recycling facilities already broken, contaminating other recyclables and damaging equipment designed for paper and plastic.
The second decision was to close glass-only drop-off programs as city budgets tightened. Without dedicated collection routes, like the ones used in Italy, Belgium, and Germany to recycle 90 percent of glass containers, American glass no longer had a clean way to be collected.
The exception is the 10 states with container deposit laws. These states, known for their bottle bills, recycle about 70 percent of beverage containers, which is more than twice the national average of 33 percent. Oregon’s deposit system achieved an 87 percent redemption rate in 2024, the highest in the country. Glass returned through deposit programs is typically clean, sorted, and unbroken — exactly what manufacturers want.
What does glass costs your household?
Consumers end up paying for glass twice. First, the cost of the bottle is included in the price of products like wine, beer, sauce, or seltzer. Second, people pay municipal recycling fees through property taxes, garbage bills, or both. These fees cover the average $ 62-per-ton landfill tipping fee in 2024, plus the extra cost of glass contamination that affects other recyclables.
The exact dollar figure varies wildly by region. New York City’s Department of Sanitation has estimated curbside recycling collection at $686 per ton, a number that includes labor, fuel, and equipment that reaches beyond what households see on their utility bills, but shows up in tax rates.
In states with bottle bills, the economics are different for households. A 5- or 10-cent deposit can be fully recovered, and if the home doesn’t recycle, others can generate income picking it up.
Glass that would have cost the city money instead becomes a small refund for the household and a clean material for manufacturers. This system covers the cost directly through fees for using glass, rather than spreading it across all taxpayers.
Glass emissions matter
Glass furnaces use a lot of energy compared to other packaging processes. Making 1 ton of container glass produces between 0.5 and 1.6 tons of CO₂, depending on the furnace’s efficiency and the amount of cullet used. Each ton of cullet used instead of raw materials saves about 0.67 tons of CO₂ and 1.2 tons of mined sand, soda ash, and limestone. soda ash, and limestone.
If you apply these numbers to the 6 million tons of glass containers that were landfilled in the U.S. in 2018—the most recent year for which the EPA provides data—the country misses out on about 4 million tons of avoided CO₂ emissions each year, plus more than 7 million tons of raw materials that could have been saved. This is a climate cost that the recycling rate alone cannot capture.
The Glass Packaging Institute and Boston Consulting Group have created a plan to raise the U.S. glass recycling rate to 50 percent by 2030. It focuses on expanding deposit programs, building dedicated glass processing facilities, and moving away from single-stream collection where possible. Reaching this goal would nearly double the current recycling rate without requiring people to change what they drink or how often they recycle.
What’s changing, and what isn’t
Seven states, including California, Colorado, Maine, Maryland, Minnesota, Oregon, and Washington, have passed extended producer responsibility (EPR) laws for packaging. These laws shift the cost of recycling from cities to the companies that sell the bottles. Oregon started enforcing its program in July 2025, and Colorado, Minnesota, and Maryland will phase in their programs by 2028.
EPR is the policy most likely to change the economics of glass recycling in the next decade. When producers pay recycling costs directly, they have to deal with contamination from single-stream recycling, not the recycling facility. This makes dedicated glass collection much more appealing. The European experience shows that this approach works, but it has not yet been tried on a large scale in the U.S.
What you can do
Check if your state has a bottle bill. If it does, redeem your deposit for a clean recycling stream and a small refund. If not, look up your local recycling options using the Earth911 recycling search before putting glass in your curbside bin.
If your area has glass-only drop-off sites, use them. Many cities offer free drop-off locations at transfer stations or grocery store parking lots. The glass collected from these sites is the type manufacturers prefer.
Rinse your bottles instead of crushing them. Whole bottles are easier to sort than broken pieces. Take off metal lids and recycle them separately.
Buy refillable bottles when possible. A refilled bottle does not use any cullet, raw materials, or the recycling system. Programs for returnable beer, milk, and water bottles are slowly becoming more common in the U.S.
Support extended producer responsibility and bottle-bill laws in your state. Most glass that gets recycled in the U.S. today comes from the 10 states with deposit programs. Expanding these programs is the most effective policy change available.
About two tons of satellite material burns up in Earth’s atmosphere every day. That is the steady-state exhaust of a single company’s broadband network, SpaceX’s Starlink, operating at its current scale. Each vaporized spacecraft leaves behind aluminum oxide, lithium, copper, and a growing list of metals the upper atmosphere has never had to contained in these quantities before.
We’re following a familiar human pattern. A commons, like the low earth orbit (LEO) region of space, is declared abund
About two tons of satellite material burns up in Earth’s atmosphere every day. That is the steady-state exhaust of a single company’s broadband network, SpaceX’s Starlink, operating at its current scale. Each vaporized spacecraft leaves behind aluminum oxide, lithium, copper, and a growing list of metals the upper atmosphere has never had to contained in these quantities before.
We’re following a familiar human pattern. A commons, like the low earth orbit (LEO) region of space, is declared abundant. Commercial activity scales faster than science can measure the consequences. Governance lags by a decade or more. By the time the damage is legible, it is already expensive to reverse.
We did this to rivers in the 19th century, to the atmosphere in the 20th, and to the deep ocean in a quiet accumulation that stretched across both. A new peer-reviewed analysis published in Advances in Space Research makes clear that LEO is now on the same trajectory, and the chemistry is moving faster than the regulation.
An Atmosphere Already Dominated by Human Metal
The paper, an update to a 2021 study, reassesses how much spacecraft material is now being injected into the mesosphere and lower thermosphere as satellites and rocket stages burn up on reentry. The comparison it draws is that for several metals commonly used in spacecraft, anthropogenic injection now rivals or exceeds the natural input from meteoroids.
What was already true in 2021 is more true now. The researchers incorporate direct observations from stratospheric aerosol sampling — work led by Daniel Murphy at NOAA and published in PNAS in 2023 — which confirmed that roughly 10 percent of stratospheric aerosol particles now contain aluminum and other metals traceable to satellite and rocket-stage burn-up. For decades, the natural baseline was micrometeoroid ablation, what space sent naturally toward our planet. Earth sweeps up roughly 30 to 50 metric tons of cosmic dust every day, a steady rain of mostly sand-grain-sized particles left over from comets and asteroids. Those grains hit the upper atmosphere at speeds between 11 and 72 kilometers per second, vaporize in a thin layer between about 75 and 110 kilometers altitude, and seed the mesosphere with iron, magnesium, silicon, sodium, and trace amounts of nickel, calcium, and aluminum. This process has been running for the entire 4.5-billion-year history of the planet. The metal layers it produces in the upper atmosphere are well-mapped; they are the chemistry the stratosphere evolved with.
Aluminum is a useful tracer because it is a small share of the natural input. Cosmic dust is dominated by silicates and iron, with aluminum running on the order of one to two percent by mass. So when researchers began detecting elevated aluminum in stratospheric aerosol particles in the early 2020s, the signal was unambiguous — meteoritic infall could not account for it. The source had to be terrestrial in origin, vaporized at altitude. Spacecraft, in other words.
Human vehicles have become a second, larger source.
The near-term trajectory is worse. Researchers at the University of Southern California documented an eightfold increase in stratospheric aluminum oxide between 2016 and 2022, corresponding almost exactly to the ramp-up of Starlink and other satellite megaconstellations. In 2022 alone, reentering satellites released an estimated 17 metric tons of aluminum oxide nanoparticles — raising total atmospheric aluminum input about 29.5 percent above natural levels.
The Ocean Parallel
Consider the deep ocean in the 1960s. Dumping was legal, monitoring was barely funded, and the prevailing assumption was that the ocean was big enough to absorb anything. We now know the answer to that assumption after finding microplastics in Mariana Trench amphipods, pharmaceutical residues in Arctic sediment cores, and PFAS in polar bear blood.
Low Earth orbit is in the 1960s-ocean phase. The prevailing assumption among launch operators is that satellites that burn up are satellites that disappear. Michael Byers, Canada Research Chair in global politics and international law, put this directly in a 2024 interview with Scientific American: “There’s this widespread assumption that something burning up in the atmosphere disappears, but, of course, mass never disappears.”
What it does instead is change form. A 250-kilogram satellite, typically about 30 percent aluminum by mass, generates roughly 30 kilograms of aluminum oxide nanoparticles as it ablates through the mesosphere. Those particles are small enough — 1 to 100 nanometers — that they can drift in the stratosphere for decades before settling. Aluminum oxide is not inert. It catalyzes the chlorine reactions that destroy stratospheric ozone, the same chemistry the Montreal Protocol was designed to stop. Crucially, the particles are not consumed in those reactions; they continue to destroy ozone molecules for the duration of their atmospheric lifetime.
The Scale Is Not Hypothetical
As of April 2026, SpaceX alone operates more than 10,000 active Starlink satellites, roughly two-thirds of all functioning spacecraft in orbit. The company has launched over 11,700 total, with about 1,500 already deorbited and replaced. Starlink satellites are designed for a five-year operational life, which means the constellation is, by design, a continuous churn: launch, operate, burn, launch again.
Amazon’s Project Kuiper, Eutelsat’s OneWeb, and a growing roster of Chinese state-backed constellations are moving toward similar architectures. The European Space Agency now tracks roughly 40,000 objects in low Earth orbit, about 11,000 of them active payloads, the rest debris or derelict hardware. Statistical models from ESA estimate another 130 million fragments smaller than one centimeter, each traveling fast enough to destroy whatever it hits.
Research published in Geophysical Research Letters projects that once currently planned megaconstellations are fully deployed, roughly 912 metric tons of aluminum will reenter the atmosphere every year, producing around 360 tons of aluminum oxide annually. A separate NOAA modeling study published in 2025 found that sustained alumina injection at expected 2040 levels could alter polar vortex speeds, warm parts of the mesosphere by as much as 1.5°C, and measurably impact the ozone layer.
Two Kinds of Pollution, One Commons
The orbital damage is happening on two fronts simultaneously, and they reinforce each other.
Atmospheric injection is the slow-accumulating chemistry problem. Every satellite that completes its mission becomes tomorrow’s stratospheric dust. A newly upgraded lidar system at the Leibniz Institute of Atmospheric Physics in Germany can now simultaneously detect lithium, sodium, copper, titanium, silicon, gold, silver, and lead in the upper atmosphere — each element a chemical fingerprint for specific spacecraft components. On February 20, 2025, the instrument registered a sudden spike in lithium vapor that researchers traced to a Falcon 9 upper stage reentering overhead.
The measurement capability is arriving just as the pollution is scaling.
Orbital debris is the faster-moving physical problem. SpaceX reported that its Starlink satellites executed 144,404 collision-avoidance maneuvers in the first half of 2025, due to collision warnings every couple of minutes, for six months straight — three times the previous rate. Two Starlink satellites have fragmented in orbit in the past four months, each creating a trackable debris field. Space is getting filled with junk that led to the International Space Station performing avoidance maneuvers twice in a single six-day window in November 2024, and again in April 2025.
Darren McKnight, a senior technical fellow at the debris-tracking firm LeoLabs, told IEEE Spectrum that certain orbital altitudes at 775, 840, and 975 kilometers have already passed the debris-density threshold where collisions generate fragments faster than atmospheric drag can remove them. This is known as the Kessler syndrome, proposed by NASA scientists Donald Kessler and Burton Cour-Palais in 1978, and it is no longer hypothetical in every band.
“Some operators in low Earth orbit are ignoring known long-term effects of behavior for short-term gain,” McKnight said, “Some will not change behavior until something bad happens.”
The Governance Gap
There is no body that regulates the cumulative atmospheric impact of satellite reentries. No operator is required to submit an environmental impact assessment for a constellation’s aggregate burn-up.
The FCC licenses spectrum.
National launch authorities license liftoff.
Debris mitigation guidelines from the UN’s Committee on the Peaceful Uses of Outer Space are voluntary, and compliance is inconsistent. The chemistry of the upper atmosphere is, in regulatory terms, nobody’s jurisdiction.
The United Nations Environment Program took a first step in late 2025, releasing a report titled Safeguarding Space: Environmental Issues, Risks and Responsibilities. It framed space debris and atmospheric injection as “emerging issues” deserving the attention international bodies already give to ocean pollution and transboundary air quality. This is the same framing UNEP used for atmospheric ozone depletion in the 1970s before the Montreal Protocol. Measuring something does not fix it. But it is the necessary precondition for fixing it — and for the first time, the measurement infrastructure is catching up to the pollution.
The Counter-Case, Honestly
Not every specialist agrees the situation is as urgent as the headlines suggest. A skeptical review published in March 2026 argued that the Kessler cascade framing oversimplifies a risk that plays out on timescales of decades to centuries, and in specific orbital bands rather than across all of LEO. The review is right on one narrow point: the ISS has operated continuously at 400 kilometers since 2000, its debris risk is managed in real time, and the environment is not in a runaway state.
What the skeptical case does not resolve is the atmospheric chemistry. The Kessler debate is about whether low-earth orbit becomes unusable. The alumina question is about whether the recovery of the ozone layer — a genuine success story of international environmental governance — is quietly being undone from above. Those are different problems. The first might take a century. The second is already measurable and is projected to worsen within fifteen years.
On August 26, 2009, an Australian biologist’s audio detector picked up a single bat working its way through the rainforest canopy on Christmas Island. The recording captured the last echolocation call of the Christmas Island pipistrelle. After that night, no detector ever heard another.
This is the strange feature of extinction in the 21st century: a lot of it happens on the record. We have audio of a bat’s last call. We have photographs of the last individual. We know the names of endangered in
On August 26, 2009, an Australian biologist’s audio detector picked up a single bat working its way through the rainforest canopy on Christmas Island. The recording captured the last echolocation call of the Christmas Island pipistrelle. After that night, no detector ever heard another.
This is the strange feature of extinction in the 21st century: a lot of it happens on the record. We have audio of a bat’s last call. We have photographs of the last individual. We know the names of endangered individuals — Lonesome George, Sudan, Toughie — and in many cases, we knew years in advance that we were going to lose them.
Since 2000, the International Union for Conservation of Nature (IUCN) has formally moved dozens of species into its Extinct or Extinct in the Wild categories, and hundreds more sit one rung above, in Critically Endangered (Possibly Extinct). The species described below are not the longest list. They are the clearest cases of losses that played out as they were documented, with causes nobody had to guess at.
The question is whether humans will learn from past losses to prevent future ones.
The pipistrelle that nobody caught in time
The Christmas Island pipistrelle was a microbat the size of a thumb. Its population had been collapsing for two decades when, in 2006, scientists estimated only a few dozen remained. The Australian government authorized a captive-breeding rescue in mid-2009. By the time crews reached the island, only one bat could be found. Four weeks of trapping failed to catch it. The IUCN declared the species extinct in 2017.
The cause was not climate change or habitat loss in the usual sense. It was a cascade of invasive species, including yellow crazy ants, feral cats, and an introduced wolf snake, combined with a slow government response. The pipistrelle is the kind of extinction that makes the policy lesson uncomfortably clear, showing that the science was correct and that a rescue plan existed, but that the action came roughly two years too late.
Lonesome George and the end of a lineage
On June 24, 2012, Lonesome George died on Santa Cruz Island in the Galápagos. He was the last known Pinta Island tortoise (Chelonoidis abingdonii), a subspecies hunted to functional extinction by 19th-century whalers who used them as food, then finished off by goats introduced on the island. Decades of mating attempts with related subspecies failed to produce viable offspring.
George’s death loss was foreseeable for forty years before it happened. Conservationists found him in 1971 and immediately understood what he was: a subspecies of one. Yet, every year of his life was a year the question “what would it take to save this lineage?” had a clear answer (nothing, in the end) and a public audience. He is one of the most-watched extinctions in history.
The northern white rhinoceros is now traveling the same road in slow motion. Sudan, the last male, was euthanized on March 19, 2018, and only two females remain, both past breeding age. An IVF and stem-cell program, BioRescue, is attempting to revive the subspecies using stored gametes, the half of a species’ DNA contributed by the male and female parent. Whether that succeeds or not, the wild northern white rhino is gone.
The baiji: a dolphin lost in plain sight
The baiji, or Yangtze river dolphin, was an evolutionary outlier. Its lineage diverged from other cetaceans roughly 20 million years ago. After a six-week 2006 expedition failed to find a single individual along the entire Yangtze, scientists declared it functionally extinct. It was the first cetacean species lost to human activity.
The baiji was killed by an combination of human factors. It was frequently gillnet bycatch, caught up when fishermen netted other species. Its range was constrained by dam construction. Ship strikes and pollution from the industrial corridor running through the most densely populated river basin on Earth killed many.
No single act caused the extinction. That is part of why nothing stopped it. The Yangtze finless porpoise, the only remaining freshwater cetacean in China, now faces the same pressures.
The Bramble Cay melomys: the first mammal climate extinction
The Bramble Cay melomys was a small rodent that lived on a single five-acre coral cay at the northern tip of the Great Barrier Reef. As sea levels rose and storm surges intensified, the cay’s vegetated area collapsed, taking the melomys’ food supply and burrows with it. The species was last seen in 2009, declared extinct by the IUCN in 2015, and by the Australian government in February 2019, the first mammal extinction explicitly attributed to anthropogenic climate change.
The melomys had nowhere else to go. That is the feature low-elevation island endemics share, and it is a feature thousands of species share with them.
The po’ouli: an extinction due to an absent partner
The po’ouli was a Hawaiian bird discovered in 1973, the first new honeycreeper species described in 50 years. By 2003, only three individuals could be located. In September 2004, biologists captured the last known male and brought him to the Maui Bird Conservation Center, hoping to find him a mate. None could be found before he died on November 26, 2004.
Hawaii has lost more bird species than any other U.S. state, primarily to avian malaria carried by introduced mosquitoes. As global warming pushes mosquitoes to higher elevations, the remaining honeycreepers are running out of altitude they can flee to.
Tissue samples from the last po’ouli are stored at the San Diego Zoo’s Frozen Zoo. Whether they can be restored through cloning is a 22nd-century question.
Beyond species, lost knowledge and connections
It is tempting to count extinctions as a tally as more species are discovered: species in, species out. That undercounts what is gone, even as science finds new species, many of which are also at risk. Each of these losses is also the loss of:
Evolutionary time. The baiji represented 20 million years of independent evolution. That information is not retrievable.
Ecosystem function. The melomys was a seed disperser; the pipistrelle ate insects that no other Christmas Island species had eaten; the rhino moved nutrients across savanna landscapes.
Cultural meaning. Lonesome George became a global symbol; the po’ouli had a Hawaiian name before it had a scientific one. Extinction erases human relationships with nature, not just specimens.
Possibility space. We do not know what the baiji’s hearing system, the rhino’s microbial gut community, or the melomys’s heat tolerance might have taught medicine, materials science, or conservation.
Extinctions share patterns
Six of the seven species above had clearly identified causes years before they disappeared. The interventions that might have saved them, such as captive breeding, habitat protection, anti-poaching enforcement, gillnet bans, and mosquito suppression, were known. In each case, the intervention either started too late, was funded at a fraction of what would have been required, or ran into political and economic interests that outweighed the species’ remaining time.
This is the harder lesson of the post-2000 extinctions. We are not, on the whole, losing species we did not know about. We are losing species we documented, named, photographed, and in some cases captured on audio in their final hours. The bottleneck is not knowledge.
The vaquita, a porpoise native to Mexico’s Upper Gulf of California, is a live test of what we have learned. The 2025 monitoring effort confirmed 7 to 10 surviving individuals, including new calves — slightly above 2024’s record-low count of eight vaquita.
The decline is due to their becoming bycatch in illegal totoaba gillnets. Whether the vaquita follows the baiji is, at this point, a question about fishing practices enforcement and political will, not science.
What you can do
Individual action alone does not stop extinction. But the drivers behind the species above are not unreachable. The most useful interventions are policy- and supply-chain-level, and they require the kind of sustained constituency that individual choices feed:
Support habitat protection at scale. Donate to or volunteer with organizations that buy, defend, or restore habitat: The Nature Conservancy, Rainforest Trust, American Bird Conservancy, and regional land trusts. Habitat preservation is the highest-leverage intervention against extinction.
Push for stronger enforcement of wildlife trade law. Contact your congressional and state representatives in support of full funding for the U.S. Fish and Wildlife Service’s Office of Law Enforcement and the Convention on International Trade in Endangered Species (CITES). The western black rhino was lost to an openly operating market across borders.
Cut your climate footprint where it actually moves the needle. For most U.S. households, that is home heating fuel, vehicle miles, and air travel, in roughly that order.
Buy seafood from sources that audit gear, not just species. Bycatch, which resulted in the loss of the baiji and threatens to be the vaquita’s killer, is a gear problem. The Monterey Bay Aquarium’s Seafood Watch rates fisheries on bycatch as well as stock health.
Vote on conservation budgets at every level. Most of the species rescues that worked in the past 25 years — the California condor, the black-footed ferret, the island fox — were funded through the Endangered Species Act and matching state programs. The species rescues that failed were generally underfunded earlier in the curve.
Editor’s Note: The next installment of Environmental Losses looks at the ecosystems that have collapsed or substantially restructured since 2000 — coral reefs, kelp forests, and freshwater systems — and what their loss takes with it.
On March 20, 2026, the Environmental Protection Agency proposed a rule change that could fundamentally shift how the federal government regulates a controversial type of plastic recycling called pyrolysis, also known as “advanced recycling.” Currently, the EPA treats pyrolysis plants as incinerators, restricting the release of toxic chemicals. The proposed rule would redefine them as factories, altering longstanding pollution controls.
Though it may seem minor, this rule change would weaken key
On March 20, 2026, the Environmental Protection Agency proposed a rule change that could fundamentally shift how the federal government regulates a controversial type of plastic recycling called pyrolysis, also known as “advanced recycling.” Currently, the EPA treats pyrolysis plants as incinerators, restricting the release of toxic chemicals. The proposed rule would redefine them as factories, altering longstanding pollution controls.
Though it may seem minor, this rule change would weaken key pollution protections for pyrolysis plants. The result could be increased toxic emissions, with the burden falling on nearby communities—often low-income or predominantly Black, Latino, or Indigenous neighborhoods.
What is pyrolysis?
Pyrolysis involves heating plastic to very high temperatures in a container with little or no oxygen, preventing it from burning as it melts. The plastic breaks down into an oily liquid that can be used to make fuel, or it can be mixed back into the process that creates new plastic. The plastics industry calls this “advanced recycling” or “chemical recycling.” Environmental groups, such as the Ocean Conservancy, have called the process “the latest plastics industry deception.”
There are six pyrolysis plants running in the United States today, in Ohio, Texas, North Carolina, Indiana, and Georgia. More are being built in Arizona and West Virginia. The industry wants to build many more, but says strict EPA rules make it hard to get permits.
Why the rule change matters
The Clean Air Act is the federal law that limits air pollution. One part of it — Section 129 — sets strict rules for incinerators. It requires them to limit nine kinds of pollutants, including dioxins, heavy metals, and tiny particles that lodge deep in human lungs. Pyrolysis plants have been covered by these rules since 2005. The EPA’s new proposal would move them from Section 129 to Section 111, which covers fewer pollutants.
John Walke, a clean air expert at the Natural Resources Defense Council, told the Associated Press that the timing is the real problem. Removing the old rule would happen quickly. Writing a new one takes years. In between, he said, a plant could legally turn off its pollution controls.
“You could have a facility that was controlled on a Monday, preventing those hazardous air pollutants from being emitted into the atmosphere, and on Tuesday, the facility would have legal permission to turn off installed pollution controls,” Walke said. The reason a company would do that, he added, is simple: running pollution control equipment costs money.
James Pew of Earthjustice, a group that takes environmental cases to court, put it more bluntly to Inside Climate News: “As a practical matter, this definition change would mean EPA is completely deregulating a whole class of incinerators, these so-called pyrolysis units. And their pollution is really toxic.”
What the plastics industry says
The American Chemistry Council, which represents plastic companies, has lobbied for this change for years. Ross Eisenberg, who leads its plastics group, told the Associated Press that pyrolysis is not the same as burning. “The definition of incineration is to destroy it, right? You’re literally trying to make it go away,” he said. “That’s not what they’re doing here. They are trying to preserve it and recover the materials, which is recycling, which is manufacturing.”
Eisenberg argues that chemical recycling plants are already heavily regulated, citing other parts of the Clean Air Act that would still cover them, as well as requirements associated with state-level permits.
What scientists have actually found
The science on pyrolysis is at best mixed and can be partisan. A 2023 study by the Department of Energy’s Argonne National Laboratory, published in the Journal of Cleaner Production, found that mixing even a small amount of pyrolysis oil into new plastic production cuts greenhouse gas emissions by 18% to 23% compared to making plastic from scratch. The researchers used real operating data from eight U.S. pyrolysis facilities between 2017 and 2021.
But a 2025 paper in ACS Sustainable Chemistry & Engineering concludes that, depending on the size of the plant and how its emissions are measured, the same process can produce anywhere from 28% less to 30% more greenhouse gas emissions than ordinary fossil-fuel-based plastic production. The paper also notes that pyrolysis facilities release volatile organic compounds, fine particles, and a group of cancer-linked chemicals called polycyclic aromatic hydrocarbons. Those emissions, the authors wrote, fall hardest on communities that are mostly low-income or marginalized.
A 2023 report by Beyond Plastics found that of 11 chemical recycling plants then operating in the U.S., seven were sited in environmental justice communities. Six of those seven were pyrolysis plants.
Pyrolysis can reduce some forms of pollution while creating others, and the people who breathe those other emissions are usually not the ones making decisions about where plants are built.
How the public weighed in
The EPA gave the public 45 days to submit comments, from March 20 to May 4, 2026. Environmental groups organized quickly. A group including the Public Interest Research Group, Environment America, and Environmental Action collected and submitted more than 27,000 comments asking the agency to keep treating pyrolysis as incineration. The groups argue that pyrolysis can release up to 96 different toxic chemicals, including some linked to cancer and harm to developing children.
At a public hearing, a dozen speakers from Moms Clean Air Force testified against the change. Kiya Stanford, the group’s Georgia organizer, said the proposed rule “feels like a move to prioritize polluters over people.”
Judith Enck, a former EPA regional administrator who now runs Beyond Plastics, told Inside Climate News she was puzzled by how the change was announced. “I thought, could it be a mistake, or are they quietly trying to push this through?” she asked. The pyrolysis paragraph was buried inside a 17-page rule about wood waste burning.
Where to follow what happens next
The official record for this rule lives on the federal website regulations.gov, in docket EPA-HQ-OAR-2025-0068. Every public comment, every supporting document, and the EPA’s eventual decision will appear there.
The first comment window closed on May 4. The EPA can still accept late comments, but it doesn’t have to count them. The bigger opportunity for public input is still ahead: the EPA said the comments collected on this docket will help it draft a new, separate rule focused entirely on advanced recycling. That second rule has not yet been published. When it is, the public will get another comment period of at least 30 days, often 45 to 60.
What You Can Do
Follow the rules’ progress. Go to regulations.gov and search for EPA-HQ-OAR-2025-0068. You can subscribe to email alerts to receive updates when the EPA posts.
Be ready to comment on the next rule. When the EPA publishes its dedicated pyrolysis rule — likely later this year or next — you will have a chance to submit a public comment. Even a short, clear comment becomes part of the official record.
Find out if a plant is near you. Pyrolysis plants are operating or under construction in Ohio, Texas, North Carolina, Indiana, Georgia, Arizona, and West Virginia. If you live in one of those areas, state-level air quality rules will matter more than ever.
Ask brands what “recycled” really means. Some products labeled as containing recycled plastic don’t actually contain recycled molecules. They use a paper accounting system called mass balance. Asking companies to explain their labels is a fair question.
Use less plastic. The whole debate is about what to do with plastic after it exists. Choosing durable goods, refilling instead of replacing, and skipping single-use packaging keeps plastic out of the system entirely.
When the decision is likely
The current rule has two parts that move on different schedules. The disaster-recovery section involving wood waste is on a fast track. The EPA said it wants to finish that before the 2026 hurricane and wildfire season, which means a final decision is likely between late spring and early summer 2026.
The pyrolysis part will take until next year. The EPA has not announced a target date for its dedicated pyrolysis rule. Based on how quickly the agency is moving and what industry groups have told reporters, a reasonable guess is that a new proposed rule will appear in late 2026 or the first half of 2027, with a final version possibly in 2027 or 2028.
The National Resources Defense Council has announced plans to sue if the rule is finalized, a step that could delay implementation further. The EPA’s upcoming publication of its dedicated pyrolysis rule is the next key moment, as it will determine whether the government continues to uphold or dismantle existing pollution protections. This decision will shape the future of advanced plastic recycling in the U.S.
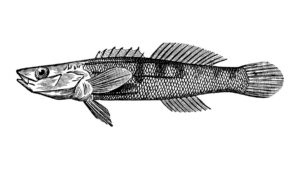
Three small, easily overlooked fish swimming in Valley Creek near Birmingham, Alabama, are: the Birmingham darter, the watercress darter, and the blackbanded darter. Each is about two inches long—olive-toned, banded, and built for life on the stream bottom, with large pectoral fins that let them perch among gravel and flow.
For years, they were thought to be variations of the same species. In April 2025, genomic analysis confirmed something more fragile and more important: the Birmingham darter
Three small, easily overlooked fish swimming in Valley Creek near Birmingham, Alabama, are: the Birmingham darter, the watercress darter, and the blackbanded darter. Each is about two inches long—olive-toned, banded, and built for life on the stream bottom, with large pectoral fins that let them perch among gravel and flow.
For years, they were thought to be variations of the same species. In April 2025, genomic analysis confirmed something more fragile and more important: the Birmingham darter is its own species, found nowhere else on Earth. Unlike its relatives, it does not occupy the main channel. It lives in small tributaries and headwater streams—the very places most vulnerable to drying, warming, and disturbance.
Only a handful of populations are currently known, confined to the upper Valley Creek watershed and a few adjacent tributaries—a drainage area of roughly 65 square miles. Recent surveys have extended the known range into Little Blue Creek, Nabors Branch, and Halls Creek, but at least one population is feared extirpated. It is extremely difficult to count, but all evidence suggests a species on the brink.
The Birmingham darter is not alone in its vulnerability. Endangered mussels in Valley Creek, like the upland combshell and triangular kidneyshell, depend on darters to reproduce. Their strategy is as remarkable as it is precarious.
They release mucus or fleshy lures into the current that mimics a small fish, complete with an eyespot. When a darter strikes, it gets a mouthful of microscopic larvae. These larvae clamp onto the fish’s gills—like tiny Pac-Men—where they remain attached as they develop. This relationship is obligate. Without the host fish, the larvae die within days. Without mussels, Valley Creek loses vital natural processes, water filtration, nutrient cycling, and ecosystem stability.
Valley Creek has already experienced this kind of loss. A mussel species once dependent on American eels disappeared when dams blocked eel migration. Without its host, it could not reproduce and becomes extinct.
Fish in Valley Creek, including darters and redeye bass, depend on cool, flowing water sustained by groundwater-fed baseflow, especially in late summer when rainfall is scarce.
The threat they face is more fundamental than any single pollutant or disturbance. The threat is hydrologic collapse. If groundwater recharge is reduced, if headwater streams dry, if flow becomes intermittent in August and September, the habitat disappears—not gradually, but functionally all at once. The problem is that even a resilient system, like Valley Creek, cannot survive without water.
At first glance, the risks are clear. Replacing forest with roofs, roads, and compacted ground reduces the land’s ability to absorb rain. Water that soaked into the soil and slowly fed the creek instead runs off quickly, intensifying floods in wet months and starving the creek in dry ones. The result is a more volatile system with higher peaks and lower lows.
Given the steep-sided topography of the Project Marvel site, flash flooding is not an occasional event; it is the norm. When it rains, water moves fast. Flow in Valley Creek can surge from roughly 70 cubic feet per second to over 400 cfs within hours, transforming the creek from a modest stream into a fast-moving, erosive force.
With more extreme weather events—more rain falling in shorter periods—these spikes are intensifying. More water arrives all at once, runs off more quickly, and leaves just as fast.
This is the paradox at the heart of Valley Creek: Too much water when it rains; not enough when it matters. The system is not short of water but short of storage, infiltration, and timing.
This could be the end for Valley Creek as we know it.
However, Project Marvel also introduces something the watershed has never had at this scale: control.
Data centers are not passive users of water. They are engineered systems—precise, monitored, and responsive. They require planning, storage, redundancy, and reliability. These same qualities, if directed outward, can be used not only to consume water but also to manage it.
Rather than constantly taking water from the creek, the solution is to take control and reshape when and how water is used.
Project Marvel can capture high flow during storms and store it in larger cisterns, underground vaults, or managed basins.
Make stormwater an asset, reduce peak flows, and retain water in the watershed for later use. Stormwater becomes an asset rather than a waste stream when peak flows are reduced, water is held in the watershed, and water supply is secure for later use.
The data center can rely on stored water during the hot, dry days of August and September, when the creek flow is 1 to 3 million gallons per day, and Project Marvel needs 2 million gallons per day. Leave the creek alone when the Birmingham darter is most at risk. No surface-water withdrawals during August and September. When the Birmingham darter is most at risk, let it be. Leave the creek undisturbed.
Water storage alone is not enough. The system must also restore what has been lost: the land’s ability to retain water. Bessemer has rezoned 1,600 acres along Valley Creek for a campus of 18 data center buildings. The site to be developed today supports oak-hickory-sweetgum forests and the loblolly pine and hardwood understory forests, including dogwoods, tupelo, holly, redbud, serviceberry, and witch hazel.
These forests intercept rainfall, build soil, and allow water to infiltrate and recharge groundwater. Their removal—and the compaction and grading that follows—eliminates that function.
Using approaches such as Miyawaki plantings, high species diversity and dense native forests can rapidly build soil to rejuvenate degraded industrial land, floodplain edges, and abandoned commercial sites. Over time, these forests increase water infiltration into the ground, build organic matter and humus, store more water in the ground, and release cool water slowly back into streams, especially during dry and hot periods.
With responsible, savvy control, Project Marvel becomes more than just a development. It engineers a water infrastructure for the watershed. Capturing excess water during flash flooding, storing it for dry periods, recharging groundwater through restored landscapes, and maintaining flow when it matters most, the data center becomes a marvel for the Valley Creek watershed.
This is more in keeping with what the Birmingham darter requires. Reliable, cool, flowing water in late summer is something more specific and achievable than pristine wilderness. If Project Marvel is designed with that goal in mind, it will be known as the project that learned how to keep Valley Creek flowing.
What Must Be Required
The survival of the Birmingham darter and the integrity of Valley Creek cannot depend on voluntary measures, best practices, or future promises. It must be secured through clear, enforceable standards embedded in permits, approvals, and long-term oversight.
If Project Marvel is to become a benefit rather than a liability, three things must be required: protect the creek when it is vulnerable, capture and manage water when it is abundant, and restore the land’s ability to hold water.
No surface-water withdrawals from Valley Creek during August and September, months when: streamflow is lowest, water temperature is highest, dissolved oxygen is most limited, and aquatic species are most stressed.
At this moment, even modest withdrawals can have outsized impacts. This standard must be written into permits, continuously monitored, and publicly reported. If flows fall below a defined ecological threshold, withdrawals should be restricted even outside these months.
Project Marvel must operate as a closed-loop system during dry periods, not a continuous user of streamflow. This requires stormwater capture systems sized for extreme rainfall events; cisterns or underground storage sufficient to supply August–September demand; and redundant storage capacity to ensure reliability.
A performance-based requirement could be requiring the facility to demonstrate the ability to meet all cooling water demand for at least 60 consecutive summer days without surface-water withdrawals. This shifts the burden from the creek to the project.
Traditional stormwater permits focus on peak flow reduction. That is not enough. What matters ecologically is the full flow regime—how water moves through the system over time. Project Marvel should be required to match pre-development runoff volume, maintain infiltration rates comparable to forested conditions, and limit rapid runoff that creates flash flooding. The goal is not just to prevent flooding, but to preserve the timing and distribution of water that sustains the creek.
Because 1,600 acres cannot be fully replaced onsite, restoration must extend across the watershed. A binding offset requirement should include restoration of two to five acres for every acre of effective impervious surface not fully mitigated onsite.
Priority placement is in headwater tributaries, floodplain corridors, and degraded industrial and commercial land. These restorations must do more than plant trees. They must rebuild soil structure, increase infiltration, and reconnect groundwater to streams. Performance metrics should include soil organic matter, infiltration rates, vegetation survival, and canopy development.
Streams cannot function without shade, stability, and filtration. Requirements should include wide, continuous riparian buffers along all streams and tributaries, no clearing, grading, or compaction within these zones, and active restoration where buffers are degraded. These buffers will reduce water temperature, stabilize banks, filter pollutants, and provide habitat continuity.
None of these matters without accountability. Project Marvel must include continuous monitoring of streamflow, water temperature, and withdrawal volumes. Required are public reporting of data and independent oversight. There must be clear consequences for non-compliance. Without enforcement, standards become suggestions.
The past is no longer a reliable guide. Permits must account for more intense rainfall events, longer dry periods, and increased variability. This means designing for larger storm capture, longer storage duration, and more conservative withdrawal limits.
The guiding principle should be simple and measurable. No net loss of groundwater recharge. No net increase in damaging runoff. No degradation of summer baseflow. If those conditions are met, the system holds. If they are not, the system fails.
Project Marvel will reshape the Valley Creek watershed. That is already decided. What remains undecided is whether it will be another step in a long pattern of degradation or a turning point—one where development is required not just to avoid harm but to repair what has already been lost.
The Birmingham darter does not have the ability to negotiate, adapt, or relocate. It depends entirely on the decisions made here. Those decisions must be precise. They must be enforceable. And they must be made now.
About the Author
Dr. Rob Moir is a nationally recognized and award-winning environmentalist. He is the president and executive director of the Ocean River Institute, a nonprofit based in Cambridge, MA, that provides expertise, services, resources, and information not readily available locally to support community efforts. Please visit www.oceanriver.org for more information.
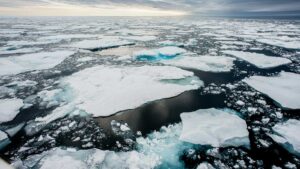
In March 2026, the Arctic’s winter sea ice reached one of the lowest levels ever recorded, at 5.52 million square miles, about 10% below the 30-year average. This was 10,000 square miles less than the 5.53 million square miles measured in 2025. The Arctic winter sea ice covered 5.56 million square miles in 2017 and 5.79 million square miles in 2020, and has been declining since then.
Less white ice means more dark ocean water, and dark water absorbs heat rather than reflecting it, speeding up wa
In March 2026, the Arctic’s winter sea ice reached one of the lowest levels ever recorded, at 5.52 million square miles, about 10% below the 30-year average. This was 10,000 square miles less than the 5.53 million square miles measured in 2025. The Arctic winter sea ice covered 5.56 million square miles in 2017 and 5.79 million square miles in 2020, and has been declining since then.
Less white ice means more dark ocean water, and dark water absorbs heat rather than reflecting it, speeding up warming, or so we are told. Yet, any helmsman will attest that the ocean is never truly black, except on a moonless night. Light reflects off the sea as brightly as the sky. A cloud-covered sky lowers the reflection, turning the ocean gunmetal gray.
Science is a cycle of observing, questioning, recording, and sharing. Imagine practicing science with a pair of pint glasses on a sunny day. Fill one glass with cold black coffee and the other with cold white milk. Place a thermometer in each and observe what happens over time.
Both the pint of coffee and the pint of milk will reach the same temperature as the air. The heating occurs through conduction, with the glass in contact with the air. Unlike a black car seat, water molecules are free to move. The chaotic motion of warming water molecules makes it impossible to heat water in a glass or coffee in a mug above room temperature with a hair dryer. Dark waters are not warmed by sunlight and so are not responsible for melting sea ice. Waters are warmed by contact with warmer surfaces, like when a coffee pot is placed on the stove.
The Arctic Ocean connects to the Atlantic Ocean via the Greenland Sea, which is part of the Atlantic. The Svalbard Archipelago is on the threshold between the two oceans. To the east of Svalbard is the Barents Sea. Covering about 540,000 square miles, the Barents Sea is north of Norway and Russia and west of Franz Josef Land. On the continental shelf, it is relatively shallow, with an average depth of about 750 feet. The average depth of the Arctic Sea to the North is about 3,900 feet.
The Arctic isn’t melting uniformly like a spring pond. Melting starts with warm Atlantic Gulf Stream water. Nearly all the Arctic Sea ice loss, totaling 525,000 square miles, happens in the Barents Sea, a part of the Arctic Ocean. This occurs because of the Coriolis Effect, a phenomenon caused by the Earth’s eastward rotation. The equator moves faster through space than the North Pole. As a result, water flowing north curves to the right. When it enters the Arctic, warm Atlantic water flows directly into the Barents Sea.
In April 1810, the whaler William Scoresby lowered a ten-gallon wooden cask made of fir into the deep after overwintering in the Greenland Sea west of Svalbard. This design was by Joseph Banks, the scientist on Cook’s expedition. Fir was the preferred wood because it is a softwood that insulates better than harder woods. Scoresby was surprised to find that the Gulf Stream water at 100 to 200 fathoms deep was six to eight degrees warmer than the Arctic water above. He didn’t believe it at first and modified the cask to record the temperature more quickly. However, the results were consistent. The Gulf Stream was flowing into the Arctic Ocean, separated from the sea ice by a layer of less salty, denser Arctic water.
Besides discovering changes occurring in the Greenland Sea, Scoresby observed, “changes of climate to a certain extent, have occurred, …, considered as the effects of human industry, in draining marshes and lakes, felling woods, and cultivating the earth” (Scoresby 1821, page 263).
Over time, the loss of vegetation and soils, replaced by hard surfaces that have become heat islands, has resulted in more and warmer stormwater runoff into the Atlantic. This happened without a change in annual rainfall. More water strengthens the Gulf Stream, and as temperatures rise, the expanded water has moved closer to the surface in the Arctic.
In 2007, the Gulf Stream surfaced in Svalbard, and warm water began melting glaciers on land.
During the winter of 2010-2011, the Gulf Stream was observed to have a more pronounced meander onto the Continental Shelf closer to Rhode Island than ever before. This indicates a need for a strengthened Gulf Stream to dissipate more energy.
The Gulf Stream flows past New Jersey at 30 to 40 Sverdrups, or 30 to 40 million cubic meters per second, with a seasonal variation of 5-15%. Maximum flow usually occurs in late summer to early fall. It gathers water as it barrels northward. The Gulf Stream transports more than 100 Sverdrups east of the Grand Banks off Newfoundland,
Only 2-3% of the total Gulf Stream flow is carried by the Norway Current into the Barents Sea, but it punches far above its weight in terms of climate impact in the Arctic Ocean.
Atlantification is the process by which warm Atlantic water melts Arctic sea ice. This leads to thinner winter sea ice that melts faster in summer. NASA imagery shows the Siberian coast from Norway to Alaska opening nearly simultaneously. The counter-clockwise gyre created by Atlantic water entering the Arctic pushes ice against Canada and Northern Greenland.
Rounding Greenland, the Arctic Ocean current flows south along Greenland and into the Denmark Strait between Iceland and Greenland. Here, the cold, nutrient-rich Arctic water meets warm, nutrient-poor Atlantic water and plunges 11,500 feet down. The Earth’s largest waterfall, three times taller than Angel Falls, is underwater.
The East Greenland Current will become the Labrador Current after rounding Greenland, carrying oxygen-rich and nutrient-rich waters into the Atlantic. The Grand Banks off Newfoundland will force Arctic waters to mix with warm, salty water, creating arguably the world’s most productive fishing region.
The Northeast Passage, the Arctic Ocean sea route from the Atlantic along the coast of Siberia to the Pacific, opened in the early 2000s. In 2007, the Northwest Passage through the Canadian Arctic Archipelago opened to shipping. The close timing of the two passages’ openings was a surprise, given our understanding of oceanography. However, solar radiation off the granites and gneiss (igneous and metamorphic) rocks of the Canadian Shield made the difference for a region where warm Atlantic water could not reach.
We need to reduce surface runoff by increasing vegetation cover and soil depth to help water stay on the land where it falls, while restoring the Arctic’s winter sea ice and cooling the climate. Additionally, we should naturally lessen the heat island effects of our structures by providing more shade and transpiration cooling from plants. Slowing down water flow during times of abundance to ensure it is available where and when nature needs it will lower seasonal ocean warming.
There are immediate benefits to having more water on land, such as more greenery, less warming, and decreased ocean swelling. The advantages for land, water, and sky are vast and difficult to fully understand. Still, the benefits of restoring Arctic sea ice are clear and serve as a clarion call for responsible local actions by all property owners, no matter where they are in the watershed we call Earth.
About the Author
Dr. Rob Moir is a nationally recognized and award-winning environmentalist. He is the president and executive director of the Ocean River Institute, a nonprofit based in Cambridge, MA, that provides expertise, services, resources, and information not readily available locally to support the efforts of environmental organizations. Please visit www.oceanriver.org for more information.
At one point, the Pacific Northwest lost three square miles of old-growth forest every week to clearcutting. Now, the Trump administration is returning to this practice.
In February 2026, the Bureau of Land Management (BLM) proposed changes to management plans for nearly 2.5 million acres of Oregon forests. The goal is to increase timber production fourfold and remove protections for old-growth forests and the endangered species that rely on them.
This proposal comes at a time when science is re
At one point, the Pacific Northwest lost three square miles of old-growth forest every week to clearcutting. Now, the Trump administration is returning to this practice.
In February 2026, the Bureau of Land Management (BLM) proposed changes to management plans for nearly 2.5 million acres of Oregon forests. The goal is to increase timber production fourfold and remove protections for old-growth forests and the endangered species that rely on them.
This proposal comes at a time when science is revealing even more about the importance of these forests. They are some of the best carbon-storing ecosystems on Earth, vital reservoirs of biodiversity, and essential for the communities nearby. If lost, they cannot be replaced within any human lifetime.
What Is an Old-Growth Forest?
Researchers first used the term in the 1970s to describe complex, biodiverse forests at least 150 years old. Still, there is no single definition for “old growth.” In the U.S., a federal rule protects trees over 21 inches in diameter in six national forests, where most old-growth forests are found. Many environmentalists define old growth as any forest that has never been logged. All definitions focus on complexity: old-growth forests have layered canopies, fallen logs in different stages of decay, and an understory full of fungi, ferns, and centuries of stored soil carbon.
In western Oregon, this complexity shows in Douglas fir and western red cedar trees that grow up to 200 feet tall, covered in moss so thick it hides their trunks. Even today, these forests are among the most productive timberlands in the world.
The Carbon Case, Revised and Strengthened
It was once believed that only young forests accumulated carbon while old forests merely stored it. Scientists now know that is wrong. A landmark global analysis of 519 forest carbon-flux estimates found that in forests aged 15 to 800 years, net carbon balance is usually positive. Old forests keep sequestering — they are not neutral.
A 2024 study in AGU Advances compared old-growth forests in the Pacific Northwest to younger managed forests. It found that old-growth forests produce more biomass for each unit of water used, keep storing carbon even as they age, and are much more resilient to drought than replanted forests. This resilience is especially important as Oregon faces hotter, drier summers, making the drought-buffering ability of old-growth forests just as valuable as their carbon storage.
A 2025 study in Science of the Total Environment found that mature and old-growth forests are better than younger forests at tackling both climate change and biodiversity loss at the same time. Plantations and second-growth timber stands cannot match these benefits.
The numbers show that cutting down old-growth trees is a bad idea. Bev Law, professor emerita at Oregon State University, told reporters that bringing BLM harvests back to 1 billion board feet a year, as the Trump administration aimed for in 2019, would be “insanity.” These forests can live for thousands of years. The carbon stored in their wood and soil stays out of the atmosphere and keeps building up over time.
Oregon Becomes a Battleground
The main threat from the Administration is focused on western Oregon’s O&C Lands. These lands, once granted to the Oregon and California Railroad, were returned to federal ownership in 1916 and now cover about 2.5 million acres across 17 counties managed by the BLM. In the 1960s, annual timber harvests often topped 1 billion board feet, reaching a peak of 1.638 billion in 1964. Harvests dropped sharply in the 1990s after the northern spotted owl and marbled murrelet were listed as threatened, and the Northwest Forest Plan shifted management toward conservation.
In February 2026, Trump’s BLM announced plans to revise management for these lands, aiming to bring timber production back to pre-1990 clear-cutting levels. The proposal covers all 2.5 million acres across 17 counties, including well-known areas such as the Sandy River watershed, North Fork Clackamas, the Valley of the Giants, the Upper Molalla River, and Alsea Falls. Since 2000, harvests have ranged from 45 to 275 million board feet per year. The new plan would raise that to 1 billion board feet.
The public comment period closed March 23, 2026; a record of decision is tentatively scheduled for February 12, 2027. That timeline could outlast the current administration, but the proposal, once formally proposed, would constrain future management options. The idea is to strip away environmental protections for salmon and drinking water and fire and fuels to maximize timber extraction across public lands in western Oregon, said George Sexton, conservation director for KS Wild.
The Roadless Rule and the Bigger Picture
The BLM proposal is part of a larger rollback. In August 2025, USDA Secretary Brooke Rollins announced that the Trump administration plans to end the 2001 Roadless Rule. This Clinton-era rule bans road building, logging, and mining on about 58 million acres of federal forest land, including 2 million acres in Oregon. Rollins described the rule as burdensome, outdated, and one-size-fits-all.
Environmental groups immediately promised litigation. “If the Trump administration actually revokes the roadless rule, we will see them in court,” said Earthjustice attorney Drew Caputo. Oregon Rep. Andrea Salinas introduced the Roadless Area Conservation Act in June 2025 to codify the rule into law, drawing nearly 50 House cosponsors.
In early 2025, Trump signed two executive orders telling agencies to speed up timber sales and avoid environmental reviews for more than 400 threatened and endangered species, such as wild salmon, marbled murrelets, and spotted owls. A Republican budget bill passed in the Senate also required the Forest Service to increase timber production by at least 250 million board feet each year and to sign 20-year logging contracts, regardless of the environmental impact.
Worth More Standing
There is a real economic case for logging, but it has limits. Many Oregon counties have struggled financially since logging declined in the 1990s, and timber revenue is important for rural budgets. However, industry representatives admit that most mills can no longer handle large old-growth logs. Technology now focuses on smaller and medium-sized wood, according to Amanda Sullivan-Astor of the Associated Oregon Loggers. The economic setup for harvesting old-growth trees is missing, even before considering legal challenges that could delay any plans for years.
The value of old-growth forests goes far beyond timber, and this is not reflected in timber prices. These forests support a huge variety of life, including not just spotted owls and murrelets, but also salmon, elk, bears, rare fungi, and plants that cannot survive even in plantations of the same species. Old-growth forests help manage water, protect drinking supplies, prevent erosion and landslides, and shield nearby communities from wildfires. This is the opposite of what the BLM claims clearcutting would do. In fact, the BLM’s own research has shown that clearcutting old-growth rainforests actually increases fire risk.
The fungal networks under the forest floor are getting more attention from scientists and in popular books. These networks add another layer of complexity that cannot be replaced. Scientists are still learning how trees use these fungal connections to share nutrients and chemical signals over many years. These systems take centuries to form and cannot be recreated in plantations.
Any unknown benefits that old-growth forests might offer will be lost forever, all for about $1,000 per centuries-old tree, the current price for old-growth timber.
What You Can Do
The BLM’s process for revising O&C Lands management is still ongoing. Although the public comment period ended in March 2026, the Environmental Impact Statement process is still underway, and legal challenges are almost certain. Here are some ways you can stay involved:
Contact your federal representatives about the Roadless Area Conservation Act and urge them to cosponsor legislation making the Roadless Rule permanent law.
Support the Old-Growth Forest Network, which works to designate protected native forests in every county in the U.S.
Visit and spend time in public lands. Your presence and spending as a visitor help show the value of forests beyond timber, which is important for land use planning.
If you live in a county with O&C Lands, go to local commissioner meetings where timber revenue is being discussed. While logging does bring in money, there are also strong financial reasons to keep forests intact, protect clean water, and support outdoor tourism.
Graft a patch of skin from one wild cheetah onto another, unrelated cheetah, and the recipient’s body will not reject it. Researchers documented this in the 1980s, and the result told them something unsettling: the world’s cheetahs are so genetically alike that, to an individual’s immune system, every other cheetah reads as a twin.
We’ve written recently about the species that have disappeared, both the confirmed extinct and populations crashing toward genetic oblivion. There is a quieter loss h
Graft a patch of skin from one wild cheetah onto another, unrelated cheetah, and the recipient’s body will not reject it. Researchers documented this in the 1980s, and the result told them something unsettling: the world’s cheetahs are so genetically alike that, to an individual’s immune system, every other cheetah reads as a twin.
We’ve written recently about the species that have disappeared, both the confirmed extinct and populations crashing toward genetic oblivion. There is a quieter loss happening inside animals that are still here. The North Atlantic right whale, the vaquita, and the cheetah are all still roaming the planet, albeit with less room to do so. The shocking truth is that none of them is genetically whole, and that distinction shapes what the science can do for them over the next century.
Survival and viability are not the same thing, and the gap between them is where this story lives.
The whale we can count to the individual
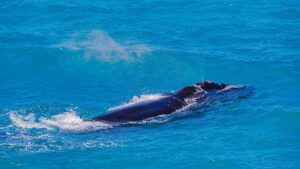
In October 2025, NOAA Fisheries and the New England Aquarium estimated that 384 North Atlantic right whales were alive at the start of 2024, a 2.1 percent rise from a recalculated 376 the year before, and a modest climb from the population’s all-time low of 358 in 2020. Researchers know these whales individually, by the callus patterns on their heads, in a photo-identification catalog built over decades. A species you can count one animal at a time is a species in trouble.
The arithmetic of recovery is harder than the headcount suggests. Fewer than 70 reproductive-age females remain, and the interval between calves has stretched from roughly three years to six or even ten. The 2025 calving season produced 11 calves; a genuinely productive year would top 20, and lasting recovery needs to be more than 50 births a year to raise the species from the brink of extinction. An Unusual Mortality Event declared in 2017, when 20 percent of the population died, is still ongoing, driven by vessel strikes and fishing-gear entanglement. Researchers estimate only about a third of right whale deaths are detected.
Underneath the visible threats sits an invisible one. The North Atlantic right whale carries among the lowest genetic diversity measured in any large mammal, a legacy of the whaling era that cut the population to a few dozen animals. There has been too much inbreeding, and low genetic diversity raises the odds that mating pairs share genetic profiles, which is linked to fetal loss and a reproductive rate roughly three times below the species’ biological potential.
There is one piece of better news: genomic work finds evidence of purging, a process that has lowered the frequency of the most harmful inherited genetic variants and leaves more room for recovery than the diversity numbers alone would predict.
Fewer than a classroom
The vaquita, a small porpoise found only in the northern Gulf of California, is the most endangered marine mammal on Earth. A joint visual and acoustic survey in 2025 put the count of distinct individuals observed at most likely seven to ten, in the same range as the six to eight seen in 2024. The entire species would not fill a school classroom.
The same survey surfaced the most surprising fact: the vaquitas it found were surviving and reproducing, with at least one or two calves observed, and there was no sign of the catastrophic single-year drops recorded earlier in the decade. The animals remain concentrated in and near the sanctuary at the heart of the Vaquita Refuge. Their one lethal threat is human: entanglement in illegal gillnets set for totoaba, a fish whose swim bladder commands high prices as a medicine and gourmet delicacy in an illicit trade.
Genetics, counterintuitively, is the part of the vaquita’s situation that offers hope. A 2022 study in Science sequenced 20 vaquita genomes and found that the species has been naturally rare for hundreds of thousands of years, which left it with a low burden of harmful genetic variation. In summary, they are not susceptible to the damage caused by inbreeding.
Simulations in that work concluded the vaquita is not doomed by inbreeding and is highly likely to recover — if gillnet deaths stop immediately. The vaquita is the clearest case of a species whose genetics are not the obstacle. The obstacle is fishing nets set for archaic and exploitative reasons.
The cheetah’s deep bottleneck
The cheetah’s genetic story is the oldest of the three and the hardest to undo. The global wild population is estimated at about 7,100 adults and adolescents across 33 fragmented populations, occupying just nine percent of the cat’s historical range; 91 percent of those populations include 200 animals or fewer. But the cheetah’s defining problem predates the modern range collapse by thousands of years.
That skin-graft result from the 1980s pointed to a species squeezed through an ancient bottleneck. A 2025 genetic analysis of southern African cheetahs supports a gradual decline over roughly the past 10,000 years — most likely driven by climate-era shifts in vegetation and prey — and estimates their present-day effective population size at just 700 to 1,600, which reflects a genetic measure of how many individuals are actually contributing their genes to the next generation; it typically runs far below the number of animals you could count in the field. A population can look reasonably stocked and still carry the “genetic thinness” of a far smaller one. The costs of that thinness show up in cheetahs as poor sperm quality, heightened disease vulnerability, and diversity that keeps eroding even where total numbers hold steady.
The Asiatic cheetah, clinging to its existence in Iran, shows where this story ends. Its effective population size has been estimated at 11 to 17, and researchers argue its survival now depends on urgently protecting the habitat corridors that let isolated animals find one another to increase the chance they will mate.
What was lost
Diversity itself. Genetic variation is the difference between individuals in a population, and it is not a luxury feature. A broad genetic menu is the raw material that natural selection runs on. A right whale or a cheetah population with little variation has fewer options stored away for whatever comes next.
The capacity to adapt. A new disease, a warming ocean, a shifting prey base — a diverse population contains individuals that happen to cope well with changes, and they become the next generation. A genetically narrow population may simply have no members equipped to adapt to change. This is why a species can be present and counted yet functionally unable to respond to change. Climate change is driving ecosystem changes that many species, even with large populations, struggle to cope with.
Time. Diversity is rebuilt by mutation over many generations, on timescales that dwarf any conservation budget. You can stop a ship or cut a net this year. You cannot restock a gene pool this century. That is the heart of the bottleneck problem.
Three bottlenecks, three clocks
These animals reached the same narrow path to survival by very different routes. The cheetah’s bottleneck is prehistoric, written into the species long before humans were a factor. The right whale’s was industrial, its world reshaped by centuries of commercial whaling and sea-going freight. The vaquita’s is unfolding inside a single human generation, the byproduct of an illegal fishery operating where it should not.
Yet the genetics also refuse a tidy moral. The vaquita and the right whale both show signs of purging, the quiet removal of the worst inherited variants, which means a small population is not automatically a doomed one.
The lesson is not that low diversity is a death sentence. It is that genetic poverty removes a species’ margin for error and then leaves the outcome to us. For the vaquita and the right whale, the limiting factor is human intervention in their ecosystems.
What you can do
None of these are backyard problems. The levers are fishing gear, shipping rules, habitat policy, and international enforcement, which means individual action matters mostly as pressure on the institutions that hold those levers. With that said:
Source seafood that doesn’t kill what it isn’t targeting. Bycatch in nets — the species the fishermen don’t want — is the proximate threat to both the vaquita and the right whale. Use a guide like Seafood Watch and avoid products tied to gillnet fisheries; support enforcement against the illegal totoaba trade driving vaquita deaths.
Back ropeless gear and slow-speed zones. On-demand (“ropeless”) fishing gear and seasonal vessel speed limits are the concrete tools that reduce right whale entanglements and strikes. Support the regulations and the fishermen adopting them.
Defend habitat connectivity for big cats. For cheetahs, corridors that reconnect fragmented populations are the only practical way to move genes between isolated groups. Support organizations working on rangeland coexistence and protected-area linkage.
Fund the genetic insurance. Biobanks, genome sequencing, and breeding programs managed explicitly for diversity are how we preserve options we can’t yet name. They are unglamorous and chronically underfunded.
Protect the legal scaffolding. The Endangered Species Act, the Marine Mammal Protection Act, and international agreements like CITES are what keep these species on anyone’s agenda. Engagement with that policy is the highest-leverage action on this list.
Editor’s Note: Our next installment of Environmental Losses moves from individual species to whole systems, beginning with the ocean’s most biodiverse ecosystem — the coral reef — and the cadence of bleaching that has collapsed the recovery time reefs need to survive.
Each year, over 11 million metric tons of plastic end up in the ocean, which is like dumping a garbage truck full of plastic every minute. For years, we’ve known that marine animals eat this debris, but no one had measured exactly how much plastic it takes to kill them. Dr. Erin Murphy, who leads ocean plastics research at the Ocean Conservancy, is the principal author of a major study published in the Proceedings of the National Academy of Sciences. Her team analyzed more than 10,000 necropsi
Each year, over 11 million metric tons of plastic end up in the ocean, which is like dumping a garbage truck full of plastic every minute. For years, we’ve known that marine animals eat this debris, but no one had measured exactly how much plastic it takes to kill them. Dr. Erin Murphy, who leads ocean plastics research at the Ocean Conservancy, is the principal author of a major study published in the Proceedings of the National Academy of Sciences. Her team analyzed more than 10,000 necropsies from 95 species of seabirds, sea turtles, and marine mammals worldwide. Earth911’s summary describes this critical study, which found lethal plastic thresholds that could change how we view the plastic crisis.
Dr. Erin Murphy, Manager of Ocean Plastics Research at the Ocean Conservancy, is our guest on Sustainability In Your Ear.
The study measured how deadly different types of plastic are to sea life, which makes the results especially useful for policymakers. Each finding suggests a clear policy action, such as banning balloon releases like Florida has done, banning plastic bags as in California’s SB 54, or improving how fishing gear is marked and recovered. Still, Erin points out that focusing only on certain plastics is not enough. Her team found that even small amounts of any plastic can be dangerous. As she says, “At the end of the day, there is too much plastic in the ocean,” and we need big changes at every stage of the plastics life cycle, from production to disposal.
There’s encouraging evidence that interventions work. Communities in Hawaii conducted large-scale beach cleanups and saw the Hawaiian monk seal population rebound. A study published in Science confirmed that bag bans reduce plastic on beaches by 25 to 47%. And Ocean Conservancy’s International Coastal Cleanup, now in its 40th year, removed more than a million plastic bags from beaches last year. These actions address a parallel crisis in human health that is building from the same pollution source. Most of the microplastics now found in humans and around the world began as the same macroplastics that are killing puffins and turtles. As Erin puts it, “I do view this all as part of the same crisis.”
Editor’s Note: This episode originally aired on February 9, 2026.
Interview Transcript
Mitch Ratcliffe 0:00
Hello, good morning, good afternoon or good evening, wherever you are on this beautiful planet of ours. Welcome to Sustainability In Your Ear. This is the podcast conversation about accelerating the transition to a sustainable, carbon-neutral society, and I’m your host, Mitch Ratcliffe. Thanks for joining the conversation today.
We’re going to talk about ocean plastics. Every year, more than 11 million metric tons of plastic enters the ocean. That’s the equivalent of dumping a garbage truck worth of plastic every minute. And we’ve known for decades that marine animals eat this debris. But until recently, no one had systematically quantified how much plastic it actually takes to kill them.
And the answer is, it turns out, disturbing. Less than three sugar cubes worth of plastic increases an Atlantic puffin’s risk of dying by 90%. A loggerhead turtle reaches the same threshold at about two baseballs worth, and for a harbor porpoise, a mass of plastic roughly the size of a soccer ball can kill. More concerning, at the 50% mortality level — that is, where half the animals who consume the plastic die — the volumes that kill them shrink to less than one sugar cube for a puffin and half a baseball for a loggerhead turtle.
Our guest today, Dr. Erin Murphy, is the manager of ocean plastics research at the Ocean Conservancy, and lead author of the study that produced these findings, published last month in the Proceedings of the National Academy of Sciences. Her team’s research analyzed more than 10,000 necroscopies across 95 species of seabirds, sea turtles, and marine mammals worldwide. It’s the most comprehensive assessment yet of how different plastic types — soft film like bags, hard fragments, synthetic rubber from balloons, and abandoned fishing gear — translate into mortality across marine life.
The findings matter beyond ocean conservation. A 2024 study in the New England Journal of Medicine found microplastics embedded in human arterial plaque of cardiovascular surgery patients, and those with detectable plastics were 4.5 times more likely to suffer a heart attack, stroke, or death in the following three years. The same polymers killing seabirds and sea turtles — polyethylene, PVC, and their chemical additives — are found in human blood, lungs, liver, and placenta.
Dr. Murphy’s research offers policymakers what they’ve been asking for: science-based data to inform decisions about which plastics to regulate and how aggressively to act. Nearly half the animals in her study that had ingested plastics were threatened or endangered species, and with global negotiations on a binding plastic treaty continuing and extended producer responsibility programs expanding across the United States, the timing of this research could not be more relevant.
So we’ll talk with Erin about what her team found, why balloon fragments are amongst the deadliest items for seabirds, how fishing gear became the leading killer of marine animals, and what her research means for the humans who share a planet and a body burden with these species. You can read the full study at pnas.org and find Ocean Conservancy’s work at oceanconservancy.org. Ocean Conservancy is all one word, no space, no dash. Oceanconservancy.org.
So how much plastic is too much for wildlife and for humans? Let’s find out right after this brief commercial break.
[COMMERCIAL BREAK]
Welcome to the show, Erin. How you doing today?
Erin Murphy 3:44
I’m doing well. Thank you so much for having me.
Mitch Ratcliffe 3:46
Well, thank you for joining me, and for this really important research. It was a fascinating read. We wrote it up, and I’m really pleased that you would join us to talk about it today. So can you explain what made this study different from previous attempts to quantify plastics’ lethality to marine life?
Erin Murphy 4:01
Yeah. So first, I’ll specify that we focus specifically on macroplastics, which are just plastics that are bigger than five millimeters in length. There’s more research on how microplastics, which are these smaller plastics, can harm animals, because scientists can study these in laboratory settings. Of course, it’s not feasible or ethical to feed animals like whales, sea turtles, or seabirds large plastic items and study what happens to them in the lab. And so as scientists, we really have to depend on opportunistically collecting dead animals in the environment and looking at what’s inside them to understand what’s happening with these bigger plastics.
And so previous research has looked at these sorts of threats as well, but they focused on fewer species, on smaller geographic areas, and they didn’t differentiate by plastic type, like hard plastics versus soft plastics. So they were really important for laying the groundwork for our larger study. But we were actually able to look globally and look at a broader set of species, and also differentiate by these different plastic types and by species size as well, which allowed us to get at some of these species-level understandings.
Mitch Ratcliffe 5:13
So the unfortunate truth is, we are feeding these animals this material by throwing it all away. That is a stark way of starting this conversation. And you use a lot of illustrative examples, like three sugar cubes worth of macroplastic can kill a puffin. How did you arrive at those kind of volume-based comparisons, and why is translating your data into those relatable measures important?
Erin Murphy 5:37
Yeah, so when we did this in the study, we actually looked at the influence of volume based on the animal’s body length. So we reported all of this as a deadly volume per centimeter of body length. But telling people 0.098 centimeters cubed per centimeter doesn’t really mean anything to them. And honestly, when I first got those centimeter-based thresholds, it didn’t mean that much to me.
And so we thought that choosing some iconic species that people could picture would help, but still saying, you know, three centimeters cubed of plastic kills a puffin, or 220 centimeters cubed of plastic kills a loggerhead, doesn’t really paint a picture in people’s heads, and three sugar cubes or a baseball are much easier to picture.
So we chose to do this because I think when people can picture these items, they can really understand that volume, and people do use plastic every single day, and so having volumes like that to compare to allows them to think about how little plastic can kill animals, especially when we compare it to how much we produce or use globally.
Mitch Ratcliffe 6:42
Can you put in context how long it takes for a puffin, for instance, to eat that much plastic? What do they eat in a day or a week generally?
Erin Murphy 6:52
Yeah, that’s a great question, and it’s actually the next step in our research. So to estimate the risk that something poses to wildlife, we have to understand two things. One is your question: how likely are they to be exposed to this threat? The second is, if they are exposed to it, how likely is it to harm them? And so this research really focused entirely on that second piece.
But to fully understand risk, we have to dig deeper into the first part, and that’s what we call likelihood of exposure. And so for puffins specifically, there’s not a lot of research, but we do know a lot about what species are eating, and we know that different species are more or less likely to eat plastic based on where they live, what they eat, and how they feed. So we’re really excited to be working with some really amazing researchers over the next few years to think about how we can connect exposure for these animals to the lethality and understand risk in a more comprehensive way.
Mitch Ratcliffe 7:48
I want to get a sense of what you found. You mentioned in the study that one whale can have a three-gallon bucket in its stomach. What’s the range of objects that you encountered as you were doing the research?
Erin Murphy 8:00
Yeah, this was pretty unbelievable to me, actually, some of the things that we saw in animals, and I’ll just give a few items that stood out to me. But there’s many more. Part of an oar handle from a plastic — or a plastic belt, webbing from the back of a lawn chair, a koozie, rubber pencil topper, fake Easter grass, ice cream tubs, single-use coffee pods, bungee cords, tons of different types of gear, ropes, nets, fishing line.
But I’ll just illustrate kind of how dramatic this can look with one example that really stood out to me, on a sperm whale that researchers in Spain reported on. Sperm whales feed very deep in the ocean, and they use echolocation to find their food. So it may be particularly hard for them to tell plastic from prey. And in this case, it seems like an entire greenhouse washed into the ocean, and this sperm whale happened upon it. It had plastic film cover material for a greenhouse in its stomach, along with a flower pot, a piece of a hose, a plastic burlap sack, plastic craft, and plastic spray bottle, and even fake plastic mulch in its stomach. And unfortunately, this was one of the individuals that did lose its life to plastic ingestion.
Mitch Ratcliffe 9:23
That’s — I mean, that’s shocking in so many ways. You found that one in five animals had plastic in their digestive tract when they died. Was this percentage higher or lower, and in the context of your previous answer, more or less shocking than you expected?
Erin Murphy 9:45
Yeah, I think, you know, it was higher than I expected. And it’s funny, because all of our research was based on previous research. It was a meta-analysis. So we collected data from existing literature. And I’d seen some, you know, similar numbers then reported at more local scales. But I think it still really shocked me to look at so many studies and see, you know, for sea turtles, that was one in two. Sea turtles had plastic in their gut. And for seabirds, one in three.
And when thinking about that at a global scale, that felt higher to me than it should be, and I suppose it’s because it is higher than it should be. These really are high ingestion rates. And for some of these individuals, the bulk amount of plastic in their gut, like that sperm whale, is particularly shocking.
Mitch Ratcliffe 10:35
I want to step back just for a second and talk about how long this kind of research has been going on. Because when I was a child, oceanography was very much in its infancy. How aggressively are we trying to understand what we’re doing to the ocean environment at this point, and where do you think we are in terms of the long arc of beginning to reach that understanding?
Erin Murphy 10:58
Yeah, I don’t know if we’ll ever fully understand it, which is one of the things that makes studying the ocean so interesting. It’s so complex and vast. But, you know, we’ve come a long way, and for plastic pollution in particular, the ’70s was really when we started seeing those first reports of animals eating plastics. You know, and it’s been 50 years since then. Now we have evidence of plastic ingestion in more than 1,300 species, and we’re starting to be able to get at these really more complicated analyses that help us understand like the potential quantity that kills an animal, like this one, or what does that mean possibly for populations.
I think the thing that’s been really impressive in the last decade, though, is how much research has been done on plastics. In particular, 10 years ago, roughly, the first study came out by Jambeck et al. that gave us an idea of the amount of plastic that was getting into the environment. And since then, we have learned so much as a scientific community, and people are working really hard to try to understand what these vast amounts of ocean plastic mean for ecosystems, for human health, for fishing industries and other marine industries that really depend on a healthy ocean, and we’ve been doing a lot of research on how to address it. So I don’t think we’ll ever fully understand everything that we’re doing to the ocean, but I think we’re working hard as a scientific community to get there.
Mitch Ratcliffe 12:38
It’s really disturbing to think about, because plastic in the 1970s was really only — was 10 years into widespread use, and widespread compared to today is nothing, since half the plastic we’ve manufactured in history has been made since 2002. So it sounds like what we’re really delving into now is a real-time accounting of the damage that we’re doing. How do you as a scientist think about what your goal is in terms of bringing the consequences of our decisions back to the public so we can think about it?
Erin Murphy 13:11
Yeah, that’s why I feel very lucky to work with an organization like Ocean Conservancy. We conduct research that we know governments and decision makers need to help address these problems, and we have a policy team and a communications team that are really well trained on helping us bring this research to the decision makers.
And the type of research we’re doing here, in particular on risk assessments, is something that governments are really craving. They want to set science-based targets as they try to address plastic pollution, and part of that is understanding environmental thresholds that we should be aiming for to better protect marine wildlife, to better protect marine ecosystems.
And so when we do research like this, a big part is getting it into the literature, in this sense to the scientific community, but it’s also working with our policy team and our communications team to make sure the public hears about it, and to make sure that decision makers nationally and abroad hear about the work that we’re doing, and can use this to help inform science-based targets that they’re setting right now.
Mitch Ratcliffe 14:22
So one of the materials that you found was most dangerous is rubber, particularly from balloons. It emerged as especially deadly for seabirds, where you estimated that just six pea-sized pieces could create a 90% mortality rate. What’s happening physiologically with balloon fragments that make them so lethal?
Erin Murphy 14:45
Yeah, so if you think about the design of a balloon, they’re super stretchy, and they’re long and they’re thin, and even the fragments seem to have this shape. And so they get stuck at those junctures in the gastrointestinal tract, like between the stomach and the intestine. And the gut moves things along through these wave-like contractions. And it seems like these stretchy materials just kind of stretch with it, and so the gut just isn’t able to move them through as easily. And we see similar things for those plastic bags as well.
Mitch Ratcliffe 15:20
Well, you also point out that sea turtles appear to mistake plastic bags for jellyfish. Is there anything we could do in terms of the chemistry of soft plastics or the appearance of soft plastics to make them less attractive to sea life?
Erin Murphy 15:35
Yeah, I don’t know if there’s a way that we can make them less attractive that I know of. And it’s unfortunate, because we know there are a lot of plastic bags in the environment compared to other plastics. Every year, Ocean Conservancy organizes the International Coastal Cleanup, and plastic bags are consistently in the top 10 items we see most frequently.
That being said, we do know ways of keeping plastic bags out of the ocean and protecting turtles in that way. And so every year — or in this last year, during our Coastal Cleanup — we collected, or our partner organizations collected, more than 1 million bags off our beaches. So this is really important for helping protect ocean animals, because those bags are already very close to their environment, and by removing them from beaches, we prevent them from getting into the ocean.
We also know that plastic bag bans, like the policy that California just implemented, are very effective in reducing the threat that plastic bags pose to marine wildlife, and help by preventing them from getting into the environment in the first place. So there was a recent study published in Science that actually showed that communities that implement bag bans, whether that’s a city, a state, or a country, do meaningfully reduce the amount of plastic bags that end up on beaches by 25 to 47%. So that’s a really significant reduction, and just provides further evidence that we know how to address some of these threats. We have ways of measuring if policies are effective, and it’s really about preventing these bags from getting into the environment in the first place.
Mitch Ratcliffe 17:18
Another example of really short-term human thinking is the impact of fishing gear pollution. Can you talk a little about what you found in terms of what’s being tossed overboard by the boats that are hoping to treat the ocean as an ongoing resource and source of living?
Erin Murphy 17:36
Yeah. I mean, I think a lot of the fishing gear that’s lost is lost on accident. Fishing gear can be really expensive for fishermen. Like crab pots can cost thousands of dollars. And so these are very valuable resources for fishers, and they’re expensive to replace.
But unfortunately, one of the challenges with fishing in turbid and wavy environments around storms, especially with things that are set, is that some gear does get lost. And we did see interactions and ingestion of fishing gear by many of these animals. And partially that’s because gear attracts prey species. So we know that for some animals, they’re more likely to interact with fishing gear, and this isn’t just ingestion, but also being entangled in fishing gear, because, you know, that gear is still fishing. And for a lot of these bigger species, fish are their prey, and so they’re also being drawn to these devices, or this lost gear that might have their food in it.
Mitch Ratcliffe 18:44
And your study didn’t look at the external plastic lethality, it was only that which was consumed. So we don’t really fully understand what the consequences of, say, for instance, a net lost at sea is for the ocean yet? Or do we?
Erin Murphy 19:01
Yeah, we have — there’s some studies that have looked at this, but this is actually another study we’re working on. So one of the next papers we’re working on right now is looking at entanglement lethality, and that really will be important for understanding the impacts of plastic pollution together, because ingestion and entanglement, when we talk about these bigger plastics, are the two main threats that we see.
Mitch Ratcliffe 19:24
I feel like we’ve got our bearings and can have a really productive conversation. But folks, we’re going to take a quick commercial break. We’ll be right back.
[COMMERCIAL BREAK]
Welcome back to Sustainability In Your Ear. Now, let’s get back to my discussion with the Ocean Conservancy’s Dr. Erin Murphy, who led a groundbreaking study about the lethal effects of macroplastics in sea life. Erin, nearly half the animals that you studied that had ingested plastics were already listed as threatened. Is plastic pollution accelerating extinction risk, and what species do you feel are most endangered?
Erin Murphy 20:03
Yeah, that’s a great question. Right now, there’s not a lot of research yet on population-level effects of plastic pollution, and our study is really helping build that information out. But it’s just very difficult to understand what’s happening to populations that often we have trouble studying in the first place.
Still, for many marine species, the IUCN Red List notes plastic pollution as a significant threat. Six out of seven sea turtle species are threatened. We saw really high ingestion rates for sea turtles. We know that 5% of the turtles in our data set died from plastic ingestion.
So I think there is a lot of evidence suggesting that this could be contributing to extinction risk. And there are some studies that look at very specific populations that we know are vulnerable, like the Hawaiian monk seal, that have found that plastic pollution is contributing to extinction risk.
And the hopeful piece in the Hawaiian monk seal case was actually that as communities started doing large-scale cleanup efforts in the Hawaiian Islands, they actually saw a rebound of that population. So again, just a reminder that even though we know that this is something that is posing a threat to marine species we really care about, it’s also evidence that targeted and effective intervention strategies can be really important in helping some of these species rebound.
Mitch Ratcliffe 21:34
That’s encouraging. So it isn’t as though we’re doomed, or that nature is doomed. We can intervene in our behavior today and make a change for the better in the future. How does the Ocean Conservancy encourage people to do that?
Erin Murphy 21:49
Yeah, so there was a study that we — some of us co-authored, and the Ocean Conservancy supported — that came out in 2020 that looked at what we would really need to do on a global scale to reduce plastic pollution in the ocean meaningfully enough to hit some of our potential targets. And in this case, we were thinking about just returning to 2010 annual leakage rates into the environment.
And what we found is that we really need sweeping change to our relationship with plastic and our waste management systems. And so we found that to achieve this goal, we would need a 40% reduction in plastic production globally. We would need waste management to reach levels of 98 to 99%, depending on the income of the country. And we would need, annually, 40% of waste that gets into the environment to then be cleaned up.
And at Ocean Conservancy, we really work on policy efforts in all three of those big buckets. And so we have the International Coastal Cleanup, but we also work on upstream policies with our policy teams at the sub-national, national, and international levels to try to work towards some of those goals of reducing plastic production and better managing the plastic waste that we do use.
Mitch Ratcliffe 23:10
You used the phrase “our relationship with plastic,” which is an interesting concept. In 2024, the New England Journal of Medicine reported that microplastics were found in human arterial plaque, and that resulted in much higher risk for cardiovascular events. Do you see what you’re studying as a parallel crisis, or the same crisis, just in a different species?
Erin Murphy 23:35
Yeah, I view that — you know, so they were looking specifically at microplastics, and we focused on macroplastics in this study. That being said, most microplastics that are in the environment are breaking off of these larger macroplastics. So in that sense, I do view this all as part of the same crisis, and I think we need to think about all of the harms that plastic materials are causing to human health, to animal health, and to sociocultural outcomes like our marine and terrestrial industries that are affected by plastic pollution, and we need to think about comprehensive policies that are addressing all of those harms.
Mitch Ratcliffe 24:17
Are there studies that are showing the same types of impacts from plastic in human and non-human species that we can use to start to tell the story in that same illustrative way that you did with the sugar cube analogy, so that people really take this seriously? I mean, the problem with our society is that we’re accustomed to throwing everything away.
Erin Murphy 24:40
Yeah, so there’s a lot of really great research that’s being done on microplastic exposure in other marine and aquatic organisms, and those are more similar to what’s happening in humans. But that human research, and the research on sort of sub-lethal microplastic risks — like the risks to cardiovascular systems, nervous system, gastrointestinal tracts — those are all pretty new, and so this body of research is really building, and I think we’re going to learn a lot in the next decade.
Mitch Ratcliffe 25:14
Do you see an acceleration of your ability to make those kinds of conclusions — well-grounded conclusions — emerging as a result of the advent of something like artificial intelligence? Are we at the dawn of a scientific revolution?
Erin Murphy 25:33
You know, that’s a good question. I don’t know in what ways AI will change the way that we’re doing research. Definitely, the rate at which we are producing research has increased. There’s more people working on these issues, and the scientific process is really just about iterating as a community and building on what we know. And so I think what we’re seeing here is a large-scale interest in this plastics issue and a big concern by the scientific community and by the public.
And as we learn more, we can answer more complicated questions. And so I was only able to do my work because over the last five decades, people have been studying what plastic is in the animals and reporting on that, and we have thousands of published papers now that tell us about what animals are consuming. And each one of those papers is really important in producing this bigger picture. And as we have, you know, similarly more studies on these sort of individual systems and humans, using model organisms like mice, we will be able to do the same sort of thing of painting this bigger picture for humans as well.
Mitch Ratcliffe 26:48
So as we get this higher-resolution view of what we’re doing, both to the planet and to ourselves, how does Ocean Conservancy potentially use those storytelling opportunities to get us to think about things like plastic bans, or the impact of extended producer responsibility on not just what ends up in the environment, but what we design so that it doesn’t end up in the environment in the future? It’s a big, complicated, multifaceted story. Where are we going?
Erin Murphy 27:17
Yeah, that is true, and I am not the policy expert at Ocean Conservancy, but the work that they do is amazing. And they, you know, they go and they talk to the public about these issues and educate the public through blogs and other resources to make sure that people understand the scale of the problem. And they work really closely with local decision makers who are interested in addressing these problems and help them develop bills, help them build support for bills. And, you know, we’ll meet with legislators and other leaders to help them kind of understand the reason that these policies are useful.
So Ocean Conservancy in the last 10 years has done a lot of work on state bills, like helping to push forward California’s SB 54, or specific bills that are targeting problematic plastics. Like recently, Florida passed a balloon release ban. Ocean Conservancy was also really involved in pushing that.
And I think we have seen with plastic pollution — what, for me, one of the things that’s most comforting in studying plastic pollution is actually that people do really seem to care about this issue and do seem willing to make change. So when people find out what I research — strangers — they always tell me about what they’re doing to reduce their plastic footprint, and I think that’s just a sign that there is appetite for change, and people want to understand how to do it. And as an organization, we’re just trying to leverage that passion and that stewardship that does kind of inherently exist in people, especially when they see the plastics that they’re using, and use that and sound science to help develop policies that can actually make a change on this issue.
Mitch Ratcliffe 29:06
Building on what you mentioned a moment ago, based on your findings about which plastics are the most lethal, it sounds like it’s a blend. But should policymakers prioritize specific materials, or just look at broad categories? No more of this type.
Erin Murphy 29:23
I think we need to do both. So we did find that different plastics pose different levels of risk, and I think there’s policies that are smaller and easier to implement, like balloon release bans and bag bans, that are effective in targeting some of these problematic plastics specifically. You know, using that Hawaiian monk seal example as well, having very targeted and strategic cleanups can be really important for protecting animals at sea turtle nesting beaches or seabird nesting areas. There’s these areas that we know are of particular importance for animals.
But still, the total plastic thresholds that we found were also low, and we see all types of plastics in these animals. So at the end of the day, there is too much plastic in the ocean, and we do need sweeping reforms along the entire plastics life cycle, from production to management to disposal, to meaningfully address this issue and protect our oceans.
And it takes longer to implement these policies because it does require some pretty extensive system-wide changes. But I think policies like California’s SB 54, which aims to reduce 25% of single-use plastics used, that’s really a step in the right direction. And so our policy team is on the front lines of making sure that that bill is fully implemented and that we understand the benefits of that policy by monitoring outcomes and effectiveness of it.
Mitch Ratcliffe 30:56
You mentioned earlier that on the International Coastal Cleanup Day, which is a distributed event all over the world but a day, they collected more than a million plastic bags last year. Is the goal in the long term to no longer need to do those cleanups? Or do you anticipate that we’re always going to be needing to do those cleanups?
Erin Murphy 31:18
Yeah, I think unfortunately, at this point, it’s hard to imagine a world where cleanups aren’t necessary. I think when we did that study in 2020, that was led by Lau et al., it was pretty alarming to see how much we would have to reduce plastic production and how well we would have to manage waste to no longer need cleanups at all, and we really did find that cleanups needed to be an important part of this solution.
And there’s already a lot of legacy plastics in the ocean. So I think as far as we can look forward, cleanups will always be an important part of the suite of solutions that we use.
They’re also really effective for monitoring what’s happening in our ocean. So I mentioned earlier that study that was published in Science that showed that plastic bag bans are effective. We were really excited to see that they actually used Ocean Conservancy International Coastal Cleanup data to do that analysis, and it really just emphasizes the value of citizen science. When you go out and collect data during a cleanup on your beach, we can see what changes occur through time in terms of what debris you’re seeing, and that helps us better understand whether it’s targeted policies or these broader policies, if they’re being effective or not.
Mitch Ratcliffe 32:42
What does the Ocean Conservancy do to help people do citizen science beyond the International Coastal Cleanup?
Erin Murphy 32:49
So that program has been going on for 40 years, and that’s really, in terms of citizen science, our main body of work. But we are interested in having citizens engage in other ways. So we often have — you can sign up for our newsletter and get information about opportunities to call your senators or write your senators or legislators about important ocean issues that are coming up.
And we also just have a lot of educational material so that people can start their own cleanup events, or find cleanup events to participate in, so that individuals can be engaged in being part of the solution.
Mitch Ratcliffe 33:31
You’ve mentioned a couple of items of research that you are beginning to pursue now. But if you had unlimited resources for the remainder of your career, what would you like to investigate and build on those findings with?
Erin Murphy 33:44
Yeah, it’s pretty hard to imagine unlimited resources, especially now, I know. But yeah, you know, we already started working on answering some of these next questions that are remaining for us, and I’m really excited about the work that we’re going to be doing over the next three to five years. And I will not be surprised if, you know, this body of work, trying to understand what’s happening to ocean animals, becomes a career-long question for me.
But in the short term, the things we’re really trying to get at is, first, that entanglement piece, which you mentioned — what is the lethality of plastic entanglement. And we also just launched a working group with scientists from all over the world to take what we have learned about the lethality of plastic ingestion and to build out, include what we are learning right now in our research about entanglement, and then bring in that exposure piece.
So that question you asked earlier about how much plastic is a puffin eating, how often does it have a lethal dose — that’s really what we want to get at. We want to know if we have an idea of what’s in the environment, how likely is that to have population-level effects for species? How likely are they to eat a lethal dose? How likely are they to die? And are we worried about populations because of this?
And right now, governments around the world are really trying to determine how to effectively address plastic pollution, and these sorts of comprehensive risk assessments are really helpful in setting targets. And so that’s really what I want to keep getting at: How can we take everything we know and help decision makers better understand, you know, a reasonable goal? Because a perfect goal is an ocean with no plastic, and I think we have to keep working towards that collectively. But it’s also really important to understand what species are being adversely affected and what we can do to immediately protect them now.
Mitch Ratcliffe 35:46
Well, it’s a multi-generational challenge, and I really applaud the work that you’re doing. How can folks keep up with the work that you’re undertaking?
Erin Murphy 35:55
Yeah, we have a brand new website at oceanconservancy.org, and we have a lot of information there, you know, specifically on what our plastics team is doing, but on what our entire organization is doing in terms of bills that we’re working on. They can also sign up for our newsletter to get information about what the organization is working on, and that will give them ample opportunities to participate in being part of the solution to the plastics crisis.
Mitch Ratcliffe 36:20
Erin, thanks so much for your time today. It’s been a fascinating conversation and an encouraging one.
Erin Murphy 36:26
Thank you. It was great to be here.
[COMMERCIAL BREAK]
Mitch Ratcliffe 36:34
Welcome back to Sustainability In Your Ear. You’ve been listening to my conversation with Dr. Erin Murphy, manager of ocean plastics research at the Ocean Conservancy, and she’s the lead author of the recent study published in the Proceedings of the National Academy of Sciences that quantifies, for the first time at this scale, how much plastic it takes to kill seabirds, sea turtles, and marine mammals.
You can explore the Ocean Conservancy’s wide-ranging work and sign up for a beach cleanup event at oceanconservancy.org. Ocean Conservancy is all one word, no space, no dash. Oceanconservancy.org.
The numbers Erin and her colleagues reported should stop us in our tracks. The volumes we heard about are disturbing, but imagine — one in five animals had plastic in their gut when they died. For sea turtles, it was one in two. What makes that study especially useful for policymakers is its differentiation by plastic type. Rubber fragments can be targeted because balloons are the deadliest material for seabirds. Soft plastics like bags are the top killer for sea turtles. Ghost fishing gear poses the greatest risk to marine mammals like whales. And each of these findings points to a specific, actionable policy lever: balloon release bans like Florida’s recent legislation, bag bans like California’s, and better gear-marking and recovery programs for the fishing industry.
But the targeted approach is only part of the answer. As Erin emphasized, the total plastic thresholds her team found were low across the board, meaning that every type of plastic poses a threat. “At the end of the day,” she said, “there is too much plastic in the ocean, and we need to do sweeping reforms along the entire plastics life cycle, from production to management to disposal.” That’s a very important quote. Keep it in mind.
A 2020 Ocean Conservancy-backed study quantified what “sweeping” means: a 40% reduction in global plastic production, waste management reaching 98 to 99% effectiveness in its collection and processing of plastic so it doesn’t reach nature, and annual cleanups of the 40% of plastic that still escapes into the environment — and that’s just to return to the 2010 leakage rates.
So that brings us to the elephant in the room — or maybe more to the point, the sperm whale with an entire greenhouse in its stomach — the global plastics treaty negotiations. Which were supposed to deliver a binding international agreement, collapsed in August 2025 in Geneva after oil-producing nations blocked provisions that called for production caps and toxic chemical phase-outs. More than 100 countries in the group known as the High Ambition Coalition were pushing for full life-cycle regulation for plastics, but the requirement that the negotiations reach a consensus gave a handful of petrochemical states an effective veto power. And effective it was.
So between the Busan round in late 2024 and the end of the Geneva talks in 2025, an estimated 7.4 million more metric tons of plastic entered the ocean. The world currently produces more than 460 million metric tons of plastic annually, and only 9% of that is being recycled. Every day, the equivalent of 2,000 garbage trucks of plastic is dumped into our oceans, rivers, and lakes.
However, the collapse of the treaty talks does not mean the end of progress. Erin pointed to evidence that targeted interventions can work. For example, communities in Hawaii conducted large beach cleanups and saw the Hawaiian monk seal population rebound. A study published in Science confirms that bag bans reduce plastic on beaches by between 25 and 47%. California’s SB 54 law aims to cut single-use plastics by 25%. And Ocean Conservancy’s International Coastal Cleanup, which is now in its 40th year, removed more than a million plastic bags from beaches last year. That cleanup data, collected by citizen scientists worldwide, is a research tool providing the time-series evidence that tells us whether policies are working.
So here’s what I want you to leave with from this conversation. Erin’s research focuses exclusively on acute mortality from ingested macroplastics — that’s obstruction, perforation, and torsion of the digestive tract. It does not capture the chronic effects of plastic and chemical exposure or entanglement, which her team will study next. That means the lethal thresholds that she reported likely underestimate the total harm plastic inflicts on marine life.
And the parallel crisis in human health is building from the same source of pollution, which has scattered microscopic shards of plastic across the planet, from the seas to the highest peaks. Most of these microplastics began as macroplastics, like those that are killing puffins and turtles. They break down in the environment into fragments small enough to enter our bloodstream, lungs, liver, and even women’s placentas. As Erin put it, it is all a part of the same crisis.
So one of the most encouraging things that Erin said was also the simplest. When strangers learn about what she studies, they stop and they tell her what they are doing to reduce their plastic footprint. That instinct to environmental stewardship is a real and powerful phenomenon, even if it’s currently being actively suppressed by governments. And the public’s will to protect nature is the foundation that policy, science, and investment will ultimately build on.
The ocean doesn’t need our sympathy. It needs a 40% cut in plastic production, waste systems that actually work, and the political will to treat a binding plastics agreement as a matter of human survival rather than an inconvenience for a few petrochemical companies. Until international negotiations deliver that agreement, the work continues at every other level: state legislatures, coastal cleanups, citizen science, and research programs like Erin’s that give decision makers the evidence-based targets that they’ve been asking for.
So stay tuned, folks, for more conversations about the solutions that can still turn this crisis around. And I hope you’ll take a moment to take a look at any of the more than 540 episodes of Sustainability In Your Ear in our archives. Take the time to share just one of them with your friends or your family. Writing a review on your favorite podcast platform will help your neighbors find us. Folks, you’re the amplifiers that can spread more ideas to create less waste. So please tell your friends, family, and co-workers they can find Sustainability In Your Ear on Apple Podcasts, Spotify, iHeartRadio, Audible, or whatever purveyor of podcast goodness they prefer.
Thank you all for your support. I’m Mitch Ratcliffe. This is Sustainability In Your Ear, and we will be back with another innovator interview soon. In the meantime, take care of yourself, take care of one another, and let’s all take care of this beautiful planet and its oceans. Have a green day.
The first Earth Day was celebrated on April 22, 1970 — 56 years ago — and, goodness, how the world has changed since then. We’ve come a long way since the days of burning our trash and pumping our gas guzzlers with leaded gasoline. In honor of those 56 years, here are 56 important changes and milestones since the first Earth Day.
Legislation
The U.S. government has led much of the environmental charge, starting with the implementation of the EPA (1) in July 1970. Later that year, the Clean Air A
The first Earth Day was celebrated on April 22, 1970 — 56 years ago — and, goodness, how the world has changed since then. We’ve come a long way since the days of burning our trash and pumping our gas guzzlers with leaded gasoline. In honor of those 56 years, here are 56 important changes and milestones since the first Earth Day.
Legislation
The U.S. government has led much of the environmental charge, starting with the implementation of the EPA (1) in July 1970. Later that year, the Clean Air Act (2) targeted air pollutants, followed by the Clean Water Act (3) in 1972 and the Endangered Species Act (4) in 1973.
Some lesser-known national laws included the Safe Water Drinking Act (5) in 1974, the Resource Conservation and Recovery Act (6) in 1976, the Toxic Substances Control Act (7) in 1976, the National Energy Act (8) in 1978, and the Medical Waste Tracking Act (9) in 1988.
In some cases, states have led the charge. Oregon passed the first bottle bill (10) in 1971, Minnesota’s Clean Indoor Air Act (11) was the first law to restrict smoking in public places (1975), and Massachusetts requiredlow-flush toilets (12) for construction and remodeling in 1988.
Green Innovations: The Early Years
In order to comply with all the laws from the 1970s, we needed new technology to ensure consumers could adhere to the new standards. Consider:
Cars begin displaying fuel economy labels in the mid-1970s (16)
In 1975, all cars are manufactured with catalytic converters to limit exhaust emissions (17)
Chlorofluorocarbons are banned from aerosol cans starting in 1978 (18)
The first curbside recycling program begins in New Jersey in 1980 (19)
In 1986, McDonald’s switches from foam to paper food containers (20)
Mercury is removed from latex paint in 1990, providing a viable alternative to banned lead paint (21)
Earth911 launches the first U.S. recycling directory in 1991 (22)
Energy Star certification debuts in 1992 for appliances and electronics (23)
The U.S. Green Building Council begins in 1993 (24)
The Political Movement
The Green Party (25) launched in 1984, which was just the beginning of green issues entering the mainstream. One Percent for the Planet (26) was founded in 2002 to challenge businesses to donate to environmental causes, and the ISO 14001 standard (27) established environmental management. Companies are now facing pressure to allow employee telecommuting (28).
Things really developed after the release of Al Gore’s An Inconvenient Truth (29) in 2006. NBC debuted Green Week (30) in 2007. Carbon offsets (31) alleviated corporate green guilt. Bisphenol A (32) made us all question plastic purchases. Hybrid vehicles (33) generated tax credits and gas savings. Plastic bag bans gave rise to a reusable bag (34) craze. Fracking (35) and the Dakota Access Pipeline (36) were two of the most hotly contested news stories of the decade, at least until the 2016 election.
Green Tech: The Next Wave
In the past 10 years, emerging green tech has made eco-friendly a way of life, including:
LED light bulbs (37)
Portable solar panels on backpacks and watches (38)
President Biden rejoins the Paris Climate Accord on his first day in office. (51)
The Latest Five: 2022–2026
The pace of innovation has not slowed. Five more milestones have reshaped the environmental landscape since that 51st Earth Day:
The Inflation Reduction Act (52), signed into law in August 2022, became the largest climate investment in U.S. history, directing roughly $370 billion toward clean energy tax credits, EV incentives, methane reduction, and domestic clean manufacturing. Analysts projected it will drive more than $4 trillion in cumulative capital investment over a decade and put the U.S. on track for a 40% emissions reduction by 2030. Sadly, many of its key provisions have been defunded or eliminated by the Trump Administration.
The Kunming-Montreal Global Biodiversity Framework (53), adopted by 188 governments in December 2022, set the most ambitious biodiversity protection commitment in history. Its headline “30×30” target calls for conserving 30% of the planet’s land, freshwater, and ocean areas by 2030, a goal that would require doubling current protected land coverage and quadrupling marine protections.
America’s first commercial direct air capture plant (54), opened by Heirloom Carbon Technologies in Tracy, California in November 2023, marked the arrival of atmospheric carbon removal at commercial scale on U.S. soil. The plant uses limestone to absorb CO₂ directly from the air, with the captured carbon injected into concrete for permanent storage. In May 2024, Climeworks activated the world’s largest direct air capture facility, the Mammoth plant in Iceland, with a design capacity to remove 36,000 tons of CO₂ per year.
Solid-state batteries (55), a next-generation alternative to conventional lithium-ion technology, moved from laboratory promise toward commercial reality between 2022 and 2026. Unlike liquid-electrolyte batteries, solid-state versions are less flammable, achieve higher energy density, and degrade more slowly. In early 2025, Mercedes-Benz began road-testing a prototype EV powered by a lithium-metal solid-state cell that extended driving range 25% over comparable liquid-battery models. Multiple automakers and cell manufacturers now target commercial production between 2027 and 2030.
Perovskite and tandem solar cells (56), a new photovoltaic technology that pairs conventional silicon with thin perovskite layers, pushed solar efficiency into territory once considered theoretical. By 2024, tandem cells in laboratory settings exceeded 34% efficiency — well above the roughly 22% ceiling of standard silicon panels only a few years ago. manufacturers in Asia and Europe began scaling pilot production lines. Because perovskite cells can be printed on flexible substrates, they open the door to solar surfaces on buildings, vehicles, and everyday objects that conventional panels cannot reach.
The past 56 years have been huge when it comes to saving the environment. Expect more to come, including a resurgent EV industry, nuclear fusion, regenerative agriculture, restorative forestry, and more, as costs and the cool factor improve.
Editor’s Note: Originally published on April 18, 2018, this article was most recently updated in April 2026.
Nevada just shattered its March statewide high temperature record by 6 degrees, which is a ‘72 miles per hour in a school zone’ kind of margin. And it happened during the hottest 11-year stretch in 176 years of recorded temperature tracking.
A mid-March heat wave in the American West pushed temperatures in Laughlin, Nevada, to 106°F, far above the previous March record of 100°F. The fact that this happened in March is alarming, especially since it coincided with a near-total collapse of the regi
Nevada just shattered its March statewide high temperature record by 6 degrees, which is a ‘72 miles per hour in a school zone’ kind of margin. And it happened during the hottest 11-year stretch in 176 years of recorded temperature tracking.
A mid-March heat wave in the American West pushed temperatures in Laughlin, Nevada, to 106°F, far above the previous March record of 100°F. The fact that this happened in March is alarming, especially since it coincided with a near-total collapse of the region’s snowpack. This sets the stage for an early and possibly severe wildfire season. The heat also fits a troubling trend confirmed by the World Meteorological Organization last week: 2015 through 2025 have been the 11 warmest years ever recorded on Earth.
Usually, temperature records are broken by small amounts. What happened in Nevada last month was very different. Some places broke monthly high temperature records by as much as 8 degrees. Reno had seven days above 80°F in March, compared to the previous record of just two days. “It’s not just that we broke monthly records,” said Nevada State Climatologist Baker Perry, “but it’s by how much we broke the monthly records, and not just in one place.”
A Snow Drought That Wasn’t in the Forecast
The heat wave didn’t hit a typical winter landscape. Nevada was already experiencing what Perry calls an unprecedented snow drought. Even though winter precipitation was close to normal and there were big storms in mid-February, warm, moist air arrived soon after. This caused what the National Weather Service called the second-highest single-day snowmelt ever recorded in the eastern Sierra, only surpassed by flooding in 1997.
Normally, snow melts slowly through April and May, but this year it happened all at once in late February and early March. SNOTEL monitoring stations across Nevada show the impact clearly: 70% of sites in northern and central Nevada now report zero inches of snowpack. That’s not just low—it’s gone. The incidence of drought is closely correlated with rising atmospheric CO2 levels recorded at the Mauna Loa Observatory in Hawaii, which is threatened with defunding by the Trump Administration.
Atmospheric CO2 levels from 2021 to 2026. Source: N.O.A.A.
What worries scientists most is the combination of these events. “To have these two unprecedented, exceptional events happening at once is a combination that is particularly concerning,” Perry said.
What This Means for Fire Season
Wildfire risk isn’t only about heat. It depends on the sequence of conditions leading up to fire season, and this year’s setup is especially dangerous.
The snowmelt and early rains caused plants to grow weeks ahead of schedule. This early growth creates lots of fine fuels. As these plants dry out over the spring—now with less moisture from snowpack—they become the kindling that can fuel fast-moving fires.
Truckee Meadows Fire Protection District Division Chief August Isernhagen said the early green-up could lead to conditions we haven’t seen before as fire season approaches. He urged people to be even more careful than in recent drought years.
“The majority of our starts, and nearly all of our catastrophic fires are human caused,” Isernhagen said in a statement from the University of Nevada, Reno.
Mountain forests face another challenge. Dawn Johnson, Warning Coordination Meteorologist at the NWS in Reno, explained that losing snowpack this early means heavy timber can become drought-stressed much sooner than usual, turning it into a fire hazard months earlier than normal. A cooler storm pattern expected in early April might bring some relief, but experts warn it may be too little, too late to make a real difference.
Eleven Years. No Exceptions.
The Nevada heat wave wasn’t an isolated event. It happened during the longest stretch of global heat ever recorded.
The WMO’s State of the Global Climate 2025 report, released on March 23, confirmed that every year from 2015 to 2025 is among the hottest ever recorded. Depending on the data, 2025 was either the second- or third-warmest year since records began, with temperatures about 1.43°C above pre-industrial levels. Atmospheric CO₂ reached its highest level in 2 million years, and ocean temperatures set a new record for the ninth year in a row.
UN Secretary-General António Guterres put the streak in stark terms: “When history repeats itself eleven times, it is no longer a coincidence. It is a call to act.”
The report also introduced a new measure called Earth’s energy imbalance (EEI). This tracks the difference between the energy the planet receives from the sun and the energy it sends back into space. In 2025, EEI was at its highest since records began in 1960. Surface temperatures, which get most of the attention, only show about 1% of the planet’s extra heat. Over 91% is absorbed by the oceans, which have taken in the equivalent of about 18 times the world’s total annual energy use each year for the past 20 years. EEI gives a clearer picture, showing that the planet is becoming more out of balance.
“In 2025, heatwaves, wildfires, drought, tropical cyclones, storms and flooding caused thousands of deaths, impacted millions of people and caused billions in economic losses,” said WMO Secretary-General Celeste Saulo. She added that the changes driven by human activities “will have harmful repercussions for hundreds — and potentially thousands — of years.”
What’s happening in the Western U.S. matches the WMO’s global findings perfectly. The report highlighted major glacier loss in 2025 along North America’s Pacific coast. These events aren’t separate—they’re both signs of the same warming trend, just showing up in different ways and times.
“We seem to be entering this new era where temperatures will be significantly higher than what they were ten years ago,” said climate scientist Sarah Perkins-Kirkpatrick of Australian National University. She explained that the changes of the past three years can only be explained by climate change.
What About the Cold in the East?
This is where things get both surprising and important.
If you live in the Northeast, Midwest, or Southeast, 2025 might not seem like a record-warm year. Some parts of the eastern U.S. have had cold snaps and severe winter weather that made national news. So how does that fit with 11 straight years of record global heat?
This actually makes sense in climate science. Climate change doesn’t warm every place at the same time. Instead, it disrupts atmospheric patterns like the polar vortex, which usually keeps cold air over the Arctic. As the Arctic warms much faster than the rest of the planet—about four times the global average, according to NOAA—the polar vortex weakens and shifts, letting cold air move into areas that don’t usually get it.
In other words, the same forces causing record heat in Nevada are also behind the unusual cold in the eastern U.S. These aren’t opposites—they’re both results of a destabilized climate system. Weather feels local, but our climate is shared. When the West is hot in March and the East is cold, both are signs of the same disrupted system.
Lower the risk of starting fires. Most wildfires are caused by people, so be extra careful during high-risk times. Don’t have campfires during bans, avoid dragging chains on your vehicle or trailer, and make sure your equipment doesn’t create sparks.
Support climate policy at both the state and federal levels. Reach out to your Congressional representatives. The WMO data shows the trend is clear. The decisions we make now will shape how severe fire seasons are in the future.
Cut your home’s carbon footprint by using energy efficiently, choosing cleaner transportation, and making changes to your diet. One person’s actions won’t solve the global problem, but when many people make changes, it can have a real impact on emissions.
If you live in the eastern U.S., don’t let cold winters make you ignore climate data. Pay attention to what’s happening across the country—the same atmosphere connects us all.
Nine million tons of carbon dioxide equivalent. That is the projected climate cost of the 48-team, three-country, 16-city soccer tournament that kicks off June 11 in Mexico City — nearly double the average emissions of every World Cup held between 2010 and 2022.
The figure comes from a peer-reviewed analysis published by Scientists for Global Responsibility, the Environmental Defense Fund, Cool Down, the Sport for Climate Action Network, and the New Weather Institute. Their conclusion: FIFA’s de
Nine million tons of carbon dioxide equivalent. That is the projected climate cost of the 48-team, three-country, 16-city soccer tournament that kicks off June 11 in Mexico City — nearly double the average emissions of every World Cup held between 2010 and 2022.
The figure comes from a peer-reviewed analysis published by Scientists for Global Responsibility, the Environmental Defense Fund, Cool Down, the Sport for Climate Action Network, and the New Weather Institute. Their conclusion: FIFA’s decision to expand the tournament and spread it across a continent has locked in a climate footprint that no amount of host-city recycling or LED lighting can offset.
Which makes the question of which host cities are doing serious sustainability work more important, not less. Their practices will outlast the tournament.
The Problem Is Structural
World Cup-related team air travel will account for roughly 7.7 million tons of CO2-equivalent — about 85% of the total, according to the SGR analysis. That is the direct consequence of two FIFA decisions. First, the tournament grew from 32 to 48 teams and from 64 to 104 matches. Second, FIFA chose to hold those matches across Canada, Mexico, and the United States rather than concentrate them in a single region.
The contrast with the previous tournament is stark. Qatar 2022 kept its eight stadiums within 34 miles of each other. The shortest distance between 2026 stadiums, from MetLife in New Jersey to Lincoln Financial Field in Philadelphia, is 95.5 miles. Most teams’ itineraries cover thousands of miles. One UEFA playoff winner, according to a Fossil Free Football analysis, could travel Toronto to Los Angeles (2,175 miles), then Los Angeles to Seattle (932 miles), then, in the knockout rounds, another 2,500 miles to Boston.
FIFA does not set binding emissions limits for host cities, and it did not address the underlying decision to spread the tournament across North America. SGR’s researchers urged FIFA to reverse the team expansion, set mandatory environmental standards, and end sponsorship deals with high-emitting companies, including the Saudi oil company Aramco, whose sponsorship is estimated to result in an additional 30 million tons of CO2e due to energy sales linked to the tournament’s promotion.
The Heat Risk Nobody Planned For
Climate change is not just an abstraction measured in tournament emissions. It is a condition players and fans will experience in real time. The SGR/EDF report assessed heat, flooding, and extreme weather risk at all 16 stadiums. Six face extreme heat stress due to Wet Bulb Globe Temperatures above 80°F, the threshold where exertion becomes dangerous. Eight of the 16 cities require what the researchers called immediate environmental intervention. Four need critical intervention, according to the report.
AT&T Stadium in Arlington, Texas, which will host nine World Cup matches — more than any other venue — experiences 37 days per year above 95°F, with July wet bulb readings that exceed FIFA safety thresholds.
Houston’s NRG Stadium faces simultaneous heat, flooding, and wildfire risk.
Los Angeles contends with wildfire smoke.
Miami faces hurricanes.
Where Host Cities Lead, and Where They Lag
A sustainability ranking published by World Sports Network in April 2026 attempts to score the 16 host cities across transit access, electric vehicle infrastructure, waste, air pollution, urban greening, and greenhouse gas emissions. The methodology has limits — it weights all factors equally, uses stadium-specific data alongside city-wide data, and includes some questionable proxies — but its directional finding is consistent with what urban sustainability researchers have long documented about the climate in North American cities.
Vancouver tops the rankings. British Columbia generates roughly 95% of its electricity from renewable sources, largely hydropower. BC Place sits in the center of Vancouver, with 26 public transit stops within a 10-minute walk. Fans can reach it by SkyTrain or bus. That single design decision eliminates most of the vehicle trips and parking-lot sprawl that define a typical U.S. stadium day.
Boston ranked second, the highest-scoring U.S. city. That is less about inherent greenness than about what severe flooding has forced the city to prepare for. Boston experienced 19 days of flooding in 2024, and sea levels around the city are projected to rise 20 centimeters by 2030 relative to 2000. The city’s Building Emissions Reduction and Disclosure Ordinance requires large buildings to cut emissions to net zero by 2050, with interim targets that have already tightened performance at Gillette Stadium’s surrounding infrastructure.
Mexico City placed third, Toronto fourth, Monterrey fifth. The pattern shows that four of the top five cities are outside the United States, even though 11 of the 16 host cities are American. Mexico City’s transformation from one of the most polluted major cities in the world into one of the Americas’ most active urban reforesters, with over 27 million trees and plants added between 2018 and 2021, is the kind of long-horizon work that does not fit inside a tournament timeline but shapes what that timeline makes possible.
The American Transit Problem
Every U.S. host city except Boston falls in the bottom half of the WSN ranking, and the reason is almost always the same: transit.
AT&T Stadium in Arlington has no public transit stops within a 10-minute walk. Hard Rock Stadium in Miami, which will host seven matches, sits 17 miles north of downtown Miami with no rail connection. SoFi Stadium in Inglewood, MetLife in East Rutherford, and NRG in Houston all require a car, a shuttle, or a rideshare for most attendees.
Dallas-Fort Worth is ranked third in the world for transportation-related greenhouse gas emissions, a structural problem no single event can fix. The Dallas organizing committee has built a sustainability plan in collaboration with the University of Texas at Arlington’s chief sustainability officer, Meghna Tare. It addresses waste management, single-use plastic reduction, composting, and community legacy. The North Central Texas Council of Governments has designed a charter bus system to fill the transit gap for the nine matches AT&T Stadium will host. These are real efforts. They also show that when infrastructure is car-dependent, event-specific workarounds can reduce harm but don’t substitute for the public transit that does not exist.
What This Means Beyond the Tournament
The 2026 World Cup will be a 34-day event watched by a projected 5 million in-person fans and up to 6 billion viewers worldwide. The emissions it generates will dissipate into an atmosphere that cannot tell tournament carbon from commuting carbon. What will persist are the infrastructure choices each host city makes now, including whether transit lines are extended or not, stadium renovations that meet LEED standards or do not, food recovery programs that continue operating after the final match or get packed away with the branded signage.
These are not reasons to hate world football. It’s the Beautiful Game, and its governing body, FIFA, can make changes to reduce the tournament’s impact and protect players from heat-related injuries.