Reading view

As the Coal Industry Fades, Life Expectancies in Coal Country Shift

A foggy mountain scene at sunset. In the right-hand corner, a railroad leading to a small building can be seen.

The coal industry can damage human health in myriad ways via dangerous working conditions and harmful pollution. But the income opportunities offered by the industry can also provide much-needed stability for certain communities, such as those in Appalachia’s coal country.

“Being employed is good for your health, but environmental pollution is bad for your health, and these two things are operating at the same time in some communities,” said Mary Willis, an epidemiologist at Boston University.

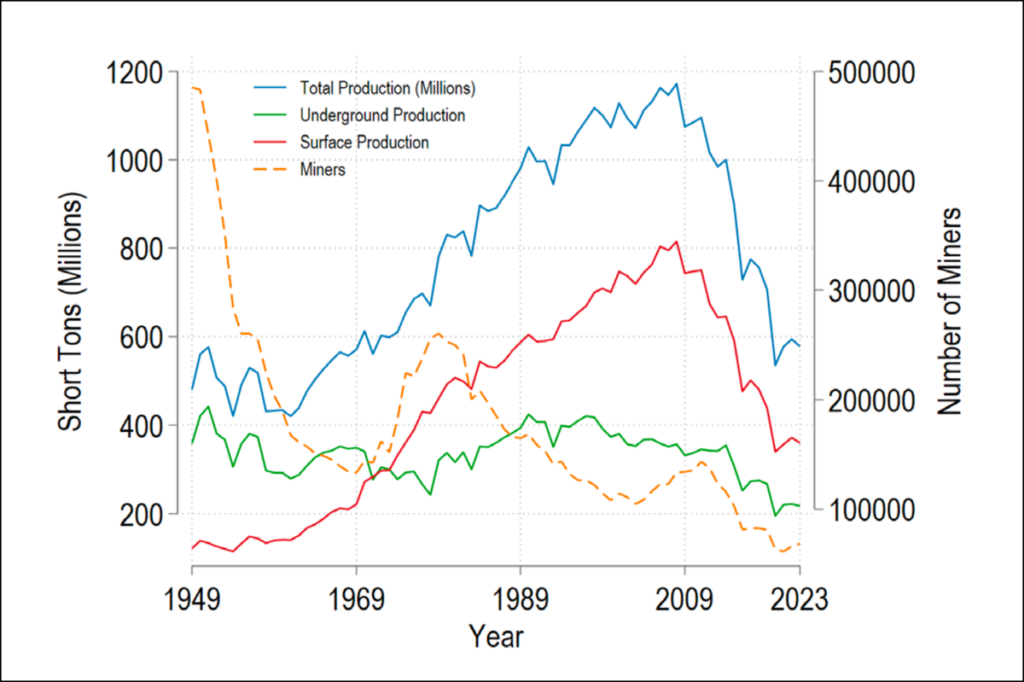
The industry, though, is changing. Total coal production in the United States peaked in 2008, and the number of miners has steadily dropped since then.

A graph shows total, underground, and surface production of coal in millions of short tons alongside the number of coal miners from 1949 to 2023.
Total coal production peaked in the United States in 2008, after which the number of coal miners declined, too. Credit: Thombs et al., 2026, https://doi.org/10.1111/ruso.70034, CC BY 4.0

A new study coauthored by Willis and published in Rural Sociology delves into the effects of this decline on life expectancies across the United States and in Appalachia in particular. The results show that a disappearing coal mining industry has mixed effects on health, highlighting the importance of a “just transition”—a shift away from coal mining and toward clean energy that also prioritizes decent work opportunities for those left without a job.

“How do we balance these two conflicting priorities?” Willis said.

Delving into the Decline

Coal production and consumption are linked to many human health harms, including heart disease, asthma, lung cancer, mental illness, and more. But how those health impacts intersect with the broader economic effects of mining has not been well studied.

In the new study, the research team analyzed the effects of the declining industry through the lens of the social determinants of health, or how social structures influence health outcomes.

A table shows the life expectancy outcomes of the effects of three pathways by which coal mining impacts health.
Researchers analyzed how coal mining impacts life expectancies via three pathways: production, mining labor time, and employment. Credit: Thombs et al., 2026, https://doi.org/10.1111/ruso.70034, CC BY 4.0

To study these effects, the team compared coal mining data from the U.S. Energy Information Administration to life expectancy data from the Institute for Health Metrics and Evaluation at the University of Washington from 2012 to 2019. Life expectancy is a metric that can be responsive to subtle changes in the environment, Willis explained. For example, the decommissioning of a coal-fired power plant a few miles away from a community may not affect residents’ day-to-day life but probably affects the scale of life expectancy across the population.

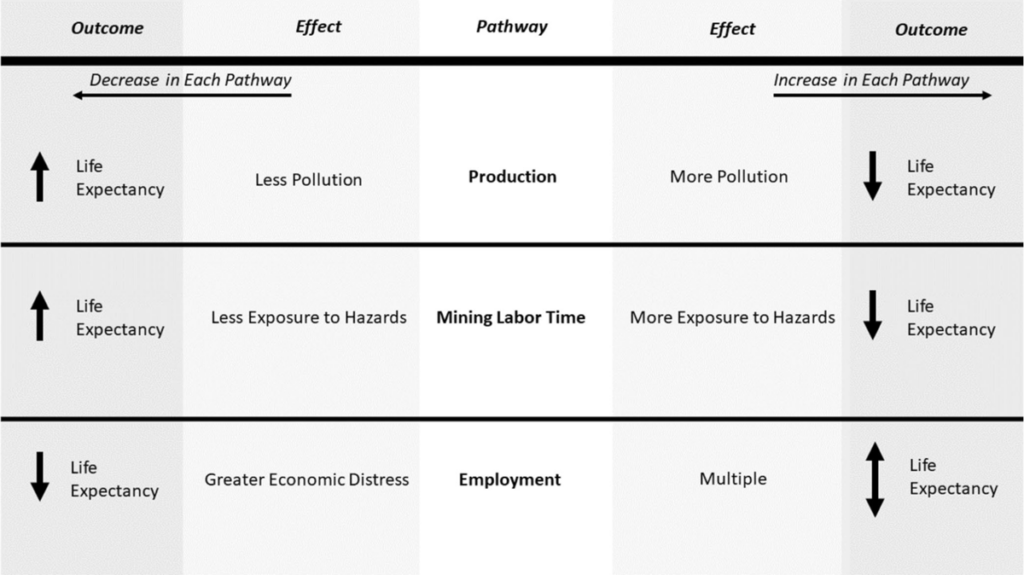
In coal-producing counties across the United States, the average life expectancy was 1.6 years lower than that in non-coal-producing counties. But the declining coal industry had more nuanced impacts on health in Appalachian communities, the researchers found. As coal production fell and miner labor hours decreased, life expectancy increased. But as the number of jobs available decreased, life expectancy decreased, too.

The findings suggest that the employment and associated economic impacts of a waning coal industry harm health. Previous studies documented similar increases in mortality in other regions where the fossil fuel industry has declined. Such research has indicated that these increased mortality rates may be partially driven by “deaths of despair” from drug and alcohol use and suicide related to economic distress. The association of these factors with mortality rates in coal country, the authors suggest, may be an area for future study.

Understanding that coal mining is associated with some positive economic and health effects is “an important perspective for understanding the sector as a whole,” said Lucas Henneman, an environmental engineer at George Mason University who was not involved in the new study. “It’s a really interesting piece of work.”

“This is just a really complex story that hasn’t been told yet—putting health into the context of these just energy transitions,” Willis said.

The complex reality of the coal industry extends beyond Appalachia. Most of the pollution related to the coal industry consists of toxins released when coal is burned, meaning those who bear the brunt of coal’s health impacts may not be located where coal is mined, Henneman said.

In fact, a 2023 study by Henneman and others found that before 2009, a quarter of all air pollution–related deaths of people on Medicare were attributable to coal burning. From 2013 to 2020, that number dropped to 7%, alongside a drop in coal consumption. A complete picture of how the coal industry affects health should also consider how pollution travels beyond coal country—where it’s burned, how it’s transported in the air, and who ultimately breathes it in, he said.

A Just Transition

“The question is how to provide [jobs] in a way that provides the same level of stability, same kind of income benefits, and isn’t too much of a shock to [communities’] way of life or sense of identity.”

The economic activity of a mine, through direct employment as well as businesses reliant on the mine and miners, “chases away other opportunities,” making the mine the economic backbone of the area, said Jonathan Buonocore, an environmental health scientist at Boston University and a coauthor of the new study. The concept of a just transition aims to ensure that employment opportunities in the wake of the coal industry’s decline reach these communities.

“The question is how to provide [jobs] in a way that provides the same level of stability, same kind of income benefits, and isn’t too much of a shock to [communities’] way of life or sense of identity,” Buonocore said.

—Grace van Deelen (@gvd.bsky.social), Staff Writer

Citation: van Deelen, G. (2026), As the coal industry fades, life expectancies in coal country shift, Eos, 107, https://doi.org/10.1029/2026EO260134. Published on 30 April 2026.
Text © 2026. AGU. CC BY-NC-ND 3.0
Except where otherwise noted, images are subject to copyright. Any reuse without express permission from the copyright owner is prohibited.
  •  

Trump Terminates Entire National Science Board

Silhouettes of people in lavender and periwinkle stand, some overlapping, on a aubergine-colored background. Overlying the image at the bottom is the text “R&D Research and Developments.”

Research & Developments is a blog for brief updates that provide context for the flurry of news regarding law and policy changes that impact science and scientists today.

The Trump Administration has terminated the positions of every member of an independent board meant to govern the National Science Foundation (NSF).

The National Science Board directs and approves large funding decisions for NSF’s approximately $9 billion basic science research budget. It is meant to function independently from the federal administration to keep science funding insulated from political pressure and budget cycles.

“I have watched the systematic dismantling of the scientific advisory infrastructure of this government with growing alarm, and the National Science Board is simply the latest casualty.”

In a 24 April notice from the Presidential Personnel Office, all the scientists serving on the board were informed their positions had been eliminated. The emails dismissing board members provided no reason for the termination.

“I am deeply disappointed, though I cannot say I am entirely surprised,” Willie E. May, one of the terminated board members and vice president of research and economic development at Morgan State University in Maryland, told The New York Times

“I have watched the systematic dismantling of the scientific advisory infrastructure of this government with growing alarm, and the National Science Board is simply the latest casualty,” he said. 

Ranking member of the House Committee on Science, Space, and Technology Zoe Lofgren (D-CA) called the terminations “the latest stupid move made by a president who continues to harm science and American innovation.”  

The terminations come after a year that shocked higher education and research budgets. Last year, NSF granted 51% less funding to scientists than the 2015-2024 average and terminated hundreds of active grants. Last May, the Trump administration proposed cutting $5 billion from NSF’s budget, though the proposal was rejected. The president’s budget request for fiscal year 2027 once again proposes to reduce the foundation’s budget by more than half. In a February 2026 meeting of the National Science Board, NSF leadership said the foundation was seeking to reduce grant solicitations.

The Trump administration has also restructured scientific advisory groups elsewhere in the federal government, eliminating 152 federal advisory committees at science agencies, merging all of the Department of Energy’s advisory committees into one and dismantling the Environmental Protection Agency’s research office.

“Without a functional National Science Board in the near term, the agency is left without the guidance and oversight of independent experts, and the public is left without information on how NSF is carrying out its mission,” Gretchen Goldman, president and CEO of the Union of Concerned Scientists, wrote in a blog post about the terminations. 

—Grace van Deelen (@gvd.bsky.social), Staff Writer

These updates are made possible through information from the scientific community. Do you have a story about how changes in law or policy are affecting scientists or research? Send us a tip at eos@agu.org.

A photo of a hand holding a copy of an issue of Eos appears in a circle over a field of blue along with the Eos logo and the following text: Support Eos’s mission to broadly share science news and research. Below the text is a darker blue button that reads “donate today.”
Text © 2026. AGU. CC BY-NC-ND 3.0
Except where otherwise noted, images are subject to copyright. Any reuse without express permission from the copyright owner is prohibited.
  •  

Temperatures in Nearly All Major U.S. Cities Have Warmed Since First Earth Day

A map of the United States shows which states have warmed the most since 1970. Alaska, New Jersey, New Mexico, Delaware, Massachusetts, and Vermont are the six fastest-warming states.

Research & Developments is a blog for brief updates that provide context for the flurry of news that impacts science and scientists today.

After more than half a century of Earth Days, one planetary challenge—climate change—threatens our planet more than ever.

In 1970, the year Sen. Gaylord Nelson (D-Wisc.) organized the first Earth Day events, the annual average concentration of carbon dioxide in the atmosphere was 326 parts per million. In 2025, it was 31% higher, at 427 parts per million. 

“It may sound small, but it’s reshaping daily life.”

Changes in average annual temperatures in U.S. cities and states show the powerful effects of this increase in heat-trapping carbon dioxide. A new analysis, published today by climate research and communications nonprofit Climate Central, found that since 1970, all 50 states and 99% of major U.S. cities have warmed, with an average city-level increase of 1.6°C (2.9°F).

“It may sound small, but it’s reshaping daily life,” Shel Winkley, a meteorologist at Climate Central, said in a video released alongside the report. 

On average, the 49 U.S. states analyzed in the report have warmed by 1.7°C (3.0°F) since 1970. The six states that have warmed the fastest since the first Earth Day are Alaska with a 2.4°C (4.4°F) increase, New Jersey and New Mexico with a 2.1°C (3.7°F) increase, and Delaware, Massachusetts, and Vermont with a 2°C (3.6°F). Trends for Hawaii, which were analyzed separately and not included in the national average, also showed statewide warming.

In 2025, the United States was on average 1.4°C (2.6°F) warmer than the 20th century average. The Paris Agreement, a legally binding global treaty, sets a goal to limit warming to 1.5°C (2.7°F) above preindustrial levels, though some scientists expect that the world has already entered the period of time during which this limit will be breached.

A graph shows how much Reno, Nevada, and the United States have warmed since 1970. Reno has warmed 7.9 degrees Fahrenheit, Nevada has warmed 3 degrees, and the United States has warmed 2.9 degrees.
Warming is occurring much faster in some cities than in their respective states, or than the United States as a whole. Check out your city’s data in the Climate Central report. Credit: Climate Central, CC BY 4.0

Warming trends in the United States are most pronounced in the Southwest, where cities have warmed an average of 1.9°C (3.5°F) since 1970. And in some cases, cities are warming much faster than whole states. Three of the five cities that have warmed the fastest since 1970 are in the Southwest: Reno, Nev., with an increase of 4.4°C (7.9°F), Las Vegas, with an increase of 3.3°C (6.0°F), and El Paso, Texas, with an increase of 3.3°C (5.9°F). 

The effects are evident at the national, state, and local levels. Temperatures have warmed in 240 of the 242 cities analyzed by Climate Central. Harrisonburg, VA and Monterey, CA were the only two cities analyzed that have not warmed since 1970.

The report highlights some good Earth Day news, however, and points out that solar and wind power generation is at an all-time high in the United States, accounting for 19% of the electricity generated in the country in 2025 despite those industries facing recent headwinds from the federal administration. 

“Every fraction of a degree [of warming] that we prevent does matter, for our health, for our communities, and for the world that we’re passing on to the next generations,” Winkley said. 

—Grace van Deelen (@gvd.bsky.social), Staff Writer

These updates are made possible through information from the scientific community. Do you have a story about science or scientists? Send us a tip at eos@agu.org.

A photo of a hand holding a copy of an issue of Eos appears in a circle over a field of blue along with the Eos logo and the following text: Support Eos’s mission to broadly share science news and research. Below the text is a darker blue button that reads “donate today.”
Text © 2026. AGU. CC BY-NC-ND 3.0
Except where otherwise noted, images are subject to copyright. Any reuse without express permission from the copyright owner is prohibited.
  •  
❌