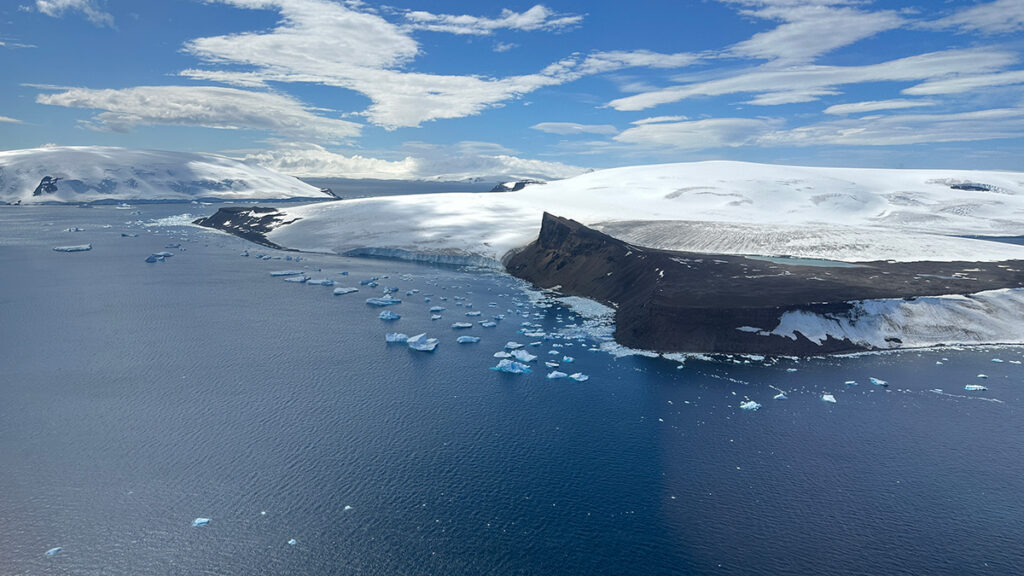
Today, the Antarctic Circumpolar Current transports more than 100 times as much water as all of Earth’s rivers combined and, critically, insulates the Antarctic Ice Sheet from heat at lower latitudes. A clear picture of the origins of this current can help scientists further understand the relationships between contemporary ocean dynamics, the global climate, and ice formation in Antarctica.
“It’s very interesting to learn more about this current, how it developed, and what role it played in the climate change that was happening at that time,” said Hanna Knahl, a paleoclimatologist and doctoral student at the Alfred-Wegener-Institut in Germany and lead author of the new study.
The Birth of a Current
About 34 million years ago, Earth was undergoing a climatic shift, now known as the Eocene-Oligocene transition, during which atmospheric carbon dioxide decreased and the planet cooled.
Earth’s tectonic plates in the Southern Ocean moved away from each other, opening and deepening bodies of water such as the Tasmanian Gateway and the Drake Passage, which separate Antarctica, Australia, and South America.
For years, scientists hypothesized that the alignment of these newly formed waterways, along with westerly winds, could have channeled ocean water and spurred the formation of the Antarctic Circumpolar Current.
“The exact position of the westerly winds and their relative position to the [ocean] gateways have to click together.”
To test that hypothesis, Knahl and her colleagues simulated conditions of the early Oligocene Southern Ocean with a coupled model that included ocean dynamics, atmosphere and wind patterns, temperatures, ice sheet growth, and precipitation. The research team compared these simulations to data from actual Antarctic sediment cores and scans of the ocean floor.
Results confirmed that westerly winds were necessary for the Antarctic Circumpolar Current to form.
“The exact position of the westerly winds and their relative position to the [ocean] gateways have to click together,” Knahl said.
Joanne Whittaker, a marine geophysicist at the University of Tasmania who was not involved in the new study, was a coauthor of a 2015 study that proposed westerly wind alignment played a role in the formation of the current. Knahl’s study presents a more sophisticated model of the early Oligocene Southern Ocean and is a great next step in the investigation of the current’s origins, Whittaker said.
“They did a really nice job of taking a range of different people’s work and linking it all together,” she said.
Oligocene Understandings
“If you can have a model that works in the past, it’s going to give you confidence that it’s going to work for the future, as well.”
Scientists often use Earth’s past behavior to better understand how Earth systems may behave in the present or future. “If you can have a model that works in the past,” Whittaker explained, “it’s going to give you confidence that it’s going to work for the future, as well.”
The Eocene-Oligocene transition is a key to understanding the relationship between atmospheric carbon, ocean dynamics, and the glaciation of Antarctica, Whittaker said. Knowing how the current’s behavior affected carbon uptake millions of years ago helps scientists model how the present current’s behavior might also affect atmospheric carbon.
In addition to carbon uptake, the new research hints at how changes in westerly winds may influence the advance and retreat of the Antarctic Ice Sheet. Some modeling and proxy data indicate the westerly winds that spurred the Antarctic Circumpolar Current’s formation 34 million years ago have shifted in the past century and may continue to shift in the future. Understanding the role these winds initially played in the current’s development may shed light on the current’s present ability to guard the Antarctic Ice Sheet from warmer air masses.
There are still Oligocene patterns that require more research to sort out, though. For example, modeling in the new study showed interesting asymmetries in the timing of the development of different parts of the Antarctic Circumpolar Current, Knahl said. Scientists know from proxy data and modeling that similar asymmetry exists in the history of the Antarctic Ice Sheet; the ice sheet in East Antarctica began to form about 7 million years before the ice sheet began to form in West Antarctica.
“It could be interesting to see if there’s a connection between the asymmetries that we see here,” Knahl said. “Are they linked, or were they more or less independent?”
Citation: van Deelen, G. (2026), Widening channels and westerly winds together formed Earth’s strongest current, Eos, 107, https://doi.org/10.1029/2026EO260126. Published on 24 April 2026.
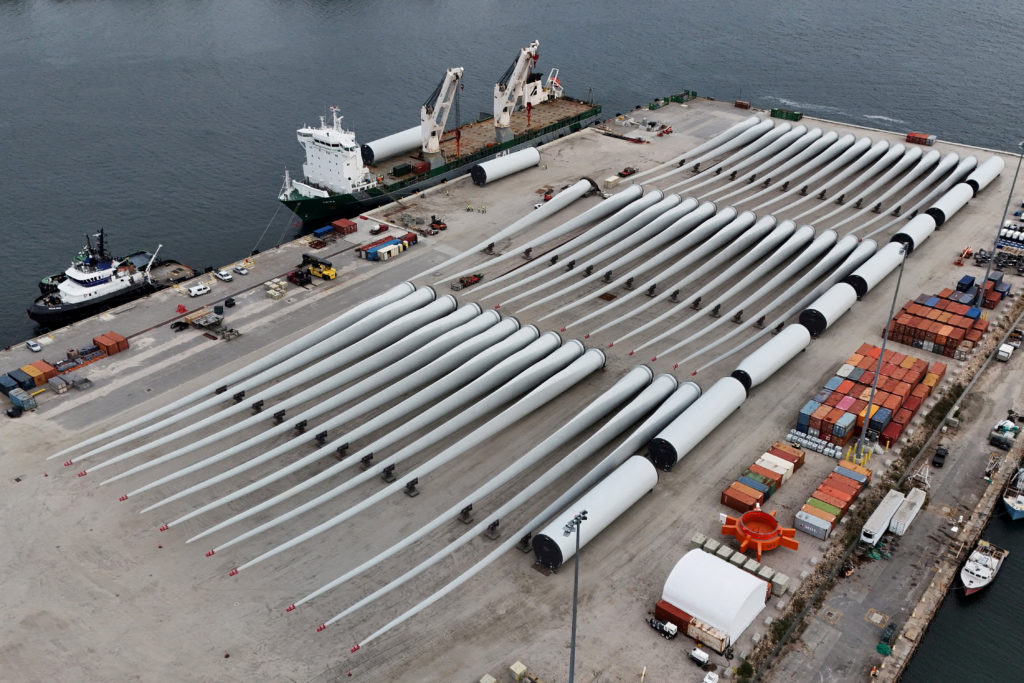
The federal goverment is giving French company TotalEnergies $1 billion — essentially a refund of its leases for offshore wind projects off New York and North Carolina — if it invests the money in fossil fuel projects instead.
Wind-driven waves on Earth move sediments and shape shorelines. They transport energy between the atmosphere and planetary surface and also mix bodies of liquid, affecting both chemistry and biology. On other worlds with surface liquids, either now or in the past, wind waves would likely perform the same function and so would play a key role in climate and astrobiological potential.
“They’re basically the interface between how the atmosphere communicates with the landscape, especially at the coast.”
New research went back to the fundamentals and explored the conditions that can generate waves on worlds with different physical properties and different liquids, such as Titan, Mars, and select exoplanets.
“Wind waves are really interesting phenomena,” said Una Schneck, a planetary science doctoral student at the Massachusetts Institute of Technology (MIT) in Cambridge. “They’re basically the interface between how the atmosphere communicates with the landscape, especially at the coast.”
The Physics of Waves
Past models of wind generation on other planets struggled because they tended to start from preexisting models of Earth waves. Those models were developed to describe waves in Earth’s specific combination of gravity, atmosphere, and surface liquid, namely, water, said Schneck, who led the new research. Such models were sometimes tailored to describe a particular location and season. Adapting those models for conditions on other worlds, including other liquids like methane and sulfuric acid, always seems to leave traces of Earth behind.
However, the physics of what creates wind-driven waves should be universal, Schneck said, so the team went back to the basics of wave generation. They developed a wave model that explores the relationship between a world’s bulk properties, like gravity and air density, and liquid properties, like surface tension, to determine the wind strength needed to produce a wave.
The team “created this model that went back to the basic physics of waves, instead of just trying to fit to known wave conditions,” said Taylor Perron, an MIT geomorphologist and planetary scientist and coauthor of the research.
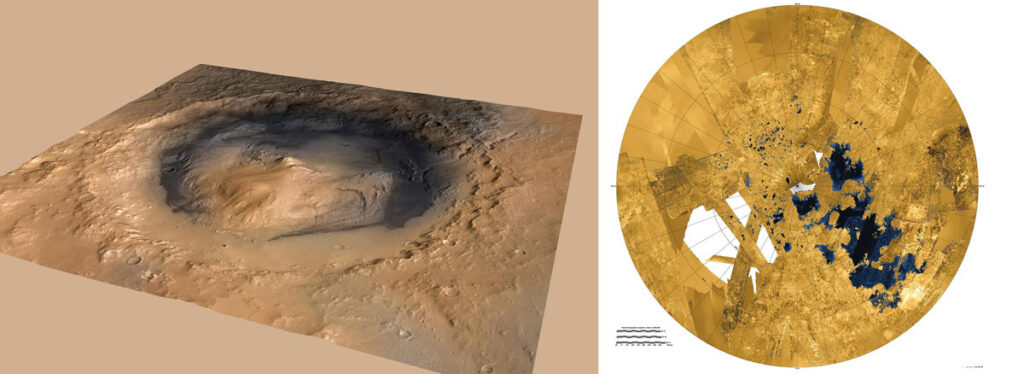
The Curiosity rover landed in Gale Crater on Mars (left) and has since found evidence—wavy bedforms—that this former crater lake had waves. Titan’s northern hemisphere hosts a sprawling lake district (right). The shores of one of the moon’s largest bodies of liquid, Ligeia Mare, shows evidence of wave activity. Credit: Left: NASA/JPL-Caltech/ESA/DLR/FU Berlin/MSSS; right: NASA/JPL-Caltech/ASI/USGS
The model showed that the threshold wind speed to generate a wave is lower for liquids with less surface tension, which makes it easier to change the liquid’s shape. Higher air density provides more force to push against a liquid’s surface, and lower gravity makes it easier for a wave to rise up—both factors allow a weaker wind to create a wave. The team published these results in the Journal of Geophysical Research: Planets in April.
Waves on Other Worlds
The team first tested their model on the only set of wind and wave data we have—Earth. They used 20 years of wave and weather data for Lake Superior. The model found, correctly, that it takes wind speeds of 2.2 meters per second to generate waves on the lake’s surface and accurately predicted the height of waves for different wind speeds.
They then used the model to predict wave conditions on other worlds. They started with Mars, which likely had ancient oceans and lakes. Winds of 1.2 meters per second would have created waves in the lake that filled Gale Crater millions of years ago. A wave in Gale Crater would have been taller than a wave on Earth produced by wind of the same strength owing to Mars’s lower gravity.
The story is similar on Titan, the largest moon of Saturn. Waves in Titan’s hydrocarbon lakes would swell with a mere 0.5 meter per second of wind and would rise higher than an Earth wave under similar wind conditions. But they would travel much more slowly than Earth waves and would be spaced farther apart.
“The paper represents our best theoretical understanding of how we expect for waves to behave in a variety of environments,” said Jason Barnes, a planetary scientist at the University of Idaho in Moscow who was not involved with this research. “The movie of Titan waves is particularly awesome—very slow moving for such large amplitudes! Although I don’t expect waves to get that high ever in Titan’s sluggish atmosphere, it’s fun to be able to visualize what they might look like if they did.”
“In theory, this is something that people could do.”
The team also explored wave-generating conditions on three Earth-sized exoplanets. The possible sulfuric acid lakes of the exo-Venus Kepler-1649 b would grow in winds of 5.3 meters per second but would grow to a height similar to that of Earth waves because of its Earth-like gravity. Water lakes on LHS 1140 b would grow in 2.7 meter winds, similar to those on Earth, but would not grow as high because of its higher gravity. And on 55 Cancri e, a lava world, it would take winds of 37 meters per second—a category 1 hurricane—to move tiny waves of molten rock.
“Would you be able to ever detect this? Is this a useful thing to think about, or is it just a fun thought experiment?” Schneck asked. “If the waves are tall enough, you should be able to detect a change in the polarization [of an exoplanet’s light curve] that would not only suggest that there is a liquid surface on that exoplanet, but that liquid surface has waves.…In theory, this is something that people could do.”
Will We See It? Not Soon
Right now, the only world known to have surface liquid other than Earth is Titan, but we don’t have the right observations of Titan to test the new model. The European Space Agency’s Huygens probe landed on the moon in 2005, but nowhere near the northern lake district. NASA’s Cassini mission (of which Huygens was a part) did not detect any waves but did observe a changing lake shore that hinted at wave activity.
It’s possible that Titan’s waves are seasonal and Cassini just didn’t have the right timing, Perron noted. Temperature changes during Saturn’s year could affect wind speeds and also the composition of Titan’s lakes, changing the conditions of wave generation.
Still, the wind speed needed to make a wave on Titan is so low that “it would be very surprising if waves never formed. It just may be difficult to catch them when they’re there,” he said.
“The best way to test this work would be to send a sea probe to float or motor on one of Titan’s big 3 seas.”
“The best way to test this work would be to send a sea probe to float or motor on one of Titan’s big 3 seas—Kraken Mare, Ligeia Mare, or Punga Mare,” Barnes said. “Such a ‘buoy’ probe would be able to simultaneously measure both the sea conditions and the wind conditions, allowing for a comprehensive test of the model.”
Alas, no such mission is in the works, and the upcoming Dragonfly mission won’t travel near any lakes to test this theory either. A future Titan orbiter might provide that information, while a current or future Mars rover might yet gather evidence showing how lakes worked in that planet’s past.
“The improved understanding of waves from this paper might help to constrain the possibilities for wave erosion at the margins of bodies of water…thereby helping us to probe into the past climates of Mars and Titan,” Barnes said.
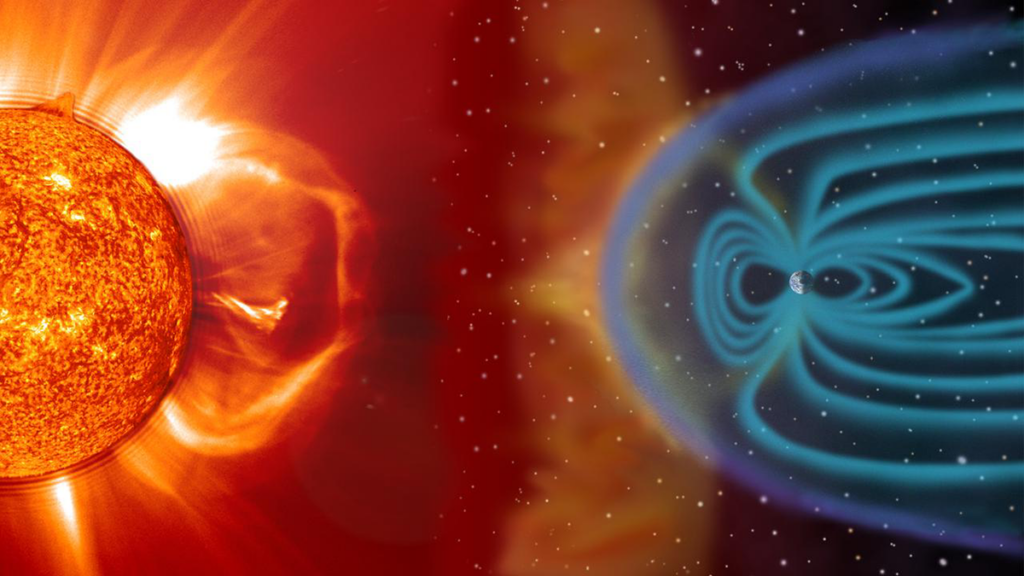
Solar activity affecting Earth and its planetary neighbors encompasses a wide range of phenomena, from the steady solar wind and the interplanetary magnetic field to extreme events like solar flares, coronal mass ejections (CMEs), and solar energetic particle (SEP) events. These space weather phenomena interact in complex ways with planetary magnetospheres and atmospheres. On Earth, we see the results in the dancing lights of stunning auroras and in less frequent but sometimes severe disruptions to telecommunications, navigation, and energy infrastructure.
Forecasting conditions throughout the heliosphere (the region influenced by the solar wind), understanding the variety of Sun-Earth interactions, and predicting arrivals of space weather events—both benign and potentially hazardous—are a grand challenge.
The Sun-Earth challenge requires tracking and predicting conditions—from routine and quiet to rare and extreme—across tens of millions of kilometers of interplanetary space.
Solar flares emit electromagnetic radiation that spreads in all directions. In contrast, the propagation of CMEs and SEP events depends on their source location on the Sun and on the heliospheric magnetic field, which is carried outward by the solar wind. The impacts these events have on magnetosphere systems further vary depending on particle energies and intensities in SEPs and on particle speeds and the magnetic field orientation in CMEs. The Sun-Earth challenge thus requires tracking and predicting conditions—from routine and quiet to rare and extreme—across tens of millions of kilometers of interplanetary space.
This tracking and prediction is powered by petabyte-scale datasets from solar observatories and spacecraft measurements that provide rich observational archives. Researchers use these data to deduce physically meaningful quantities describing the heliosphere and to identify patterns to distinguish quiet from active conditions. The resulting insights not only answer fundamental science questions but also provide critical prediction time frames needed by space weather forecasters.
Even with all these data, the enormity of space between the Sun and Earth presents a major obstacle to our predictive capabilities. Another obstacle is that the data are obtained by different instruments operating at different locations and times. These factors combine to create a unique data sparsity challenge that complicates large-scale analysis.
These fundamental issues—the massive yet still insufficient supply of data available, the extreme differences in the scales of the processes we must illuminate, and the need for actionable predictions—suggest opportunities for artificial intelligence (AI) and machine learning (ML) to complement traditional physics-based analytical approaches [Camporeale, 2019]. In a series of workshops—insights from which inform the discussion below—scientists explored such opportunities and how they can advance heliophysics research and operational space weather forecasting.
The Need for Space Weather Forecasting
Space weather events can have significant impacts on infrastructure and humans. They can disrupt satellite operations (e.g., by enhancing atmospheric drag on satellites), damage electronics in space, interfere with radio communications and GPS, and even affect power grids (e.g., through geomagnetically induced currents) during the most severe events. They can also pose risks to people, especially astronauts beyond the protection of Earth’s atmosphere and airline crews and passengers on long-distance polar flights, during which exposure to energetic particles is elevated. Forecasting offers a first line of defense in preparing for or preventing damaging and hazardous effects of space weather.
In assessing major CMEs, forecasters consider whether and when events will reach Earth and whether they will trigger geomagnetic storms and substorms. For SEP events, predictions must include arrival times, peak intensities, durations, and energy characteristics.
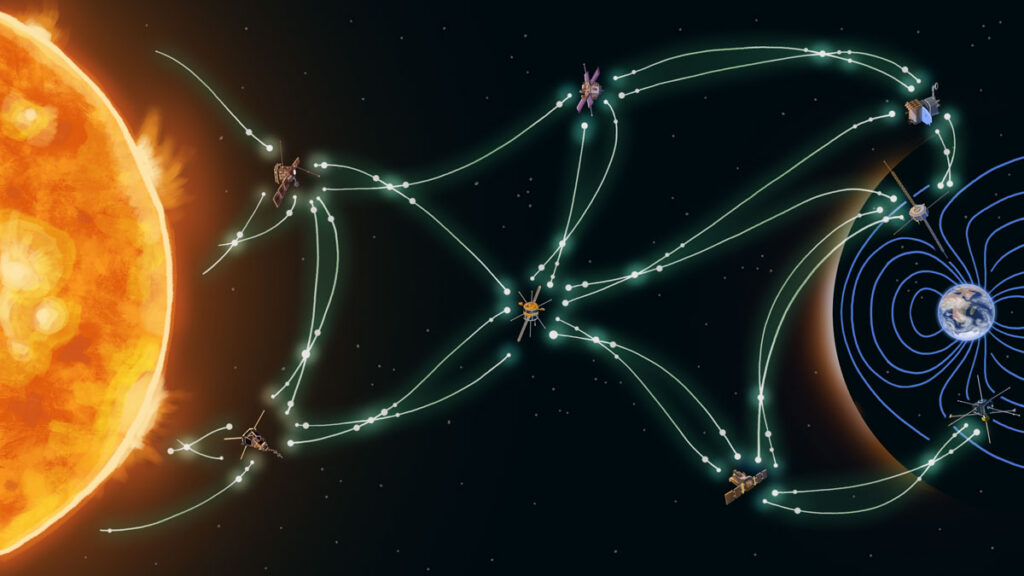
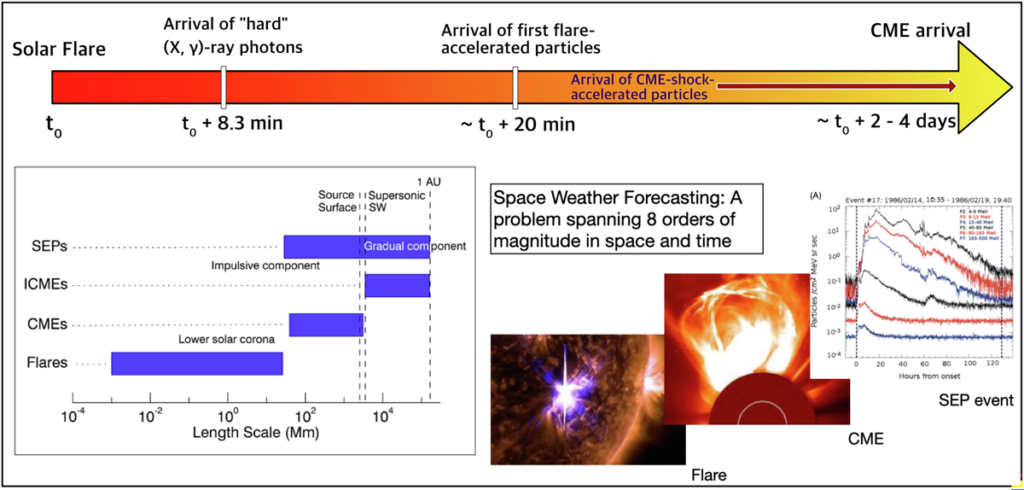
Predicting extreme space weather phenomena is vital, but equally important is forecasting periods when no significant activity is expected, which is critical information for satellite operators and other stakeholders. Making such predictions requires understanding physics spanning 8 orders of magnitude in space and time, from subsecond processes in Earth’s magnetic environment to multiday solar eruptions propagating across the 150 million kilometers between the Sun and Earth (Figure 1) and long-term interactions at scales associated with the 11-year solar cycle.
Fig 1. Length scales and Sun-to-Earth transit times vary greatly for different types of space weather (SW), including solar flares, solar energetic particle (SEP) events, coronal mass ejections (CMEs), and interplanetary coronal mass ejections (ICMEs). High-speed particles are the first to arrive, usually within minutes of a flare, whereas CMEs arrive in 2–4 days. Credit: Georgoulis et al. [2026], CC BY-NC-ND 4.0
In addition to operational forecasting, these challenges are fundamental in heliophysics research. Such research includes work to reveal how the Sun generates its magnetic field, how solar wind accelerates and evolves, how planetary magnetospheres respond to external forcing, how particles are accelerated, and how energy transfers across multiple scales and regimes.
Unique Challenges in Heliophysics
Modern AI and ML algorithms excel at analyzing well-curated, extensive datasets that include millions of training examples. For example, AI-aided terrestrial weather forecasting relying on continuous, high-resolution coverage from thousands of ground stations, weather balloons, and satellites has advanced dramatically in recent years.
Fewer than a dozen spacecraft monitor Earth’s magnetosphere, a region spanning tens of Earth radii. Solar wind observations are even sparser.
Heliophysics, however, presents a unique and somewhat opposite scenario. Fewer than a dozen spacecraft monitor Earth’s magnetosphere, a region spanning tens of Earth radii (about 6,371 kilometers). Solar wind observations are even sparser, with just a handful of monitors scattered across the space between the Sun and Earth. This fundamental scarcity poses a challenge for data-driven approaches, which typically depend on abundant observations that are well distributed in space and time to produce trustworthy (i.e., generalizable and reproducible) models.
Data sparsity is further compounded by the relative rarity of intense space weather phenomena such as CMEs, major geomagnetic storms, and extreme substorms, which occur only a few times per solar cycle. Most heliophysical observations capture quiet, low-activity conditions when the solar wind is steady and magnetospheres are calm. Standard ML approaches trained on such imbalanced datasets may achieve high statistical accuracy by simply predicting a “nothing-will-happen” outcome but completely fail when extreme events occur.
Although solar eruptions and geomagnetic storms are relatively rare, they exhibit recurring patterns and consistency in their physical drivers. This regularity suggests that historical observations, when properly clustered and analyzed, can be used to enhance prediction capabilities. The challenge therefore lies in extracting meaningful patterns from sparse measurements of rare events while avoiding models that work well for average conditions but fail when they matter most [Chu et al., 2025].
AI Solutions for Data Sparsity
Heliophysics research employs clever approaches to extract maximum information from the limited available observations. One strategy is to mine multidecade observational records from various satellites and to match and group together measurements collected at times with similar solar wind and geomagnetic activity conditions.
Another, more universal approach is to embed fundamental physical laws directly into ML models through physics-informed neural networks [Raissi et al., 2019], ensuring that predictions respect physical reality even when training data are limited. Data assimilation techniques used in weather forecasting similarly blend sparse observations with physics-based simulations and update models as new measurements arrive.
This animated model shows Earth’s magnetosphere during a powerful May 2024 geomagnetic storm that involved strong solar flares and multiple CMEs. The visualization uses the Multiscale Atmosphere-Geospace Environment (MAGE) model from the Johns Hopkins Applied Physics Laboratory to depict wind rushing toward Earth and disturbing its magnetic field (orange and purple lines). The green cloud represents electric field current intensity; the blue squiggles are tracers of solar wind velocities. Credit: NASA Scientific Visualization Studio and NASA DRIVE Science Center for Geospace Storms
These methods converge on a common theme: building gray box models (so named because they’re less opaque than black box models) that are data driven but grounded in physically real constraints. For data-starved applications, hybrid approaches can outperform purely data-driven or purely physics-based methods [Liu et al., 2025].
Satellite instruments are generating increasingly large solar wind datasets. However, the variables obtained (e.g., solar wind speed and pressure) are highly intercorrelated [Borovsky, 2018], making it difficult to identify which ones truly drive magnetospheric responses. New algorithms are helping to distill datasets without losing critical scientific information [e.g., Camporeale, 2025]. Meanwhile, advanced statistical and ML methods can cut through dataset complexity by reducing dimensionality, identifying causal relationships among variables, and providing clues about dominant drivers.
For instance, information theory provides tools to detect dependencies in complex systems, establish causality, and rank variables that most effectively predict space weather outcomes [Wing et al., 2022]. Such techniques can be paired with other “explainable” tools, such as SHAP (SHapley Additive exPlanations) values, a method inspired by game theory, to pinpoint physical variables (e.g., solar wind speed or magnetic orientation) that drive a prediction [Ma et al., 2023].
Distilling datasets and improving model interpretability help make ML more practical and more scientifically trustworthy and its predictions more robust. But fully trusting ML models in operational environments requires rigorous validation and uncertainty quantification. These models must not only make predictions but also indicate their confidence levels for operational decisionmaking.
When a model forecasts a major geomagnetic storm, operators need to know whether that prediction carries 60% or 95% confidence, for example.
When a model forecasts a major geomagnetic storm, operators need to know whether that prediction carries 60% or 95% confidence, for example. Ensemble approaches, in which multiple models provide a range of outcomes, help quantify this uncertainty, while using standardized, well-documented datasets enables fair model intercomparisons.
The research community is developing ML-ready benchmark datasets with consistent formatting and clear metadata to establish such validation procedures [e.g., Angryk et al., 2020]. These resources allow researchers to test new algorithms against common baselines, accelerating progress while ensuring that advances are robust and reproducible rather than artifacts of specific data processing choices.
Notably, one domain in heliophysics that is not affected by severe data sparsity is solar imaging. Decades of continuous, high-resolution observations from the Solar Dynamics Observatory (SDO), which delivers 1.5 terabytes of data every day, have created enormous data archives. Because the Sun drives space weather throughout the heliosphere, these datasets offer an ideal opportunity for use in foundation models, large-scale ML systems trained to learn comprehensive internal representations that can then be easily adapted to specific scientific tasks with minimal additional training.
Surya, a foundation model designed to construct a digital representation of the Sun, represents one such effort. It is still in early development and has yet to be validated, but this approach illustrates how data-rich domains can be leveraged with modern AI techniques to create tools that broadly benefit heliophysics research and space weather forecasting.
Advancing Research and Operational Forecasting Together
In addition to the needs for data and model development and validation, applying AI to address the challenges of heliophysics requires sustained, multidisciplinary collaborations. Fostering those collaborations has been the focus of a series of workshops, with the most recent being 2025’s Machine Learning, Data Mining and Data Assimilation in Geospace (LMAG25) meeting at the Johns Hopkins University Applied Physics Laboratory. The workshops have brought together heliophysicists, machine learning experts, data scientists, and specialists from weather forecasting and applied mathematics to exchange knowledge and establish community standards.
Space weather forecasters need models that are accurate and interpretable and that provide not just statistical metrics but also actionable predictions.
The LMAG forums also serve as gathering spaces for scientists to validate models against diverse datasets, compare physics-based and data-driven approaches, develop performance benchmarks, and discuss how to bridge research and operational requirements. Space weather forecasters need models that are accurate and interpretable and that provide not just statistical metrics but also actionable predictions with known limitations and reliability. Of course, researchers also benefit. These conversations allow them to gain insight into operational constraints that shape how modeling approaches become practical in real-world settings.
LMAG and similar initiatives facilitate direct exchanges among adjacent communities, including by making meeting presentations openly available. These efforts are helping translate cutting-edge AI and ML techniques into practical tools that help protect critical infrastructure and human well-being. They are also deepening our understanding of how the Sun shapes space weather throughout the solar system and its effects—both mundane and major—on Earth.
Borovsky, J. E. (2018), The spatial structure of the oncoming solar wind at Earth and the shortcomings of a solar-wind monitor at L1, J. Atmos. Sol. Terr. Phys., 177, 2–11, https://doi.org/10.1016/j.jastp.2017.03.014.
Camporeale, E. (2019), The challenge of machine learning in space weather: Nowcasting and forecasting, Space Weather, 17(8), 1,166–1,207, https://doi.org/10.1029/2018SW002061.
Chu, X., et al. (2025), Imbalanced Regression Artificial Neural Network Model for Auroral Electrojet Indices (IRANNA): Can we predict strong events?, Space Weather, 23(5), e2024SW004236, https://doi.org/10.1029/2024SW004236.
Georgoulis, M. K., et al. (2026), Prediction of solar energetic events impacting space weather conditions, Adv. Space Res., in press, https://doi.org/10.1016/j.asr.2024.02.030.
Liu, Y., et al. (2025), Data-driven modeling of electrostatic turbulence by physics-informed Fourier neural operator, Mach. Learn. Sci. Technol., 6(4), 045050, https://doi.org/10.1088/2632-2153/ae19cd.
Ma, D., et al. (2023), Opening the black box of the radiation belt machine learning model, Space Weather, 21(4), e2022SW003339, https://doi.org/10.1029/2022SW003339.
Raissi, M., P. Perdikaris, and G. E. Karniadakis (2019), Physics-informed neural networks: A deep learning framework for solving forward and inverse problems involving nonlinear partial differential equations, J. Comput. Phys., 378, 686–707, https://doi.org/10.1016/j.jcp.2018.10.045.
Stephens, G. K., et al. (2019), Global empirical picture of magnetospheric substorms inferred from multimission magnetometer data, J. Geophys. Res. Space Phys., 124(2), 1,085–1,110, https://doi.org/10.1029/2018JA025843.
Wing, S., et al. (2022), Modeling radiation belt electrons with information theory informed neural networks, Space Weather, 20(8), e2022SW003090, https://doi.org/10.1029/2022SW003090.
Author Information
Savvas Raptis (savvas.raptis@jhuapl.edu), Manolis K. Georgoulis, Mikhail Sitnov, Anthony Sciola, and Simon Wing, Johns Hopkins University Applied Physics Laboratory, Laurel, Md.
Citation: Raptis, S., M. K. Georgoulis, M. Sitnov, A. Sciola, and S. Wing (2026), Vast space, sparse data: An AI answer to twin space weather challenges, Eos, 107, https://doi.org/10.1029/2026EO260188. Published on 11 June 2026.
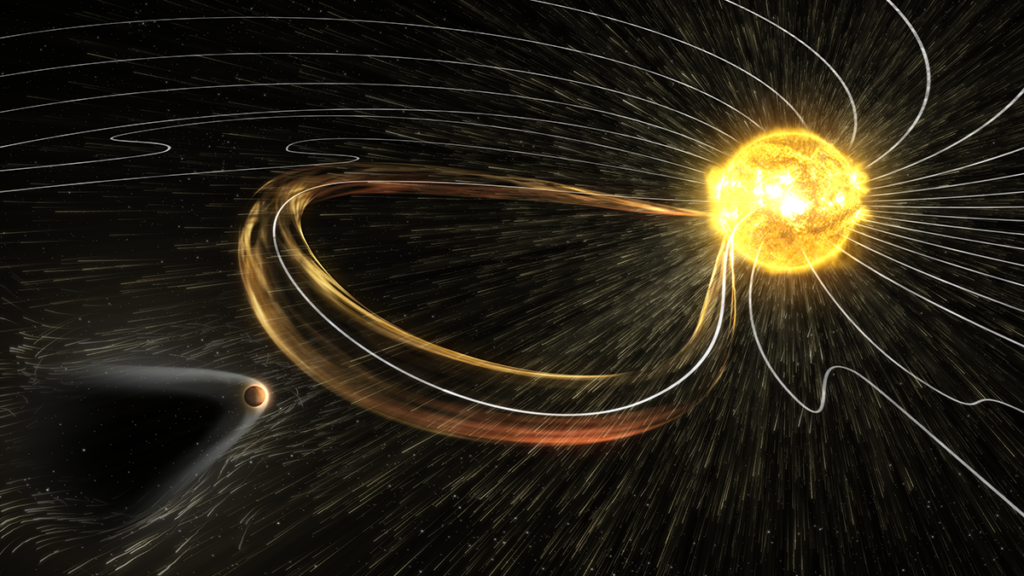
The Sun continuously blasts charged, magnetic field–carrying particles, or plasma, in all directions. This solar wind interacts with the magnetic fields and atmospheres of several of our solar system’s planets and other bodies, sculpting long magnetic tails of charged particles—magnetotails—that stretch into space behind them.
Magnetotails contain thin layers of electric current–carrying plasma sheets, which sometimes “flap” in an up-and-down waving motion. Spacecraft observations have revealed that flapping in Earth’s magnetotail can be driven by a process called magnetic reconnection, in which magnetic field lines rapidly break and then snap together in a new configuration, releasing stored energy. However, whether reconnection plays this same role beyond Earth has thus far been a mystery.
Wen et al. report the first evidence that magnetic reconnection may also trigger magnetotail flapping at Mars.
Unlike Earth, Mars lost its global magnetic field billions of years ago. But it still sports a magnetotail, thanks in large part to interactions between the solar wind and charged particles in its upper atmosphere. Strong magnetic fields embedded in certain patches of the Martian crust—remnants of its lost planet-wide field—also influence the magnetotail.
Until recently, Mars’s magnetotail could only be studied using observations from NASA’s Mars Atmosphere and Volatile Evolution (MAVEN) spacecraft. MAVEN showed that the Martian magnetotail is highly dynamic, with a structure that twists, shifts, and flaps—and from which charged particles may escape into space. But because MAVEN can observe only one part of the magnetotail at a time, it couldn’t identify what processes might trigger flapping.
Another spacecraft, China’s Tianwen-1 orbiter, has now provided a second set of eyes. The researchers analyzed simultaneous observations from the two spacecraft, finding that signatures of magnetic reconnection detected by MAVEN in the upstream part of the magnetotail tended to coincide with flapping events detected downstream by Tianwen-1.
Before or during flapping, the spacecraft also detected temporary, twisted plasma structures known as flux ropes. A similar link has previously been observed on Earth, and it suggests that flux ropes generated by magnetic reconnection upstream might propagate downstream, driving instabilities in the magnetotail’s plasma sheets and triggering flapping.
Though more research is needed to confirm these findings, they shed new light on how energy moves and is released in space around Mars—and possibly other planets and celestial objects. (AGU Advances, https://doi.org/10.1029/2026AV002343, 2026)
Solar eruptions can trigger geomagnetic storms that disrupt satellites, GPS, and power grids, affecting daily activities and technology. Therefore, it is extremely important to understand these storms in order to mitigate their impact. Previous studies mainly focused on interplanetary conditions.
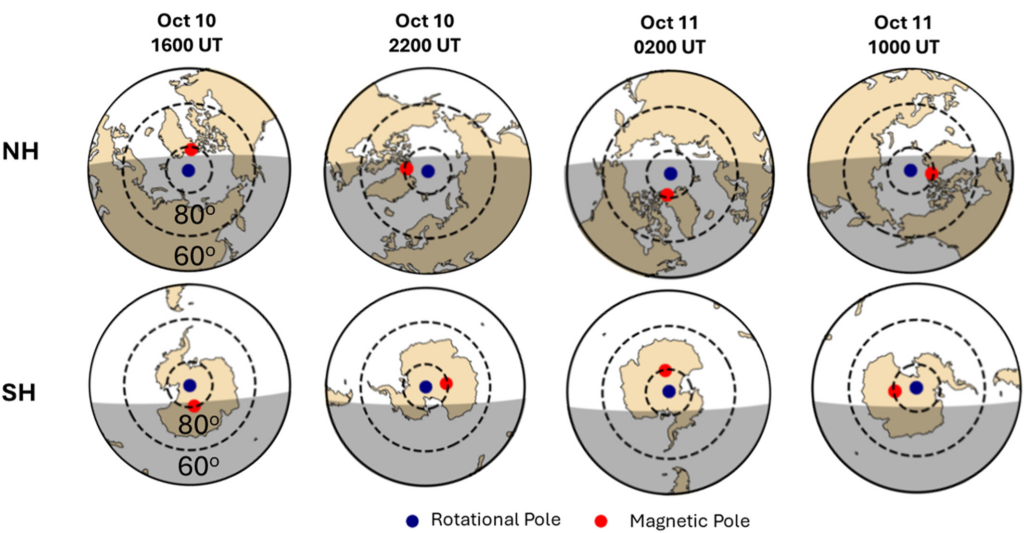
Ghag et al. [2026] investigate the interaction between solar ultraviolet light (EUV) during storms and the Earth magnetic field, taking into account its misalignment and offset with respect to the Earth’s rotational axis, which depend on time. Such misalignment and offset induce variations in EUV exposure in turn influencing the ionosphere and its interaction with the magnetosphere.
The study applies the Multiscale Atmosphere-Geospace Environment (MAGE), a physics based fully coupled whole geospace model. The causal relationship between storm timing and storm effect is explored revealing insights on our capability to predict storm impact based on the time dependent Earth system state.
The rotation of the magnetic pole around the rotational pole in the NH and SH. The location of the rotational pole is denoted in blue and the magnetic pole in red. Credit: Ghag et al. [2026], Figure 6c
Citation: Ghag, K., Lotko, W., Pham, K., Lin, D., Merkin, V., Raghav, A., & Wiltberger, M. (2026). Universal time influence on stormtime magnetosphere ionosphere coupling. AGU Advances, 7, e2025AV002071. https://doi.org/10.1029/2025AV002071