Reading view

Hydrothermal Heat Flow as a Window into Subsurface Arc Magmas

Three scientists working on the side of a mountain.
Editors’ Vox is a blog from AGU’s Publications Department.

The supply of magma from the Earth’s mantle is a primary source of heat to volcanic arc crust, where the heat is then dissipated through various processes. Much of this magmatic heat is dissipated as heated water, or aqueous fluid.

A new article in Reviews of Geophysics compares 11 different volcanic-arc segments where heat discharge via aqueous fluid has been well-inventoried to better understand the factors that influence this process. Here, we asked the authors to give an overview of heat discharge from volcanic arcs, how scientists measure it, and what questions remain.

Why is it important to study how heat is dissipated from volcanic arcs?

The heat from these magmas matters for geothermal energy, patterns of groundwater flow, and the patterns of volcanic activity at the surface.

Volcanic arcs are the chains of volcanoes on top of subduction zones. They can produce some of Earth’s most explosive and hazardous eruptions. But much of the magma beneath the surface never erupts. Nevertheless, the heat from these magmas—and the simple fact of their existence and abundance—still matters for geothermal energy, patterns of groundwater flow, and the patterns of volcanic activity at the surface.

What are the main modes in which heat is discharged from volcanic arcs?

Heat at volcanic arcs can be carried by magmas, transmitted through the crust conductively, and carried by water seeping slowly through the crust. At the base of the crust, magmas are probably most important, with conduction coming in second. But as magmas move upwards through the crust, some of them solidify and impart their heat to their surroundings where it is transferred by conduction. Within a few kilometers of the surface, fluids seeping through the crust begin to take up all that heat, and so if we can quantify the heat carried by those fluids, we can retrace it to its origins in magmas.

How do scientists measure these different forms of heat loss?

Scientists measure the heat carried by erupting magmas using satellites, or by adding up the erupted masses and making an estimate of how much energy was released by cooling from eruption temperatures to solid igneous rocks at Earth’s surface. Conductive heat flow is measured by drilling holes in the Earth’s crust to see how quickly it gets hotter with depth.

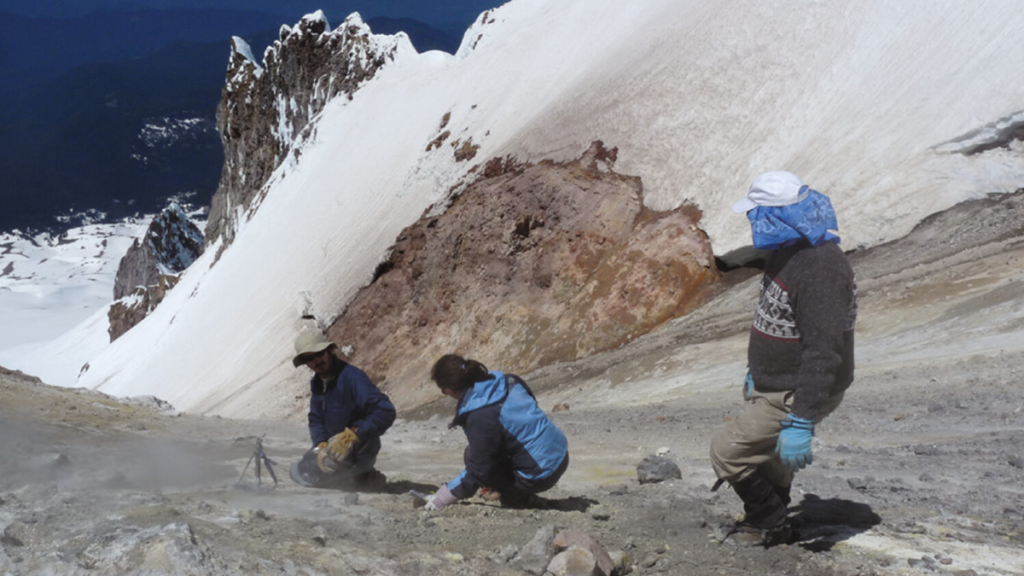
Measuring the heat carried by aqueous fluids in the crust is in some ways the trickiest. One approach is to find all the springs where hot or even slightly warm water is trickling out and measure the temperature and discharge to estimate how much extra heat that water is carrying.

What are the challenges and uncertainties in measuring hydrothermal heat discharge?

One challenge is that many springs are only slightly warmer than you’d expect. There is good data for many hot springs, but there are data tracking these ‘slightly warm’ springs for only a subset of arcs. Another challenge is that warm underground fluids can flow laterally, so you have to try to account for that. This is not an uncertainty in hydrothermal discharge, but one additional big uncertainty for our study, where we were trying to quantify the proportion of magmas that freeze underground versus erupting, is in the estimates of how much magma has actually erupted through time.

What are some of the factors that influence hydrothermal heat loss?

A major goal of our paper is to try to quantify these hidden magmas.

A main factor that influences hydrothermal heat loss is the magmas that solidify underground. This link is the key motivation for our study. A major goal of our paper is to try to quantify these hidden magmas—how much magma needs to intrude the crust beneath the surface to supply the hydrothermal heat fluxes that we observe? The composition of magmas influences how much heat they can release. The depth at which magmas are emplaced also matters, because magmas that intrude the shallow crust eventually cool to lower temperatures than magmas emplaced in the lower crust and therefore release more heat.

What are the remaining questions or knowledge gaps where additional research efforts are needed?

A big outstanding challenge is combining estimates from hydrothermal data of how much magma is coming into the crust – like ours – with other approaches to estimating the same thing. The magmatic systems beneath volcanoes span the crust. At the base of the crust, you have magma supply, sort of like the water main feeding your plumbing system. Despite how fundamental magma supply is, we know remarkably little about it. It’s exciting to think about how the rates of magma supply could vary through time and space and why. Applying a range of techniques—including geophysical imaging, hydrothermal budgets, gas and igneous geochemistry, and petrology—to understand these questions could really be a game changer.

—Benjamin A. Black (bblack@eps.rutgers.edu; 0000-0003-4585-6438), Rutgers University, United States; S. E. Ingebritsen (steve.ingebritsen@gmail.com; 0000-0001-6917-9369), Kyoto University, Japan; and Kazuki Sawayama (sawayama@bep.vgs.kyoto-u.ac.jp; 0000-0001-7988-3739), Kyoto University, Japan

Editor’s Note: It is the policy of AGU Publications to invite the authors of articles published in Reviews of Geophysics to write a summary for Eos Editors’ Vox.

Citation: Black, B. A., S. E. Ingebritsen, and K. Sawayama (2026), Hydrothermal heat flow as a window into subsurface arc magmas, Eos, 107, https://doi.org/10.1029/2026EO265017. Published on 28 April 2026.
This article does not represent the opinion of AGU, Eos, or any of its affiliates. It is solely the opinion of the author(s).
Text © 2026. The authors. CC BY-NC-ND 3.0
Except where otherwise noted, images are subject to copyright. Any reuse without express permission from the copyright owner is prohibited.
  •  

How Space Plasma Can Bend the Laser of Gravitational Wave Detectors

Diagram from the article.
Editors’ Highlights are summaries of recent papers by AGU’s journal editors.
Source: Space Weather

TianQin is a geocentric space-borne gravitational wave detector, which is proposed to detect the gravitational wave by measuring tiny displacements using inter-satellite laser interferometry. However, the space surrounding the orbit and laser links of TianQin is not a vacuum—but filled with plasma, which can bend the laser links and induce pointing accuracy noise in the gravitational wave detection.

Based on a global magnetohydrodynamic model, Zhou et al. [2026] use a ray-tracing method to obtain the laser deflection caused by laser propagation through plasma, and to evaluate the pointing accuracy noise.  The result shows that the laser deflection effect caused by large-scale space plasma distribution under quiet to moderate space weather conditions does not represent a fundamental risk to the TianQin mission. However, during severe space weather events, the laser propagation effect could become a considerable noise in the gravitational wave detection.

This work establishes a connection between space weather and gravitational wave detection. Furthermore, this work raises awareness of the impact of space weather on other high-precision electromagnetic wave measurements in space.

Citation: Zhou, S. W, Su, W., Zhou, S. Y., Li, C. F., & Zhang, J. X. (2026). The pointing error due to laser propagation in space plasma for TianQin gravitational wave detection. Space Weather, 24, e2025SW004784. https://doi.org/10.1029/2025SW004784

—Jiuhou Lei, Editor, Space Weather

Text © 2026. The authors. CC BY-NC-ND 3.0
Except where otherwise noted, images are subject to copyright. Any reuse without express permission from the copyright owner is prohibited.
  •  

Gravity Waves Help Drive Sediment to the Deep Ocean

Photo of the experimental flume used in the study.
Editors’ Highlights are summaries of recent papers by AGU’s journal editors.
Source: Journal of Geophysical Research: Earth Surface

Turbidity currents are underwater currents that transport sediment on the sea floor. They were first observed in the late 1800s in Lake Geneva, Switzerland. The cable break following the 1929 Grand Banks earthquake offshore Canada revealed how massive and destructive these fluxes can be.

Turbidity currents move downslope because they have a higher density than the surrounding water due to the presence of sediment in suspension. It is critical to keep in mind that suspended sediment concentration in these flows is low, meaning that the fluid is Newtonian and the flow is turbulent.

Notwithstanding recent advances in field monitoring, measuring turbidity current thickness, velocity, suspended sediment concentration, and grain size distribution remains difficult not only for the high-water depths and the destructive nature of some events, but also because these flows are often infrequent. Laboratory experiments and mathematical modeling have been used extensively to understand nature and some aspects of these flows, but questions remain on, for example, how turbidity currents interact with ocean waves, if they do.

Daniller-Verghese et al. [2026] performed laboratory experiments to determine if and how turbidity currents interact with ocean gravity waves. Experimental flows were released in an 11-meter-long, 1.2-meter-deep, and 0.61-meter-wide flume in the Experimental Sedimentation Laboratory of the Jackson School of Geoscience at the University of Texas. A motored wave maker was installed at the downstream end of the facility to generate the wave field. During the experiments, detailed velocity measurements were conducted to characterize the flow field and the fine details of the turbulent fluctuations. At the end of each experiment, high-resolution measurements of changes in bed elevations allowed the quantification of the net depositional fluxes.

The results show that, in presence of a superimposed wave field, the center of deposition volume shifted downstream compared to experiments conducted with the same inflow but in absence of waves. In addition, velocity measurements indicate that the wave signal is stronger in presence of turbidity currents compared to the “clear water” case. In other words, current velocity was larger when waves were present, enhancing downslope sediment transport and causing the observed downstream shift of the center of deposition.

Although the physical mechanism responsible for the observed increase of sediment transport rates in presence of a superimposed wave field still needs to be resolved, these results provide novel insight for the interpretation of storm and turbidity current deposits in the rock record. They also highlight the importance of considering wave-turbidity current interactions to constrain sediment budgets on continental shelves, which are essential to preserve and manage coastlines worldwide.

Citation: Daniller-Varghese, M., Smith, E., Mohrig, D., & Myrow, P. (2026). Wave-signal entrainment into combined flows: Consequences for sediment transport, signal dislocation, and turbulence. Journal of Geophysical Research: Earth Surface, 131, e2025JF008497. https://doi.org/10.1029/2025JF008497

—Enrica Viparelli, Associate Editor, JGR: Earth Surface

Text © 2026. The authors. CC BY-NC-ND 3.0
Except where otherwise noted, images are subject to copyright. Any reuse without express permission from the copyright owner is prohibited.
  •  

More Braided Rivers from Increasing Flow Variability

Photo of a braided river.
Editors’ Highlights are summaries of recent papers by AGU’s journal editors.
Source: AGU Advances

The evolution of rivers that split into multiple channels is a scientific challenge in terms of modeling and prediction. On the other hand, these rivers are widespread and play a key role for ecosystems’ life, groundwater recharge, and therefore, water security. They are also extremely sensitive to hydroclimatic changes, leading to shifts in precipitation, erosion and sediment transport.

Zhao et al. [2026] investigate the drivers of river evolution for 97 multithread river reaches worldwide, spanning diverse climates and morphologies. The study reveals the key role of intermittency for river evolution. In particular, higher flow intermittency could lead to more even flow partitioning among threads, therefore impacting hydrology and ecosystems. With flow variability increasing after climate change, rivers are likely to increase their thread count, thus impacting livelihoods and ecosystems.

Two example multithread reaches shown in Landsat images from (b) the Irtysh River (wandering) and (c) the Yukon River (braided). Credit: Zhao et al. [2026], Figure 1(b,c)

Citation: Zhao, F., Ganti, V., Chadwick, A., Greenberg, E., McLeod, J., Liu, Y., et al. (2026). Global hydroclimatic controls on multithread River dynamics. AGU Advances, 7, e2025AV002166. https://doi.org/10.1029/2025AV002166

—Alberto Montanari, Editor-in-Chief, AGU Advances

The logo for the United Nations Sustainable Development Goal 13 is at left. To its right is the following text: The research reported here supports Sustainable Development Goal 13. AGU is committed to supporting the United Nations 2030 Agenda for Sustainable Development, which provides a shared blueprint for peace and prosperity for people and the planet, now and into the future.
Text © 2026. The authors. CC BY-NC-ND 3.0
Except where otherwise noted, images are subject to copyright. Any reuse without express permission from the copyright owner is prohibited.
  •  
❌