Reading view

Choice of Glen’s n Leads to Differing Projections of Ice Sheet Mass Loss

Photo of a glacier with mountains in the background.
Editors’ Highlights are summaries of recent papers by AGU’s journal editors.
Source: Journal of Geophysical Research: Earth Surface

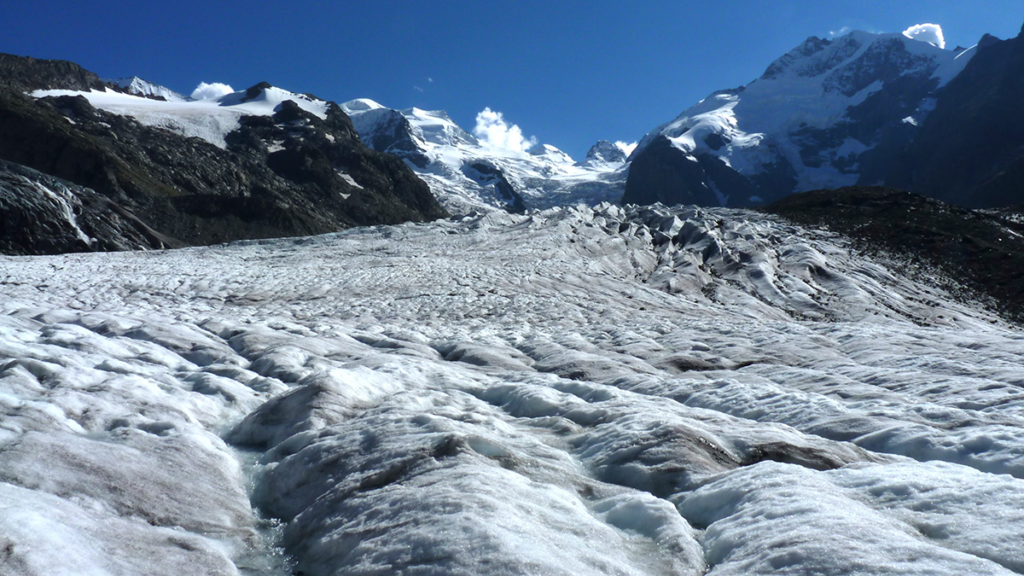
Glacier ice is a crystalline material that flows across the Earth’s surface and is often close to the pressure-melting point. The way ice deforms is therefore an interplay of many factors including the temperature, grain size, and purity of the ice. Numerical models of ice flow are based on the Glen-Nye flow law (Glen’s Law)—a simple relationship between stress and strain in ice developed by John Glen and John Nye from laboratory experiments in the 1950s. Glen’s Law derives strain (creep, or deformation flow of ice) from the applied stress raised to the power of the exponent n, multiplied by the temperature-dependent constant A. The values for these parameters are empirical, and both linear and power-law forms of Glen’s Law have been proposed, although a value of 3 is typically used for n.

Lilien et al. [2026] use a flowline model to explore the impact of the choice of value for Glen’s n on the outcome of projections of ice sheet mass change, considering different values for A and different glacier sliding laws. They found that the relationship between n and glacier mass loss is complicated and varies depending on glacier type. For dynamically controlled glaciers, increasing n increased mass loss, as ice flowed more rapidly into ablation areas. For surface mass balance-controlled glaciers, increasing n decreased mass loss, because ice flux decreased at the equilibrium line. The authors find that using a single value for Glen’s n is likely to lead to large uncertainties in projections of ice sheet change, and therefore studies of future ice sheet mass loss need to consider how the flow-law exponent varies spatially.

Citation: Lilien, D. A., Ranganathan, M., & Shapero, D. R. (2026). Effect of the flow-law exponent on ice-stream sensitivity to melt. Journal of Geophysical Research: Earth Surface,131, e2025JF008726. https://doi.org/10.1029/2025JF008726  

—Ann Rowan, Editor-in-Chief, JGR: Earth Surface

Text © 2026. The authors. CC BY-NC-ND 3.0
Except where otherwise noted, images are subject to copyright. Any reuse without express permission from the copyright owner is prohibited.
  •  

Small and Large Grains Move Differently in Water

Diagram and photo of the experimental setup.
Editors’ Highlights are summaries of recent papers by AGU’s journal editors.
Source: Journal of Geophysical Research: Earth Surface

Sediment transport shapes the Earth surface in different ways, by forming desert dunes and by sculpting the topography of rivers, but the physics of sediment transport initiation is still incompletely understood. For decades, models have generally assumed two basic entrainment mechanisms: a grain resting on the sediment bed is either lifted directly by fluid forces, or it is emitted from the soil indirectly, as product of a granular splash caused by the heavy impact of another grain.

However, recent breakthroughs in grain-based simulations and high-speed visualization have been offering a much clearer look at the processes that trigger grain motion. Insights from these recent advances have revealed a rather broad spectrum of indirect particle-particle and particle-fluid interactions driving entrainment, including the rearrangement of surface grains after splash and changes in near‐bed flow structure due to moving grains. These interactions exert non-local influences on transport thresholds, giving rise to a dynamic process known as collective particle entrainment—a mechanism that remains poorly understood at a fundamental level.

In a new study, Chartrand [2026] shows that collective particle entrainment is size-dependent: large grains interact primarily with their peers, while smaller grains are mobilized by both large and similar-sized particles. This distinction leads to divergent transport signatures, with a new stochastic model predicting temporally correlated motion for small grains and uncorrelated, white-noise entrainment statistics for larger particles.

Although theoretical modeling will be required to shed further light on the physics of collective entrainment, the author’s study is a step toward a quantitative model of sediment transport from a probabilistic perspective. Looking ahead, Chartrand’s ideas could now be extended to other environments, potentially transforming our understanding of entrainment in other contexts such as wind-blown transport and extraterrestrial atmospheric processes.

Citation: Chartrand, S. M. (2026). Collective particle entrainment explored with experimental data and coupled transfer functions. Journal of Geophysical Research: Earth Surface, 131, e2025JF008657. https://doi.org/10.1029/2025JF008657

—Eric Parteli, Associate Editor, JGR: Earth Surface

Text © 2026. The authors. CC BY-NC-ND 3.0
Except where otherwise noted, images are subject to copyright. Any reuse without express permission from the copyright owner is prohibited.
  •  

A Digital Twin for Arctic Permafrost Beneath Roads

Maps and photo of the study region.
Editors’ Highlights are summaries of recent papers by AGU’s journal editors.
Source: Journal of Geophysical Research: Earth Surface

Permafrost beneath Arctic roads is warming and becoming less stable, creating growing risks for northern infrastructure. Yet predicting how frozen ground will evolve remains difficult because subsurface conditions vary sharply over short distances, observations are sparse, and conventional process-based models are not easy to update as new field data arrive. In a new study, Gou et al. [2026] address that challenge at an embankment road in Utqiaġvik, Alaska, using fiber-optic temperature measurements collected along a 100-meter transect to track how shallow ground conditions change through time. Rather than treating monitoring and modeling as separate tasks, the authors link them in a framework designed to evolve with the physical system itself.

What stands out here is not simply the use of machine learning, but the way the authors build a physics-informed digital twin for permafrost under infrastructure. Their framework embeds a neural network within a heat-transfer solver, so the governing physics remain central while the model can still update uncertain soil properties as new observations arrive. This study moves beyond black-box prediction toward an interpretable, updateable system that can reconstruct subsurface temperature fields, infer thermodynamic properties such as unfrozen water content and thermal conductivity, and then test those inferences against independent DAS data, borehole temperatures, and laboratory measurements. This makes the work more than a site-specific modeling exercise; it offers a credible pathway toward near-real-time permafrost forecasting and infrastructure monitoring in a rapidly warming Arctic.

Framework of the proposed digital twin model. The neural network (NN) takes soil temperature at each lateral position as input and outputs six unknown parameters that vary laterally with distance. These parameters are embedded in the heat‐transfer equation through constitutive relationships, and the resulting system is solved using a finite difference method (FDM). The difference between predicted and observed temperatures is computed and defined as “loss,” and the loss gradients are backpropagated to update the NN parameters. Credit: Gou et al. [2026], Figure 2

Citation: Gou, L., Xiao, M., Zhu, T., Martin, E. R., Wang, Z., Rocha dos Santos, G., et al. (2026). Physics-informed digital twin for predicting permafrost thermodynamic characteristics under an embankment road in Utqiaġvik, Alaska. Journal of Geophysical Research: Earth Surface, 131, e2025JF008787. https://doi.org/10.1029/2025JF008787

—Xiang Huang, Associate Editor, JGR: Earth Surface

The logo for the United Nations Sustainable Development Goal 11 is at left. To its right is the following text: The research reported here supports Sustainable Development Goal 11. AGU is committed to supporting the United Nations 2030 Agenda for Sustainable Development, which provides a shared blueprint for peace and prosperity for people and the planet, now and into the future.
Text © 2026. The authors. CC BY-NC-ND 3.0
Except where otherwise noted, images are subject to copyright. Any reuse without express permission from the copyright owner is prohibited.

  •  

Drone Imagery Reveals Marked Variability in Antarctic Snow Roughness

Snow drifts.
Editors’ Highlights are summaries of recent papers by AGU’s journal editors.
Source: Journal of Geophysical Research: Earth Surface

Antarctica’s snow and ice surfaces play a key role in how the continent exchanges heat and moisture with the atmosphere. A key property controlling this exchange is aerodynamic roughness length (zo), which measures how “bumpy” the surface is. Rougher surfaces, such as snow sastrugi (wind-formed ridges and grooves), interact more strongly with the air above, affecting snow movement, melting, and local environmental conditions. Despite its importance, zo is often treated as a single, constant value over large areas in Earth system models because it is difficult to measure.

Zheng et al. [2026] use a multi-temporal Unmanned Aerial Vehicle (UAV) oblique photogrammetry to map fine scale zo variability at Qinling Station in East Antarctica. The results show that zo can vary substantially depending on surface type, measurement scale, model choice, and meteorological conditions. The complex response of surface microtopography to meteorological events is a noteworthy new finding. For example, in snow sastrugi areas, zo can vary by an order of magnitude over time, increasing after snowfall and decreasing under strong winds. These findings highlight that capturing fine-scale surface roughness is essential for accurately modeling snow–atmosphere interactions in Antarctica and could help improve current weather and climate models for polar regions.

Citation: Zheng, Z., Zheng, L., Wang, K., Clow, G. D., & Cheng, X. (2026). UAV oblique imagery reveals order-of-magnitude changes in snow aerodynamic roughness length under shifting meteorological regimes at Qinling Station, East Antarctica. Journal of Geophysical Research: Earth Surface, 131, e2025JF008781. https://doi.org/10.1029/2025JF008781

   —Elizabeth Orr, Associate Editor, JGR: Earth Surface

Text © 2026. The authors. CC BY-NC-ND 3.0
Except where otherwise noted, images are subject to copyright. Any reuse without express permission from the copyright owner is prohibited.
  •  

Nvidia’s New Chip Aims to Upend the Creative Laptop Market

A person with long hair is silhouetted against a dark background, holding and using a laptop with a visible Windows logo. Light highlights part of their face and hands.

Microsoft and Nvidia made joint announcements today. Microsoft is launching a brand-new Surface Laptop Ultra, the most powerful Surface Laptop ever built, and it is powered by Nvidia's new RTX Spark system-on-a-chip, a "new superchip that reinvents Windows PCs for the era of personal AI agents."

[Read More]

  •  

Gravity Waves Help Drive Sediment to the Deep Ocean

Photo of the experimental flume used in the study.
Editors’ Highlights are summaries of recent papers by AGU’s journal editors.
Source: Journal of Geophysical Research: Earth Surface

Turbidity currents are underwater currents that transport sediment on the sea floor. They were first observed in the late 1800s in Lake Geneva, Switzerland. The cable break following the 1929 Grand Banks earthquake offshore Canada revealed how massive and destructive these fluxes can be.

Turbidity currents move downslope because they have a higher density than the surrounding water due to the presence of sediment in suspension. It is critical to keep in mind that suspended sediment concentration in these flows is low, meaning that the fluid is Newtonian and the flow is turbulent.

Notwithstanding recent advances in field monitoring, measuring turbidity current thickness, velocity, suspended sediment concentration, and grain size distribution remains difficult not only for the high-water depths and the destructive nature of some events, but also because these flows are often infrequent. Laboratory experiments and mathematical modeling have been used extensively to understand nature and some aspects of these flows, but questions remain on, for example, how turbidity currents interact with ocean waves, if they do.

Daniller-Verghese et al. [2026] performed laboratory experiments to determine if and how turbidity currents interact with ocean gravity waves. Experimental flows were released in an 11-meter-long, 1.2-meter-deep, and 0.61-meter-wide flume in the Experimental Sedimentation Laboratory of the Jackson School of Geoscience at the University of Texas. A motored wave maker was installed at the downstream end of the facility to generate the wave field. During the experiments, detailed velocity measurements were conducted to characterize the flow field and the fine details of the turbulent fluctuations. At the end of each experiment, high-resolution measurements of changes in bed elevations allowed the quantification of the net depositional fluxes.

The results show that, in presence of a superimposed wave field, the center of deposition volume shifted downstream compared to experiments conducted with the same inflow but in absence of waves. In addition, velocity measurements indicate that the wave signal is stronger in presence of turbidity currents compared to the “clear water” case. In other words, current velocity was larger when waves were present, enhancing downslope sediment transport and causing the observed downstream shift of the center of deposition.

Although the physical mechanism responsible for the observed increase of sediment transport rates in presence of a superimposed wave field still needs to be resolved, these results provide novel insight for the interpretation of storm and turbidity current deposits in the rock record. They also highlight the importance of considering wave-turbidity current interactions to constrain sediment budgets on continental shelves, which are essential to preserve and manage coastlines worldwide.

Citation: Daniller-Varghese, M., Smith, E., Mohrig, D., & Myrow, P. (2026). Wave-signal entrainment into combined flows: Consequences for sediment transport, signal dislocation, and turbulence. Journal of Geophysical Research: Earth Surface, 131, e2025JF008497. https://doi.org/10.1029/2025JF008497

—Enrica Viparelli, Associate Editor, JGR: Earth Surface

Text © 2026. The authors. CC BY-NC-ND 3.0
Except where otherwise noted, images are subject to copyright. Any reuse without express permission from the copyright owner is prohibited.
  •  
❌