In honor of this annual U.N. event, we are highlighting our coverage of ocean research and education initiatives at the Columbia Climate School and Lamont-Doherty Earth Observatory.
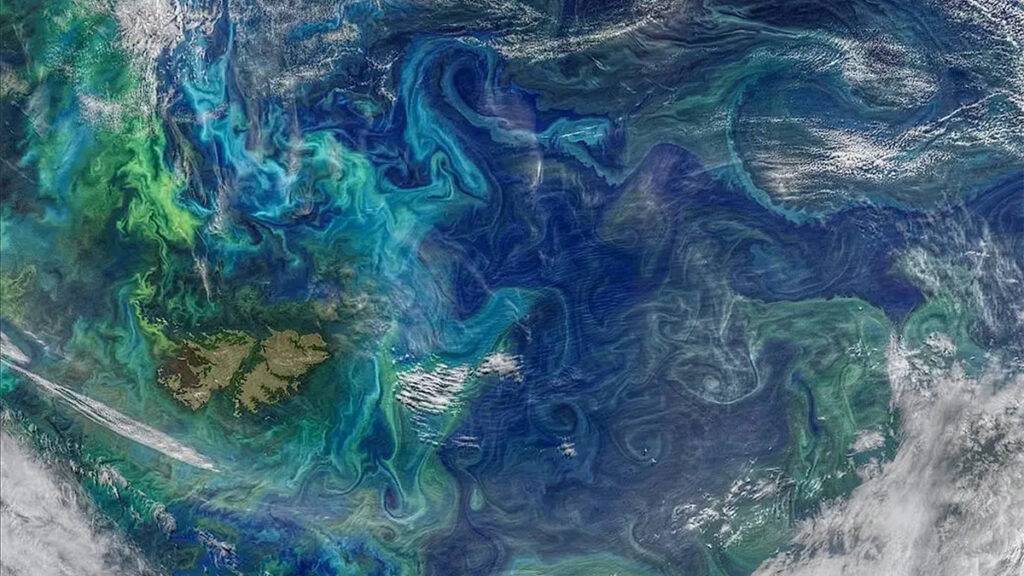
The biological carbon pump moves carbon from near the ocean’s surface to deeper regions, maintaining the upper ocean’s ability to absorb carbon from the atmosphere. One component of this system is driven by eddies, or relatively small-scale circular water currents powered by physical instabilities within the ocean. Previous estimates have suggested the eddy subduction pump may play a large role in moving carbon deep into the ocean, but the absence of global synthesis leaves the question open.
With data from a worldwide network of remote sensors, Keutgen De Greef et al. captured the eddy subduction pump in action around the globe. Their analysis shows that this pump carries less than 5% of the overall organic carbon transported by the biological carbon pump, meaning it’s of secondary importance to understanding ocean carbon flows.
The authors used data spanning 2010 to 2024 from 941 Argo floats drifting autonomously around the globe. They found 1,333 eddy subduction events below 200 meters. Adding up the contribution of a subset of these they identified as carbon subduction events, they estimated the eddy subduction pump exports 0.05 petagram (~50 million metric tons) of carbon per year from the ocean surface. Carbon subduction hot spots exist at mid- to high latitudes in the Southern Ocean and subpolar North Atlantic, both of which also exhibited a strong seasonal peak in spring. The authors also noted a correlation between eddy kinetic energy and physical subduction events (when surface waters sink below the mixed layer), providing insights into the mechanisms driving the eddy subduction pump
The study comes with some limitations, including the sparsity of data in ocean regions including much of the Pacific, the South Atlantic, and the southern Indian Ocean, which could lead to those regions’ contributions being underestimated. The Argo floats measure particulate carbon levels but are unable to effectively measure dissolved organic carbon, meaning some carbon export is being missed. But given the minimal contribution of the eddy subduction pump, these factors may not significantly change estimates of overall biological carbon subduction, the authors suggest. (Global Biogeochemical Cycles, https://doi.org/10.1029/2025GB008912, 2026)
Citation: Scharping, N. (2026), Eddy or not: Do eddies actually transport that much carbon?, Eos, 107, https://doi.org/10.1029/2026EO260119. Published on 17 April 2026.
Orbital imaging has hinted that Mars may have carbon-containing rocks called carbonates on its surface. Carbonates on Mars could offer new insights into how water interacted with rock on the Red Planet, helping scientists learn more about its past. In addition, because carbonates on Earth are primarily produced by living organisms, these rocks are high-value targets in the search for signatures of past life on Mars.
NASA’s Perseverance rover has been traversing Mars since 2021, covering more than 41 kilometers, much of it within Jezero Crater in the Nili Fossae region. Previous orbital data indicated the crater contains carbonates, as well as abundant olivine, which can change to carbonate in the presence of water and carbon dioxide. Now Clavé et al. have analyzed spectroscopic data from Perseverance’s SuperCam instrument suite from multiple locations within Jezero Crater, providing clear evidence of carbonates on Mars, as well as detailed information on how the mineralogy varies between locations.
The authors confirmed the presence of both carbonates and olivine-bearing rocks throughout Jezero Crater and found a generally inverse relationship between the two minerals. By contrast, carbonates were generally positively correlated with the presence of hydrated silica. The researchers hypothesize that an ancient lake in the crater, along with potential hydrothermal activity, played a role in transforming olivine to carbonate. The varying amounts of carbonate and different alteration states seen today may have been caused by changing lake levels on Mars billions of years ago, the researchers suggest.
Amounts of carbonate by weight vary between locations, from 1%–3% in the Séítah unit to 6%–16% in the Eastern Margin Unit. Extrapolating to the entire regional olivine-rich unit, the researchers calculated it could contain as much as 1.1 × 10¹⁴ kilograms of carbon, or up to 0.4% of the current total mass of the Martian atmosphere. Overall, Mars’s crust could contain significant amounts of carbon, implying that widespread carbon sequestration may have cooled the planet significantly in the past. (Journal of Geophysical Research: Planets, https://doi.org/10.1029/2025JE009107, 2026)
Citation: Scharping, N. (2026), Carbon-rich rocks may have cooled the ancient Martian atmosphere, Eos, 107, https://doi.org/10.1029/2026EO260170. Published on 28 May 2026.
If you took one long-haul flight each year for the past decade, the world would eventually pay about $25,000 for it. You won’t see this charge on your credit card, but the cost shows up somewhere—maybe as a hotter field with less rice, a stronger hurricane, or a factory forced to close on days that are too hot to work. This estimate comes from a Nature study published in March 2026 by researchers at Stanford and the University of California, Berkeley. They created a new way to link damage from specific emissions to certain places and years.
That $25,000 figure is based on the social cost of carbon, a dollar estimate of the harm caused by releasing one ton of carbon dioxide into the air. While it might seem abstract, it is one of the most important numbers in American policy. It helps decide if a fuel-economy rule is worth it and influences permits for pipelines and power plants. Over the last four presidential administrations, this number has been raised, lowered, removed, and brought back. What we think a ton of carbon costs today affects how much the country is willing to do about climate change in the future.
What Is the Social Cost of Carbon?
Think of the cost of carbon like a garbage bill, the metaphor the authors of the Nature study use. When you put trash on the curb, someone has to pick it up, haul it away, and store it somewhere. You pay for that service. Carbon dioxide works the same way, except no one sends an invoice—it’s more like using a credit card, the bill for which your children or great-grandchildren will eventually pay.
Carbon dioxide stays in the atmosphere for centuries, quietly heating the planet, damaging crops, intensifying storms, and wearing down economies. Somebody, somewhere, eventually pays. The social cost of carbon is an attempt to figure out how much.
The number comes from combining climate science with economics. Researchers model how one extra ton of CO₂ affects global temperatures over the next century or two, then estimate how those temperature changes damage human health, farm yields, labor productivity, property, and economic growth. They add up the losses and express them in today’s dollars.
Two technical choices drive almost every disagreement about the final number:
Global versus domestic damages. Should the United States count the damage that occurs in India, Brazil, or Bangladesh from American emissions? Carbon mixes in the atmosphere — a ton released in Ohio warms the planet the same as a ton released in Mumbai — so the economic case for global accounting is strong. The political case for domestic-only accounting is that the US government works for Americans.
The discount rate. This is the trickiest piece. Economists “discount” future damages to express them in present-day dollars. A higher discount rate makes future harm look cheap today; a lower one makes it look expensive. Using a 7% discount rate, $1 trillion in climate damage in 2100 is worth only about $4 billion today. Using 3%, the same damage is worth about $86 billion. Same science, same damage, twenty times the present value.
That second choice, how much weight to give your grandchildren’s losses compared to your own savings, is where climate economics becomes a moral question.
That decision created a legal obligation. If federal agencies wanted to write rules that survived court review, they had to put a price on carbon. They just did not yet have one they could agree on.
2009–2016: The Obama Administration Sets the Framework
In 2009, President Obama convened an Interagency Working Group of federal economists and scientists. In 2010, the group published its first official estimate of the social cost of carbon: $21 per ton of CO₂.
In the following years, as climate models were updated, the estimate rose, reaching about $50 per ton (2020 dollars) by the end of the Obama years. This value was based on a 3% discount rate and global damages.
That framework, which involved interagency process and peer-reviewed models with global scope, was used in more than 65 federal rules and 81 subrules between 2008 and 2016. It shaped appliance efficiency standards, power plant emission limits, fuel-economy requirements, and rules governing methane leaks from oil and gas infrastructure. A higher social cost of carbon justified stricter rules. A lower one did not.
2017–2020: The First Trump Administration Rewrites the Math
That lower number was, as Resources for the Future explained, “too low to make climate policies economically justifiable.” Rules that had provided a cost-benefit analysis supporting strict emissions rules under Obama suddenly no longer did so. The Clean Power Plan, the centerpiece of Obama’s climate policy, was repealed partly on the grounds that the climate benefits recalculated with the lower number no longer exceeded the costs. According to Scientific American, the change in the social cost of carbon was “determinative” in at least half a dozen petroleum-sector rollbacks during the first Trump term. Simply, it gave emitters an easy out.
2021–2024: Biden Restores, Then Raises, The Price Sharply
Biden reinstated the working group and set an interim value of about $51 per ton, adjusted for inflation. Legal challenges from some states were dismissed.
In November 2023, EPA set a new central estimate for the social cost of carbon: $190 per ton for 2020 emissions, rising to $230 by 2030 and $308 by 2050. This increase drew on updated climate science, new economic models, a lower discount rate of 2%, and two decades of scientific progress clarifying warming’s impact on economic growth, climate-driven mortality, and previously understated risks.
Other governments took note. Canada adopted the updated EPA number in 2023. Germany adapted the underlying model for its own analyses in 2024.
2025: The Second Trump Administration Tries to Erase It
On his first day back in office, January 20, 2025, President Trump signed Executive Order 14154, “Unleashing American Energy,” which disbanded the Interagency Working Group, withdrew its estimates, and directed EPA to consider eliminating the social cost of carbon from federal permitting and regulatory decisions entirely. The order called the metric “marked by logical deficiencies, a poor basis in empirical science, politicization, and the absence of a foundation in legislation.”
In March 2025, EPA Administrator Lee Zeldin announced the agency would “overhaul” the social cost of carbon. In May 2025, a follow-up executive memorandum directed federal agencies to stop factoring climate-related economic damage into their regulations and permitting decisions, except where statute requires it.
Where agencies are still legally obligated to put a number on it, the administration has settled on an interim estimate of as little as $1 per ton of CO₂, a return to the first Trump administration’s methodology, with domestic-only damages and higher discount rates. The companion social cost of methane dropped from $1,470 per ton to $58. In July 2025, the White House guidance went further, instructing agencies that any required analysis should be limited to “the minimum consideration required to meet a statutory requirement” and, where possible, should not be monetized at all. The practical effect: $1 per ton on paper, $0 in most decisions.
The cycle is now in its third full reversal since 2008. Each time the number changes, so does the federal government’s willingness to regulate emissions.
What the New Research Adds
The new study in Nature does something the federal estimates have never done well: it separates past damage from future damage, and it assigns both to specific emitters. Their framework treats every ton of CO₂ as an asset that pays out negative returns; it’s a garbage bill that keeps accruing interest. Using that framework, they found three things that reshape the conversation.
A ton of CO₂ emitted in 1990 has already caused about $180 in global damages by 2020. That same ton will cause an additional $1,840 in damages between now and 2100 — 10 times more. Using the authors’ conservative assumptions, which use a 2% discount rate with damages capped at 2100, the social cost of carbon for a ton emitted today is approximately $1,013. That is more than five times the Biden EPA’s $190 estimate, and higher estimates are possible under longer time horizons or lower discount rates.
Settling the bill for climate damage that has already happened would only cover a small fraction of the damage still to come from the same emissions. Past payments do not clear past debts.
Individuals and Corporations Run Up the Carbon Bill
The study also puts numbers on the kinds of choices that fill everyday life.
One extra long-haul flight per year for a decade produces roughly $25,000 in future discounted damages by 2100.
Switching from a meat-heavy to a vegetarian diet for a decade avoids about $6,000 in future damages.
Installing and using a heat pump for a decade results in an additional $6,000 in avoided damage.
Cutting driving by 10%, another $6,000 less future cost.
At the corporate scale, the numbers are staggering. Emissions from Saudi Aramco’s fossil fuel production between 1988 and 2015 are estimated to cause $64 trillion in cumulative discounted damages through 2100. ExxonMobil’s comparable share: $29 trillion. These are bigger than the annual GDP of most countries.
Today’s Cost, Tomorrow’s Reality
The social cost of carbon can feel like a number on a page in a regulatory document. It is not. It is a bridge between the world you are living in now and the world you will inherit.
When the federal government uses a low social cost of carbon, or no number at all, it writes rules that allow more emissions. More emissions mean a hotter atmosphere, which means stronger storms, longer fire seasons, lower crop yields, higher air conditioning bills, and more days when outdoor work becomes dangerous. Those consequences do not arrive as a lump sum in 2100.
They arrive gradually, starting now, and compounding in the form of flood and wildfire damage, biodiversity loss, and even defense spending to prevent immigration. The Nature researchers emphasize that their estimates are almost certainly too low because GDP damage functions do not capture losses of biodiversity, loss of cultural homelands, harm to mental health, or many slow-moving impacts such as sea level rise.
When the federal government uses a high social cost of carbon, it writes rules that prevent emissions. Those rules have costs today, sometimes real ones, paid by workers in fossil fuel industries, by consumers adjusting to new standards, by companies retooling their operations. The social cost of carbon does not eliminate those costs. It weighs them against costs that will otherwise fall on other people, in other places, at other times. That weighing is a choice about who counts.
The history traced here is, in that sense, a history of that choice, and none of those decisions are final. Courts have repeatedly ruled that federal agencies cannot treat the value of carbon-emissions reductions as zero. The 2008 ruling that gave rise to this framework is still on the books. Whatever the current administration does, the legal obligation to account for climate damages in cost-benefit analysis remains, and the science underpinning the newer, higher estimates continues to strengthen.