Normal view

When words look like their meaning, we process them faster, new research reveals

The shape of the word bubble resembles the shape of an actual bubble, according to research participants. (Unsplash)

Think about a word that looks like its meaning. For instance, the word bed kind of looks like a bed, with the vertical lines resembling the posts at either end. Loop looks very loopy.

Some words are more subtly evocative — like blizzard, whose zigzagging letters might evoke something chaotic.

The term for this is “iconicity” and it has typically been studied in the sounds of words. For example, the word meow resembles the sound of a cat. The word teeny sounds like something small.

My recent study explored iconicity in the visual appearance of words in English for the first time. I found that people processed words faster and more accurately when the words physically resembled their meanings.

English letters began as visual symbols

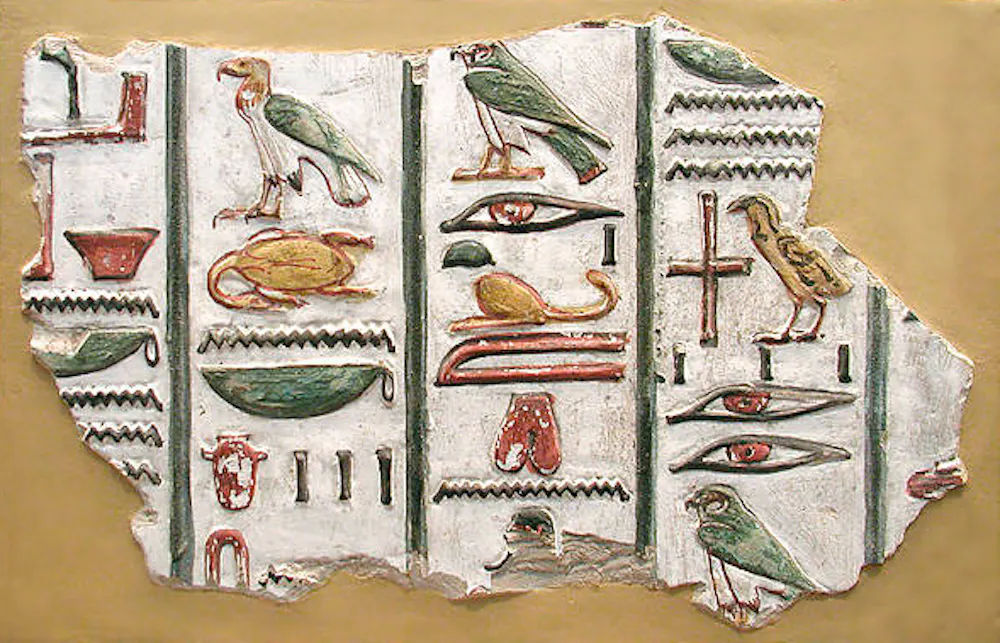
The letters we use in English (which is a Latin script inherited from the Roman alphabet) actually started out as visual symbols. They likely evolved from Egyptian hieroglyphs.

One possibility is that these Egyptian symbols were adopted by speakers of a North Semitic language, around 1800-1600 BC, into what is called the “Proto-Sinaitic” script.

Egyptian hieroglyphs depicting birds, eyes and other images in green, red and gold colour.
Hieroglyphs from the tomb of Pharaoh Seti I, in Egypt’s Valley of the Kings. (Wikimedia Commons)

This script used symbols to code for the first sound of the pictured thing. This is called the acrophony principle. For example, our letter M comes from a symbol for water, taking the first sound of the word mayim.

The letters have changed so much that these ancient origins aren’t relevant to reading English today. But there is some evidence that the shapes of letters have some relationship to the sounds they convey. For example, one study assembled letters for the sound /i/ (as in bee) and /u/ (as in boo) from 56 different languages and asked people to guess which was which. It turned out that people could do this, more often than expected by chance.

But this isn’t quite what I was interested in here. Rather than asking if the shapes of letters are related to the sounds of words, I was interested in whether those shapes are related to the meanings of words.

Bubble, hoop, wiggle

In this research, I asked participants to rate more than 3,000 words according to how much the shape of their letters resembled their meaning, using a scale of one to seven.

This is a common approach in the study of psycholinguistics. We often ask people to rate words on one dimension — for example, how concrete a word is, or how positive a word is — and then use those ratings to understand how people process word meaning.

The first thing to note is that there was agreement across participants, at least on par with ratings of other word properties in the past.

The highest-rated words included bubble, look, wiggle, hoop, puppy and bed.

It’s easy to come up with explanations for these ratings. Puppy looks like it has legs and a tail. There is something wiggly about the two G’s in the middle of wiggle.

But can we actually tell how participants made their ratings? We can get some clues by looking at the kinds of words that get higher ratings.

Round letters, spiky letters

Words with high ratings tended to refer to things you can see. This makes sense if participants were actually considering a resemblance between the word and its meaning.

Getting more specific, when a word for a round thing contained round letters (for example, O, G and C), it was rated higher. When a word for a spiky thing contained spiky letters (like W, Z and X), it was rated higher. Words for small things tended to be rated higher when they contained fewer letters.

All in all, it seems like the ratings actually did capture a resemblance between the look of a word and its meaning.

This is all well and good, but does it matter? To answer this, I used three existing databases with information on how quickly people can process individual words. These are from studies that, for example, present participants with strings of letters (for example, spoon or flarg) and have them identify them as real or invented words as quickly as possible.

In all three databases, I found that people were faster and more accurate at processing words that looked like their meanings. This was after accounting for all kinds of things like how common a word is, how many letters it contains and how easy a word’s meaning is to picture. Not only that, these words tended to be learned at an earlier age.

There is a growing appreciation that language is more than words and their meanings. It involves all kinds of things like tone of voice, gesture and gaze. We can now add one additional subtle cue: the shapes of letters.

The Conversation

David Sidhu receives funding from NSERC and SSHRC.

Received — 28 April 2026 The Conversation

Reading gains in Alabama, Mississippi and Louisiana are often touted, but don’t show full picture of literacy

A fourth grade teacher leads a small group of students in a reading exercise in March 2023 at Tuskegee Public School in Tuskegee, Ala. Julie Bennett/The Washington Post via Getty Images

Despite decades of legislation meant to boost children’s reading levels, literacy scores have remained relatively stagnant across the U.S. over the past 30 years.

Educators, policymakers and parents were genuinely excited in the late 2010s, when three Southern states – Alabama, Mississippi and Louisiana – appeared to buck the literacy trend. All three of these states, which have long lagged in literacy scores, made notable gains in fourth grade reading scores from 2013 to 2024, as measured by the National Assessment of Educational Progress, or NAEP.

We are researchers in literacy and learning. Two of us are at the University of Alabama and Mercer University, where we educate elementary teachers. The other two work at Temple University, where we research early language and the science of learning. We all study how children develop as readers and how teaching styles and policies shape that development.

Some observers and scholars have called Alabama, Mississippi and Louisiana’s reading gains the “Southern surge” and say this progress shows that recent literacy reforms are working.

A straightforward explanation has taken hold: As more schools spent additional time on phonics and implemented other “science of reading” reforms, students became stronger readers.

This narrative accurately captures some of the available evidence. But it also simplifies a complex set of patterns in literacy data, and it limits the discussion that policymakers should have.

A girl with blonde hair and a large bow wears a face mask and raises her hand, while she sits at her desk in a classroom with other students and books.
A fourth grade student raises her hand during a reading and language arts class in Columbia, Miss., in August 2020. Edmund D. Fountain/The Washington Post via Getty Images

Reading scores under pressure

Since the early 2000s, new federal and state policies have placed pressure on schools to improve students’ reading outcomes. The 2001 No Child Left Behind Act required all states to track and report literacy testing results. This law, which the Obama administration replaced in 2015 with the Every Student Succeeds Act, mandated annual testing in reading and math for students in third through eighth grades.

Many schools narrowed their curriculum to try to boost their students’ reading scores. They cut time for science, social studies, art and recess to focus on reading and math. Students entering school in the early 2000s – the first classes fully exposed to No Child Left Behind’s requirements – spent more time on reading instruction than any previous generation.

But sustained reading gains still didn’t follow.

The NAEP is often called the nation’s report card. It is the only federally administered test that allows meaningful comparisons in reading levels across states.

The NAEP found that fourth grade reading scores nationwide increased modestly beginning in 2005. They peaked around 2017 and have declined since.

But there’s a complication in how those scores are interpreted. NAEP’s mid-level score, called “proficient,” does not mean a student is reading at grade level – it reflects a high standard that most students do not reach. In the case of fourth grade readers, it means they can recognize a text’s structure and organization, explain how characters influence others and make other complex observations. Students can also receive a lower “basic” score, or a higher “advanced” one.

Alabama’s example illustrates the gap that can emerge between NAEP test results and a state’s assessments.

The state’s 2025 assessments show that 81% to 88% of second and third graders were reading “on grade level.” But the 2024 NAEP shows only about 30% of Alabama fourth graders – the youngest grade the NAEP measures for literacy – were “proficient” at reading.

Both numbers can be accurate. They reflect different definitions and measurement systems.

Understanding reading gains in the South

Despite differences in measuring reading, a small number of states have shown clear improvement over the past decade, according to the NAEP.

Mississippi has shown the strongest gains. In 2013, it was 49th out of all 50 states when it came to ranking fourth grade reading scores. In 2024, Mississippi climbed to ninth in fourth grade reading.

Mississippi’s progress predates recent national attention to the science of reading – meaning, the body of research on reading – suggesting its gains cannot be attributed solely to the current wave of related reforms.

In 2013, Mississippi passed the Literacy-Based Promotion Act, which combined early reading screening, teacher training, literacy coaching and additional support. Research shows that the policy could account for roughly five points of reading gains, on average. These gains reflect long-term, system-wide efforts rather than a rapid shift tied to a single policy change.

At the middle school level, however, the pattern in Mississippi looks different.

Improvements in fourth grade reading have not translated into similar gains in eighth grade reading. Early improvements in children’s ability to decode words do not necessarily lead to success with more complex texts that require additional vocabulary and background knowledge.

This gap does not negate Mississippi’s progress, but it does raise questions about what the next decade of work needs to look like.

Louisiana’s reading score trajectory is more modest. Recent NAEP scores for fourth grade students in Louisiana are similar to those from the mid-2010s – a rebound to a prior level.

While Louisiana ranked 50th in fourth grade reading in 2019, it rose to 38th in 2024.

A 32-point gap between Black and white students’ average fourth grade reading scores persists in 2024 data, nearly unchanged from the late 1990s. In this case, some reading progress happened. Yet the underlying inequities between students did not shift.

Alabama’s results illustrate a third pattern: relative stability in fourth grade reading scores during a period of national decline. The state ranked 35th in fourth grade NAEP reading in 2013 and remains in a similar position in 2024, showing little change. The state’s average NAEP score for fourth grade students shifted by a single point between 2019 and 2024 – not a surge, but a state holding its ground while others fell.

Meanwhile, chronic absenteeism has fallen in Alabama since 2019. As research links attendance to academic achievement, it makes it difficult to attribute the state’s small shift in reading scores to any single factor.

Across all three states, substantial gaps between Black and white students’ reading scores persist on NAEP scoring.

The same pattern extends nationally to Hispanic students, poor students and other groups. This shows that fourth grade students’ reading gains have not been accompanied by comparable reductions in social, racial and ethnic inequities.

A woman stands near a projector screen in front of a group of children seated on the floor in a classroom.
Students follow a reading lesson in a first grade class in Aurora, Colo., in October 2024. Hyoung Chang/The Denver Post via Getty Images

A more complicated story

Still, parts of the Southern surge in reading is genuinely encouraging. It is also the latest chapter in a long story.

Mississippi’s gains, for example, came alongside coaching, professional development and early intervention.

Louisiana’s reading recovery unfolded alongside a 34% increase in education funding over the past decade.

Test score changes reflect a combination of policy decisions, classroom practices and broader conditions, often unfolding over many years. Reading is hard to teach, hard to sustain and not connected to any one policy shift.

The Conversation

The authors do not work for, consult, own shares in or receive funding from any company or organization that would benefit from this article, and have disclosed no relevant affiliations beyond their academic appointment.

❌